
| Author | Affiliation |
|---|---|
| Karen L. Murrell, MD, MBA | Kaiser Permanente, Department of Emergency Medicine, South Sacramento Medical Center |
| Steven R. Offerman, MD | Kaiser Permanente, Department of Emergency Medicine, South Sacramento Medical Center |
| Mark B. Kauffman, RN, MBA | Kaiser Permanente, Department of Emergency Medicine, South Sacramento Medical Center |
ABSTRACT
Introduction:
Emergency department (ED) crowding creates issues with patient satisfaction, long wait times and leaving the ED without being seen by a doctor (LWBS). Our objective was to evaluate how applying Lean principles to develop a Rapid Triage and Treatment (RTT) system affected ED metrics in our community hospital.
Methods:
Using Lean principles, we made ED process improvements that led to the RTT system. Using this system, patients undergo a rapid triage with low-acuity patients seen and treated by a physician in the triage area. No changes in staffing, physical space or hospital resources occurred during the study period. We then performed a retrospective, observational study comparing hospital electronic medical record data six months before and six months after implementation of the RTT system.
Results:
ED census was 30,981 in the six months prior to RTT and 33,926 after. Ambulance arrivals, ED patient acuity and hospital admission rates were unchanged throughout the study periods. Mean ED length of stay was longer in the period before RTT (4.2 hours, 95% confidence interval [CI] = 4.2–4.3; standard deviation [SD] = 3.9) than after (3.6 hours, 95% CI = 3.6–3.7; SD = 3.7). Mean ED arrival to physician start time was 62.2 minutes (95% CI = 61.5–63.0; SD = 58.9) prior to RTT and 41.9 minutes (95% CI = 41.5–42.4; SD = 30.9) after. The LWBS rate for the six months prior to RTT was 4.5% (95% CI = 3.1–5.5) and 1.5% (95% CI = 0.6–1.8) after RTT initiation.
Conclusion:
Our experience shows that changes in ED processes using Lean thinking and available resources can improve efficiency. In this community hospital ED, use of an RTT system decreased patient wait times and LWBS rates.
INTRODUCTION
Emergency department (ED) crowding is a major concern that affects both patients and providers. EDs today provide a safety net for patients without medical insurance and are used by patients who need evening and weekend service. In 2003 there were almost 114 million visits to EDs, up almost 26% from 1993. During this same period, 425 EDs closed nationwide.1 The Institute of Medicine’s Committee on the Future of Emergency care in the United States Health System recommended that improving hospital efficiency and patient flow become a top priority for the nation’s hospitals and EDs.1
Lean is a set of business operating principles developed by Japanese auto manufacturers.2,3,4 These principles may be applied to any business system and have been successfully used for healthcare and in emergency medicine in the past.5–10 Lean principles seek to increase efficiency, decrease waste, and promote flow through the system. The goals of this paper were to evaluate and discuss the application of Lean principles to our ED processes. In particular we were interested in how the redesign of ED systems to develop a Rapid Triage and Treatment (RTT) system, using existing resources, affected certain important ED metrics (left without being seen [LWBS] rates, waiting times, ED length of stay [LOS]).
METHODS
Study Design, Settings, and Participants
We performed a retrospective, observational study before and after implementation of a rapid triage and treatment (RTT) system within our ED. The Kaiser Foundation Research Institute Investigational Review Board approved this study.
ED Setting
Our ED, located approximately ten miles from downtown Sacramento, California, sees approximately 67,000 patients annually. We were not a trauma center at the time of this study. Our ED saw a nearly 100% increase in volume between 1999 and 2001 due to several factors. There was tremendous community growth in the South Sacramento/Elk Grove area. Elk Grove, (just south of our facility) was the fastest growing city in the nation among cities with population >100,000.11 Kaiser Permanente health plan membership in this area has steadily grown to a current level of over 50% penetration in the insured market. Our ED also treats approximately 20% non-health plan patients.
Kaiser Permanente South Sacramento Medical Center has 118 licensed hospital beds. Depending on time of day, two to five physicians staff 38 ED beds. During peak census hours, hallway gurneys provide up to nine additional beds. Residents of all levels from the University of California Davis Emergency Medicine Residency Program rotate through our department. All resident cases are supervised by attending emergency physicians. Resident presence varies, with zero to three residents in the department at any time. Attending physician staffing does not change based on resident presence.
ED Process Prior to RTT System
Prior to initiation of the RTT system, our patient flow process was similar to that of many EDs. Upon arrival, an ED technician “greeter” met patients and determined whether there was need for immediate placement into the patient care area. Non-critical patients then experienced multiple delays before evaluation by a physician. First, a nurse performed an extensive “medical screening examination” (MSE). This MSE consisted of 18 questions, including chief complaint, brief history, vital signs, allergies, medications, domestic violence regulatory question and focused physical examination. The nurse then sent the patient to be registered by a hospital registration clerk. After this triage process, which took an average 12–18 minutes, patients returned to the waiting room. When an ED bed became available, the patient was placed in an exam room and evaluated by a second nurse. Following this evaluation, the patient was assigned to and seen by a staff physician. Our physician staffing consisted of two to five physicians depending on time of day. Nursing staffing consisted of 14–18 nurses and four to six ED technicians, also depending on time of day. No changes in physician, nursing or technician staffing were made during the study period.
Prior to the study period we employed different strategies to deal with lower acuity patients, including a “fast track” (urgent care). This system of care entailed an extensive patient triage, then redirection of lower acuity cases to the “fast-track” area. These patients waited in a separate waiting room before being seen by the “fast-track” emergency physician. This inefficient system created repetitive queues and extra steps. In the worst-case scenario, a patient was mis-triaged from the ED to “fast-track” then returned to the main ED after evaluation by the fast-track physician. Mis-triage caused delays for patients and wasted work for ED staff. Additionally, our hospital administration had regulatory concerns related to triaging of patients out of the ED to a lower level of care.
Process Improvements and Implementation of RTT System
We focused on staff and physician involvement in these process changes. A critical aspect of the Toyota production system, the pioneers of Lean application, is the involvement of those providing value-added steps at every level of process design and modification.2,7 This “bottom up” management philosophy is critical for the successful implementation of process improvements and elimination of waste.2,3 Months prior to any system changes, we initiated weekly “process improvement” meetings to draw nurses, ED technicians, physicians, and department leadership into this process. Staff input was introduced, discussed, and process changes planned.
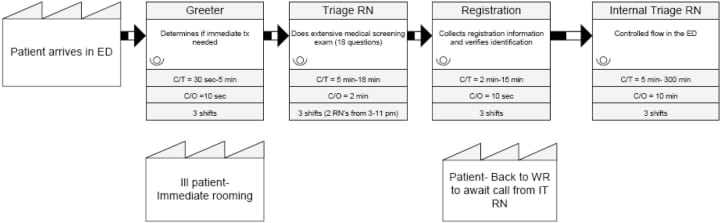
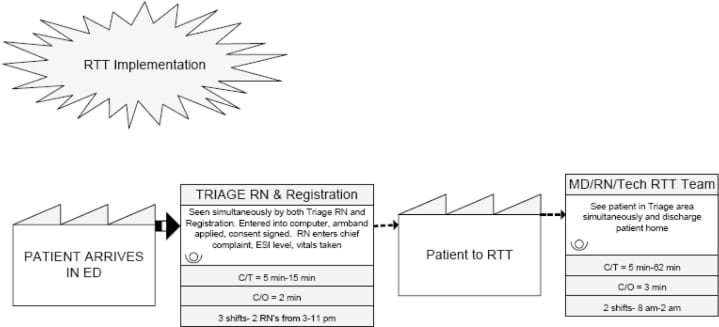
We then applied the five Lean steps (system evaluation, identification of value/waste, elimination of waste, creation of improved flow and constant adaptation to changes) to improve LWBS numbers in our ED.1 First, we directly observed the flow of patients through the system and developed a value stream map.1,5,6 Value stream mapping is technique to analyze the flow of materials and information required to bring a product or service to a consumer. In the ED, a value stream map is simply a diagram showing the progression of patients through the system as services are provided (Figures 1 and and2).2). From these observations, we identified steps that did not add value for the patient. Value in a Lean system is any operation or process step that contributes directly to providing the service or product the patient/customer desires. Waste is defined as any work, time or supplies that add no value in the eyes of the customer (or patient).3 We then streamlined our triage and admitting processes to remove waste. An “RTT” physician was placed in an area immediately adjacent to the triage nurses (formerly triage bays), which decreased unnecessary movement and allowed that physician to immediately address triage questions, thus decreasing mistriages. We also partnered the RTT physician with one nurse to increase efficiency through improved communication and teamwork. Following these process improvements, we have maintained a system of constant re-evaluation to identify problems and make further modifications as needed. Most of this work of re-evaluation is done at weekly process meetings involving ED technicians, nurses and physicians.
ED Process after RTT System
Following initiation of the RTT system, the flow process has been significantly altered for patients presenting to the ED. The re-arranged triage area places a triage nurse and registration clerk close by, so that the initial triage and registration processes may be performed simultaneously. Upon arrival patients undergo a “quick registration,” including name and medical record number entry into the computer system, armband placement and consent signature. Full registration processes are then completed after patients have been seen by a physician. Concurrently a nurse obtains vital signs, collects the chief complaint, records allergies, and assigns Emergency Severity Index (ESI) triage category. A regulatory domestic violence question is also asked at this point. The performance goal for this team is under two minutes. The ESI triage criteria is a 5-level triage system designed to rapidly sort patients not only by acuity, but by likely need for ED resources.12,13
Higher acuity patients (ESI 1, 2, or 3) are immediately placed into examination rooms in the main patient care area and assigned to a physician. Lower acuity patients (ESI level 4 or 5) are placed into the RTT area, which consists of several hallway chairs and three small examination/procedure rooms (formerly triage bays). This area is immediately adjacent to the triage team in the triage area. The RTT physician treats and releases patients placed in the RTT area, apart from the main patient care area. Resource allocation in the RTT area is at the discretion of the RTT physician; usually two rooms are used for examinations and the third for minor procedures (i.e.: small lacerations, casting, foreign body removal, etc.). Under the RTT system, lower acuity patients may also be evaluated and treated while seated in ED hallway chairs. RTT patients who are uncomfortable with being treated from a chair have the option of waiting for an open bed in the main patient care area. This option is prominently posted on signs within the RTT area. In the event that the RTT area is full, lower acuity patients (ESI level 4, 5) may be placed in the waiting room until space becomes available. The theoretical effect of this system is to maintain space in the main patient care area for rapid rooming of higher acuity patients (ESI 1,2,3), while lower acuity patients (ESI 4,5) are triaged and treated as efficiently as possible from the RTT area.
During the study period, the RTT area was open from 8 am to 2 pm. Staffing consisted of one physician and one nurse. An ED technician may also be assigned to the area depending on availability and time of day. The RTT physician and nurse are encouraged to communicate and work closely as a team, and the triage nurses are encouraged to communicate freely with the RTT physician to resolve any triage questions or issues as they arise. Simple imaging tests may be ordered by the triage nurse prior to RTT placement in anticipation of patient needs.
Methods of Measurement, Data Collection and Analysis
All study data was extracted from the Kaiser Permanente Healthconnect system, which is the electronic medical record (EMR) order entry, and patient-tracking system used at our hospital. Treating nurses and physicians document all patient activity prospectively into the system at the time of the patient’s ED visit. Data was analyzed for six months prior to RTT initiation and six months following RTT. A one-month start-up phase was excluded from data analysis as we considered this a transitional period during which staff and physicians were learning new ED processes.
We report ambulance arrival rates, hospital admission rates, LWBS rates, ESI triage levels, LOS times, arrival to emergency physician start times and arrival to room times using simple descriptive statistics. We provide 95% confidence intervals where appropriate and made comparison of proportions using Chi-squared test for ambulance arrival rates, hospital admission rates, LWBS rates and ESI triage levels. We used student’s T-test for comparison of mean LOS times, arrival to emergency physician start times and arrival to room times. We performed all data analysis using SAS statistical software (version 9.1.3, released 2004).
RESULTS
We implemented the RTT system February 1, 2007. We evaluated the six-month period prior to implementation (August 2006 – January 2007) and the six-month period following implementation (March 2007 – August 2007). We excluded data from the first month of RTT (February 2007).
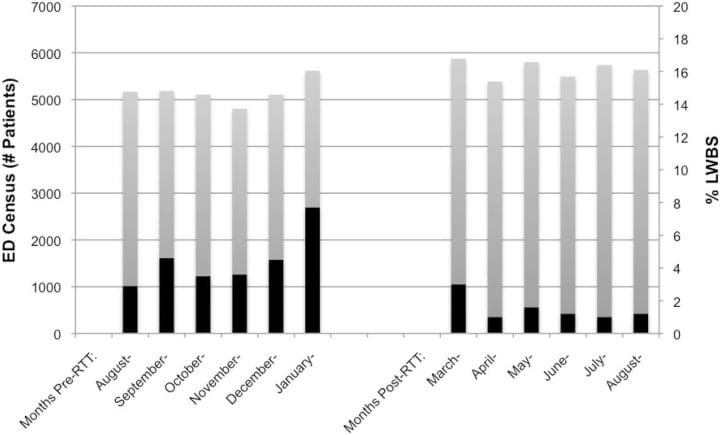
The ED census was 30,981 in the six months prior to RTT and 33,926 in the study period after RTT. The mean monthly census was slightly lower in the period before RTT (5163.5; 95% confidence interval [CI] = 4954.7–5372.3; standard deviation [SD] = 261.0) when compared to that after RTT (5654.3; 95% CI = 5504.8–5803.8; SD = 186.8). Lower acuity patients (ESI levels 4 & 5) comprised a similar proportion of patients during both time periods (42.1% vs. 43.2). The percentage of patients arriving by ambulance was also similar in the period prior to RTT (12.8%, 95% CI = 12.3–13.3) and after RTT (12.4%, 95% CI = 12.0–12.8). Hospital admission rate was 12.9% (95% CI = 12.7–13.1) prior to RTT and 11.6% (95% CI = 11.2–12.0) after RTT. (Table #1)
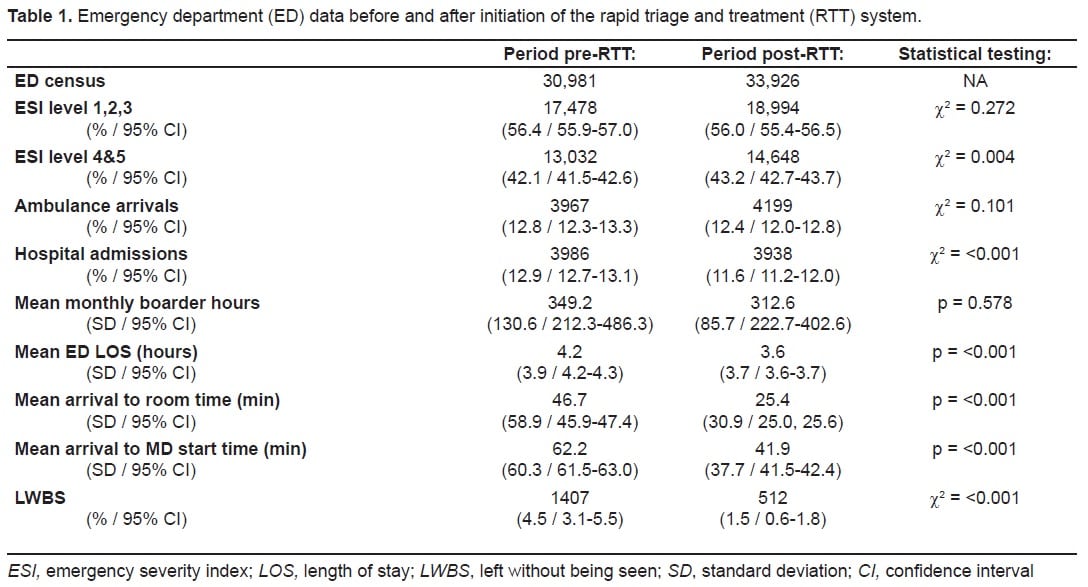
Despite an increasing ED census, we found that the LWBS rates decreased between study periods. The mean LWBS rate for the six months prior to RTT was 4.5% (95% CI = 3.1–5.5) and 1.5% (95% CI = 0.6–1.8) after RTT initiation. In the month directly preceding the implementation of the RTT process, the LWBS rate had risen as high as 7.7%, but in the first month following RTT had decreased to 3.0% (Figure 1 and Table 1).
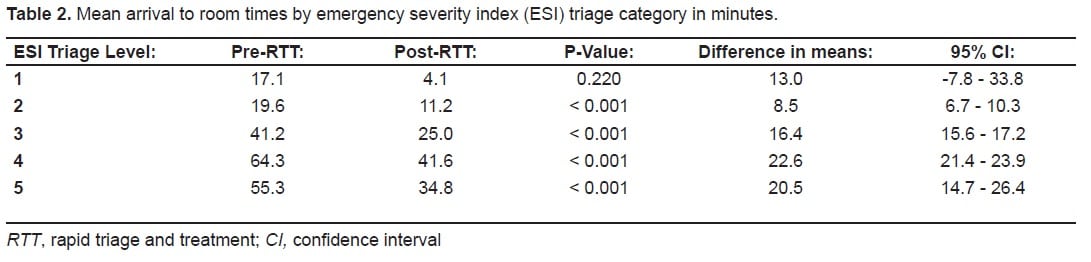
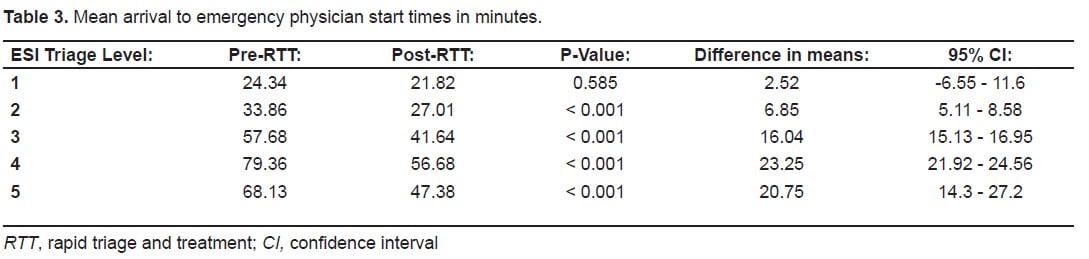
The mean ED length of stay was longer in the period before RTT (4.2 hours, 95% CI = 4.2–4.3, SD = 3.9) than after RTT (3.6 hours, 95% CI = 3.6–3.7; SD = 3.7). The mean ED arrival time to physician start time was 62.2 minutes (95% CI = 61.5–63.0; SD = 60.3) in the period prior to initiation of RTT and 41.9 minutes (95% CI = 41.5–42.4; SD = 37.7) after RTT. Arrival time to room time was 46.7 minutes (95% CI 45.9–47.4; SD = 58.9) prior to RTT vs. 25.4 minutes after RTT (95% CI = 25.1–25.7; 30.9) [Table 1]. Tables 2 and and33 show the mean arrival times to room time and physician start time broken down by ESI triage category.
DISCUSSION
This study demonstrates that by decreasing inefficiencies associated with our triage process and creating a more efficient system for treating lower acuity patients in our ED, we were able to significantly decrease waiting times and LWBS rates. These process improvements were made without changes in existing ED resources. Prior to implementation of the RTT system, LWBS rates were steadily climbing reaching a high of 7.7% in the month just prior to RTT. The mean LWBS rate in the pre-RTT period was 4.5% and in the post-RTT period was 1.5%. This improvement in LWBS occurred despite a slight increase in ED census and similar numbers reflecting ED acuity (ESI acuity, ambulance arrivals) [Table 1].
There was, however, a significant decrease in hospital admission rates between the pre-and post-RTT periods (12.9%; 95% CI 12.7–13.1 vs. 11.6%; 95% CI 11.2–12.0). It is not clear whether this change represents a difference in baseline characteristics of the two study groups or is a result of implementation of the RTT system. Determination of whether the RTT actually caused a decrease in hospital admission rates would require more study.
We feel that the decreases in patient waiting times (ED presentation to room time and ED presentation to emergency physician start times) that we observed were the primary factors leading to improvement in LWBS rates. It has been shown previously that ED LWBS rates (and patient satisfaction) are directly associated with patient waiting times to see a physician.14–18 The largest decreases we observed occurred in lower acuity patients (ESI triage category four and five). However, waiting times for category two and three patients also appeared to improve (Tables 2 and and33).
Because ED crowding and rising census are widespread problems, several strategies have been attempted to improve ED patient waiting times in the face of increasing census numbers:
EDs can Increase Department Resources to Meet Census Needs
Unfortunately this option requires a substantial financial commitment as multiple resources must be increased simultaneously (i.e.: nurses, physicians, clinical space, radiology, and lab). Partial resource enhancement tends to simply move the resource “bottleneck” to another area of the ED. Flexible resource expansion (at times of high volumes) would be ideal, but is frequently impractical. Generalized resource expansion ensures periods of low resource utilization at a substantial cost.
Departments can Seek to Decrease ED Volumes
Referral of low acuity patients to outside clinics has been attempted 19,20 but with multiple drawbacks. Use of a “triage out” system does require dedication of some ED resources for MSE and clinic transport. Unfortunately, these activities do not add value for the patient and, in the end, are completely wasted steps. Also, mis-triage to a lower level of care is a potentially harmful error both from the standpoint of patient care and potential regulatory violation of the Emergency Medical Treatment and Active Labor Act.
EDs can Seek to Decrease the Acuity of Patients they See
In one previous study, increasing numbers of “trauma & resuscitation” patients were directly associated with LWBS rates.14 These high acuity resuscitation patients divert scarce ED resources and slow department throughput. Additionally, in the era of nursing ratios, a single critical patient can close three ED beds. While we cannot control the patients who present to our departments, ambulance diversion might be used as a method to control ED patient acuity. Unfortunately, ambulance diversion has adverse effects on the emergency medical services system and is a frequently applied measure of ED quality.
Departments can Seek to Rearrange Resources to Optimize Efficiency and Decrease ED Wait Times
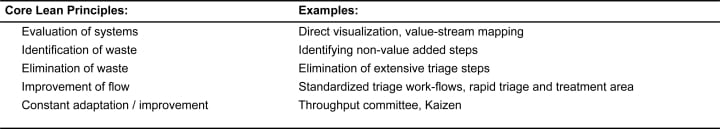
Several studies have demonstrated that better use of existing ED resources can lead to improved metrics.14,21–23 In our department we sought to apply Lean principles to our ED processes to develop efficiency, thus improving patient wait times and LWBS numbers. Lean is a business concept that has previously been applied to ED systems to improve patient care processes.6,7,8,9,10 Because the ED is comprised of multiple different work flows making up the patient care experience it is both an ideal and difficult setting for creation of Lean process changes. The application of Lean principles requires: evaluation of systems, identification of waste, elimination of waste, improvement of flow, and constant adaptation to change (Figure 1). The core concept of Lean is that the only important steps in any process are those that add value for the customer (or patient in this case). Value is any operation or process step that contributes directly to providing service to the patient. Waste is any activity that doesn’t add value.
The initial step in implementing any Lean system is actually watching the processes and mapping workflows, rather than describing them from memory. For the process improvement described in this paper, we made a value-stream map of the entire ED experience for low acuity patients prior to any discussion of improvements (Figure 2). The use of frontline workers to develop process improvements is another key Lean principle. In our department we formed a “throughput committee” comprised of all levels of ED workers. All staff members were coached in the Lean principle of “continuous process improvement” and were invited to give input on the process throughout the timeline. This “bottom up” approach tends to yield the best ideas for process improvements and better implementation of those improvements.
Members of the throughput committee then dissected each portion of the value-stream map and classified activities as “value-added” or “non-value added.” In our process, we first identified that certain triage questions could be considered non-value added and eliminated them. We further evaluated the value-stream map and developed a shortened workflow for lower acuity patients to improve throughput times (Figure 3). We also used 5-S principles to standardize equipment in the triage and RTT areas.24 In our experience, the most difficult Lean process adaptation is standardization of workflows. It is critical that all members of the healthcare team identify task sequence, and then perform them in a standard way and time. This required a cultural shift and constant vigilance by members of the committee for the first month of the implementation and beyond. It also requires that staff have an open mind and be able to adapt to changes. As stated above, investment by front-line staff members in the flow improvement process is crucial to its eventual success.
Fostering a culture of continuous process improvement among ED staff ensures that gains aren’t lost and allows for rapid adaptation to future changes. We have accomplished this in our department by continuing our multidisciplinary throughput committee, which focuses on ED processes and application of Lean to solve problems.
LIMITATIONS
The primary limitations of this study are those associated with retrospectively collected data. However, the use of the computerized EMR in our facility leads to fairly standardized and reliable data collection similar to that of prospective studies. Recall bias is not an issue as the data points of interest were recorded during the course of the patient’s ED visit.
Ideally we would have studied longer pre-and post-intervention intervals in order to adjust for any seasonal variation in ED patient patterns. However, this was difficult as we also needed to pick a study period that didn’t include any significant changes in department staffing, processes, or external factors that may have confounded our results. We therefore chose to evaluate six-month periods before and after the RTT intervention. We felt that this time period adequately represented the different seasons but, to our knowledge, did not include any confounding changes.
Unfortunately, for this study we did not collect data regarding patient satisfaction, ED return visits, insurance co-pay collection, physician relative value unit (RVU) productivity or physician satisfaction. It is unclear how use of the RTT system affected patient satisfaction, ED return rates, RVU productivity, and/or collection of co-pays in the ED. Similarly, how the RTT system may have affected physician job satisfaction is unknown.
We found a slight decrease in hospital admission rates in the post-intervention period when compared to the pre-intervention period. The reason for this difference is not clear. A decrease in admission rates might represent a decrease in patient acuities presenting to the ED between periods; however, this is not reflected in the rates of ambulance arrivals or ESI triage categories. It is also possible that institution of the RTT system somehow decreased hospital admission rates. It is unclear why this would occur.
In this paper we describe a process change at one hospital ED. It is important to note that our results may be unique to this single physician group within a single hospital system. We, however, feel that our ED is similar to many other departments in the United States and our findings will be of interest to other EDs.
CONCLUSION
In our ED we found that redesign of ED processes, using Lean principles and existing department resources, improved important metrics. By implementing an RTT system we were able to decrease patient wait times and LWBS rates. These changes occurred despite a moderate increase in ED census during the study period.
Footnotes
Supervising Section Editor: Larry Raney, MD
Submission history: Submitted: March 19, 2010; Revision received June 18, 2010; Accepted July 1, 2010.
Reprints available through open access at http://escholarship.org/uc/uciem_westjem.
Address for Correspondence: Karen Murrell, MD, MBA, Department of Emergency Medicine, Kaiser Permanente, South Sacramento Medical Center, Sacramento, CA.
Conflicts of Interest: By the WestJEM article submission agreement, all authors are required to disclose all affiliations, funding sources, and financial or management relationships that could be perceived as potential sources of bias. The authors disclosed none.
REFERENCES
1. Institute of Medicine The future of emergency care in the United States health system. Ann Emerg Med. 2006;48:115–120. [PubMed]
2. Liker J. The Toyota Way. New York, NY: McGraw-Hill; 2004.
3. Eitel DR, Rudkin SE, Malvehy MA, et al. Improving service by understanding emergency department flow: A white paper and position statement prepared for the American Academy of Emergency Medicine. J Emerg Med. 2008 Epub ahead of print.
4. Varkey P, Reller MK, Resar RK. Basics of quality improvement in health care. Mayo Clin Proc.2007;82(6):735–739. [PubMed]
5. Jimmerson C, Weber D, Sobek DK., II Reducing waste and errors: piloting Lean principles at Intermountain Healthcare. Jt Comm J Qual Patient Saf. 2005;31:249–257. [PubMed]
6. King DL, Ben-Tovim DI, Bassham J. Redesigning emergency department patient flows: Application of Lean thinking to health care. Emerg Med Australasia. 2006;18:391–7.
7. Dickson EW, Singh S, Cheung DS, et al. Application of Lean manufacturing techniques in the emergency department. J Emerg Med. 2009;37(2):177–82. [PubMed]
8. Ng D, Vail G, Thomas S, Schmidt Applying the Lean principles of the Toyota Production System to reduce wait times in the emergency department. CJEM. 2010;12(1):50–7. [PubMed]
9. Ben-Tovim D, Bassham JE, Bennett DM, et al. Redesigning care at the Flinders Medical Centre: clinical process redesign using “lean thinking” MJA. 2008;188(6):S27–31. [PubMed]
10. Eller A. Rapid assessment and disposition: applying Lean in the emergency department. J Healthcare Qual. 31(3):17–22.
11. Christie L. Fastest Growing Cities. CNNMoney.com. Available at:http://money.cnn.com/2006/06/20/real_estate/fastest_growing_cities/index.htm. Accessed May 20,2010.
12. Wuerz RC, Milne LW, Eitel DR, et al. Reliability and validity of a new five-level triage instrument.Acad Emerg Med. 2000;7(3):236–42. [PubMed]
13. Eitel D, Travers D, Rosenau A, et al. The Emergency Severity Index Triage Algorithm Version 2 is Reliable and Valid. Acad Emerg Med. 2003;10(10):1070–1080. [PubMed]
14. Hobbs D, Kunzman SC, Tandberg D, et al. Hospital factors associated with emergency center patients leaving without being seen. Am J Emerg Med. 2000;18:767–772. [PubMed]
15. Fernendes CM, Price A, Christenson JM. Does reduced length of stay decrease the number of emergency department patients who leave without being seen? J Emerg Med. 1997;15:397–399.[PubMed]
16. Stock LM, Bradley GE, Lewis RJ, et al. Patients who leave emergency departments without being seen by a physician: magnitude of the problem in Los Angeles County. Ann Emerg Med.1994;23:294–298. [PubMed]
17. Bursch B, Beezy J, Shaw R. Emergency department satisfaction: what matters most? Ann Emerg Med. 1993;22(3):586–91. [PubMed]
18. Arendt KW, Sadosty AT, Weaver AL, et al. The left-without-being-seen patients: What would keep them from leaving? Ann Emerg Med. 2003;42(3):317–323. [PubMed]
19. Derlet RW, Nishio D, Cole LM, et al. Triage of patients out of the emergency department: three year experience. Am J Emerg Med. 1992;10:195–199. [PubMed]
20. Derlet RW, Kinser D, Ray L, et al. Prospective identification and triage of nonemergency patients out of an emergency department: a 5-year study. Ann Emerg Med. 1995;25(2):215–23. [PubMed]
21. Chan TC, Killeen JP, Kelly D, et al. Impact of a rapid entry and accelerated care at triage on reducing emergency department patient wait times, lengths of stay, and rate of left without being seen. Ann Emerg Med. 2005;46(6):491–97. [PubMed]
22. Spaite DW, Bartholomeaux F, Guisto J, et al. Rapid process redesign in a university-based emergency department: decreasing waiting time intervals and improving patient satisfaction. Ann Emerg Med. 2002;39(2):168–77. [PubMed]
23. Fernandes CM, Christenson JM, Price A. Continuous quality improvement reduces length of stay for fast-track patients in an emergency department. Acad Emerg Med. 1996;3(3):258–63. [PubMed]
24. Zidel TG, editor. How to Implement Lean Principles in Hospitals, Medical Offices, Clinics, and Other Healthcare Organizations. Milwaukee, WI: Quality Press; 2006. pp. 73–86. 5S.