
| Author | Affiliation |
|---|---|
| Thomas M. Rice, MPH, PhD | University of California–Berkeley, Department of Environmental Health Services, Berkeley, California |
| Roger B. Trent, PhD | California Department of Public Health, Safe and Active Communities Branch, Sacramento, California |
| Kate Bernacki, MPH | California Department of Public Health, Safe and Active Communities Branch, Sacramento, California |
| Jennifer K. Rice, MPH | University of California–Berkeley, Health Services and Policy Analysis, Berkeley, California |
| Bonnie Lovette, RN, MS, PNP | Children’s Hospital and Research Center Oakland, Trauma Service, Oakland, California |
| Eileen Hoover, RN, MS | Santa Clara Valley Medical Center, Trauma Services, San Jose, California |
| Janette Fennell | KidsAndCars.org, Leawood, Kansas |
| Anna Zacher Aistrich, MPH | San Francisco General Hospital, San Francisco Injury Center, San Francisco, California |
| Dana Wiltsek, MSW | Stanford University Medical Center, Trauma Service, Stanford, California |
| Ellen Corman, MRA | Stanford University Medical Center, Trauma Service, Stanford, California |
| Craig L. Anderson, PhD, MPH | University of California–Irvine, Department of Emergency Medicine, Orange, California |
| John Sherck, MD | Santa Clara Valley Medical Center, Trauma Services, San Jose, California |
ABSTRACT
Introduction:
Every year in the United States, thousands of young children are injured by passenger vehicles in driveways or parking areas. Little is known about risk factors, and incidence rates are difficult to estimate because ascertainment using police collision reports or media sources is incomplete. This study used surveillance at trauma centers to identify incidents and parent interviews to obtain detailed information on incidents, vehicles, and children.
Methods:
Eight California trauma centers conducted surveillance of nontraffic pedestrian collision injury to children aged 14 years or younger from January 2005 to July 2007. Three of these centers conducted follow-up interviews with family members.
Results:
Ninety-four injured children were identified. Nine children (10%) suffered fatal injury. Seventy children (74%) were 4 years old or younger. Family members of 21 victims from this study (23%) completed an interview. Of these 21 interviewed victims, 17 (81%) were male and 13 (62%) were 1 or 2 years old. In 13 cases (62%), the child was backed over, and the driver was the mother or father in 11 cases (52%). Fifteen cases (71%) involved a sport utility vehicle, pickup truck, or van. Most collisions occurred in a residential driveway.
Conclusion:
Trauma center surveillance can be used for case ascertainment and for collecting information on circumstances of nontraffic pedestrian injuries. Adoption of a specific external cause-of-injury code would allow passive surveillance of these injuries. Research is needed to understand the contributions of family, vehicular, and environmental characteristics and injury risk to inform prevention efforts.
INTRODUCTION
Every year in the United States, thousands of children are injured by motor vehicles in driveways or parking areas.1,2 Because of their short stature, toddlers and young children are at risk of being struck by slow-moving passenger vehicles engaged in parking maneuvers. These incidents often occur in nontraffic environments, such as single or shared driveways or other parking facilities at or near the child’s home. These incidents are not recorded by police as typical traffic or pedestrian incidents since they do not occur on public roads. Injuries to victims are sometimes fatal, and effects on family members, who are often the vehicle drivers, can be emotionally devastating. The problem has been referred to variously as backover, frontover, rollover, or driveway injury. We use the term nontraffic pedestrian collision in this paper.
Previous studies have identified many characteristics of pediatric nontraffic pedestrian collisions. Associated factors include involvement of sport utility vehicles (SUV) and light trucks,3–8 shared driveways,9 family members driving,3,10,11 late afternoon occurrence,12,13 large family size,9 and minority ethnic status.14,15 The National Highway Traffic Safety Administration estimates that there are at least 210 pediatric (aged 14 years or younger) fatalities due to these incidents per year in the United States, as well as 5,000 injuries, but this estimate is probably low because of poor ascertainment in law enforcement databases.16 The United States Centers for Disease Control and Prevention (CDC) reports similar estimates of backovers and notes that most victims are one-year olds.2 CDC’s estimate excludes frontovers and vehicles set in motion by the victim or another child. KidsAndCars.org, a national advocacy organization addressing the dangers to children in and around passenger vehicles, estimates that 68% of child deaths around vehicles in nontraffic situations are due to backovers, frontovers, or vehicles set in motion.17 KidsAndCars.org obtains much of its data through news media, which are more likely to cover incidents involving severe or fatal injuries to children than incidents resulting in less severe injury.
The objectives of this study were to (1) demonstrate the feasibility of conducting trauma center surveillance of nontraffic collision injury to young children in California and (2) enhance our understanding of the circumstances of these events to support evidence-based prevention.
METHODS
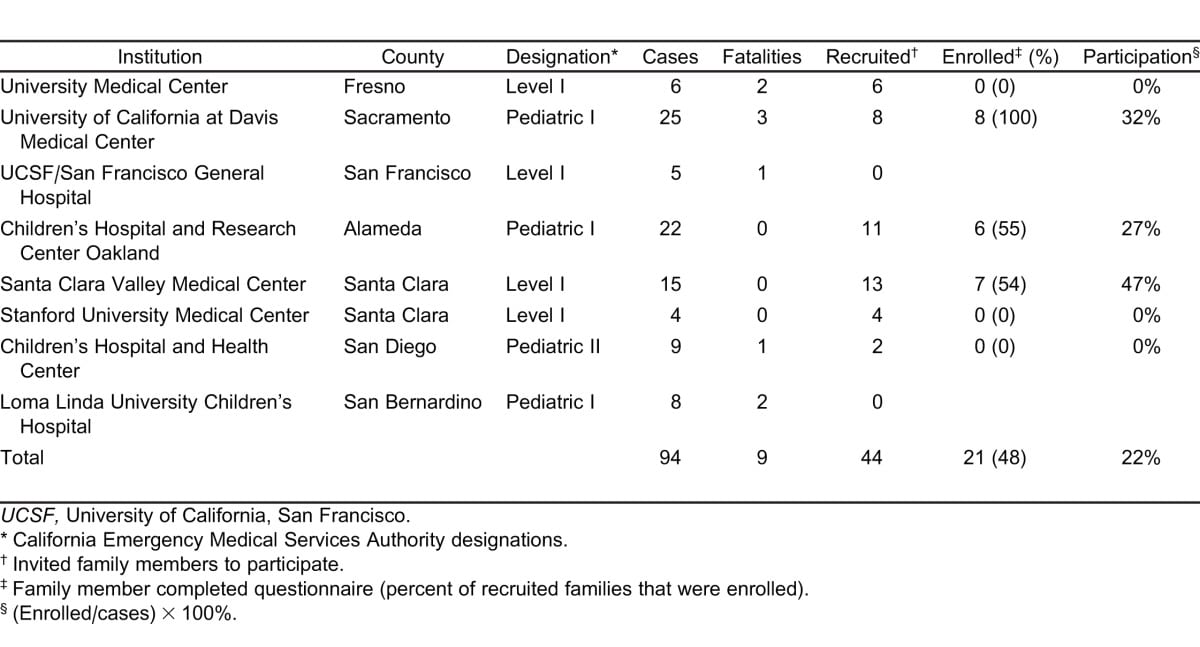
The California Department of Public Health and 8 trauma centers in California conducted surveillance of nontraffic pedestrian collision injury among children aged 14 years or younger from January 2005 to July 2007. Children presenting with injury at any time of day were assessed for study eligibility by trauma center nurses and physicians. Three of the trauma centers were Pediatric Level I centers, 1 was a Pediatric Level II center, and 4 were Adult Level I centers (Table 1). KidsAndCars.org conducted statewide surveillance of media-reported California incidents for that same time period. Cases were defined as children aged 14 years or younger injured in a collision with a motor vehicle in a nontraffic environment. Nontraffic environments include private and public parking facilities, private driveways, private roadways, and public or private open land. KidsAndCars.org monitored newspaper and other media reporting using Google Reader and by referrals from injury prevention professionals and advocates. Matching of cases in the two data systems was performed.
Because the International Classification of Diseases has no specific external cause of injury code (E-code) for these nontraffic injuries, case identification was done by trauma center staff rather than by analysis of electronic patient records. Staff were instructed on the nature of the problem, the definition and protocol for case identification, and how to contact a trained interviewer at each center when eligible cases presented. Interviewers approached families to invite their participation in the study.
Five centers collected hospital chart reviews only. Three centers completed in-person interviews with case families, in which they collected information on the location of the incident, driver characteristics and perceptions of the incident, child behavior, type of vehicle, time of incident, and injury outcomes. Families were also asked to consent to a medical chart review, from which additional details were collected, such as injury diagnoses and E-code. Every family that consented to a chart review also consented to an interview. Interviews were conducted by trauma nurses of injury prevention specialists.
This research was approved by local institutional review committees at all sites.
RESULTS
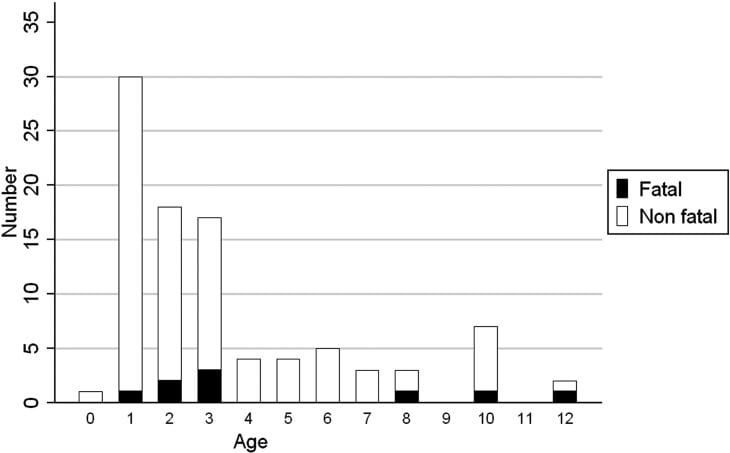
A total of 94 cases were identified (Table 1). Nine cases (10%) were fatal. Seventy of the victims (74%) were aged 4 years or younger; 31 (33%) were aged 1 year or less (Figure). Interview and expanded chart review participation rates ranged from 0% to 27% among the 6 trauma centers that attempted to enroll case families.
Of the 21 victims whose families were interviewed, 17 (81%) were male. Median age was 28 months (Table 2). Thirteen cases (62%) were struck as the vehicle moved in reverse, and 4 (19%) occurred as the vehicle moved forward. In 3 incidents (14%), the car began rolling while parked or was unintentionally set in motion by the victim or another child. The median hospital stay was 2 days, and the mean hospital stay was 2.9 days. There was no fatality among the interviewed cases.
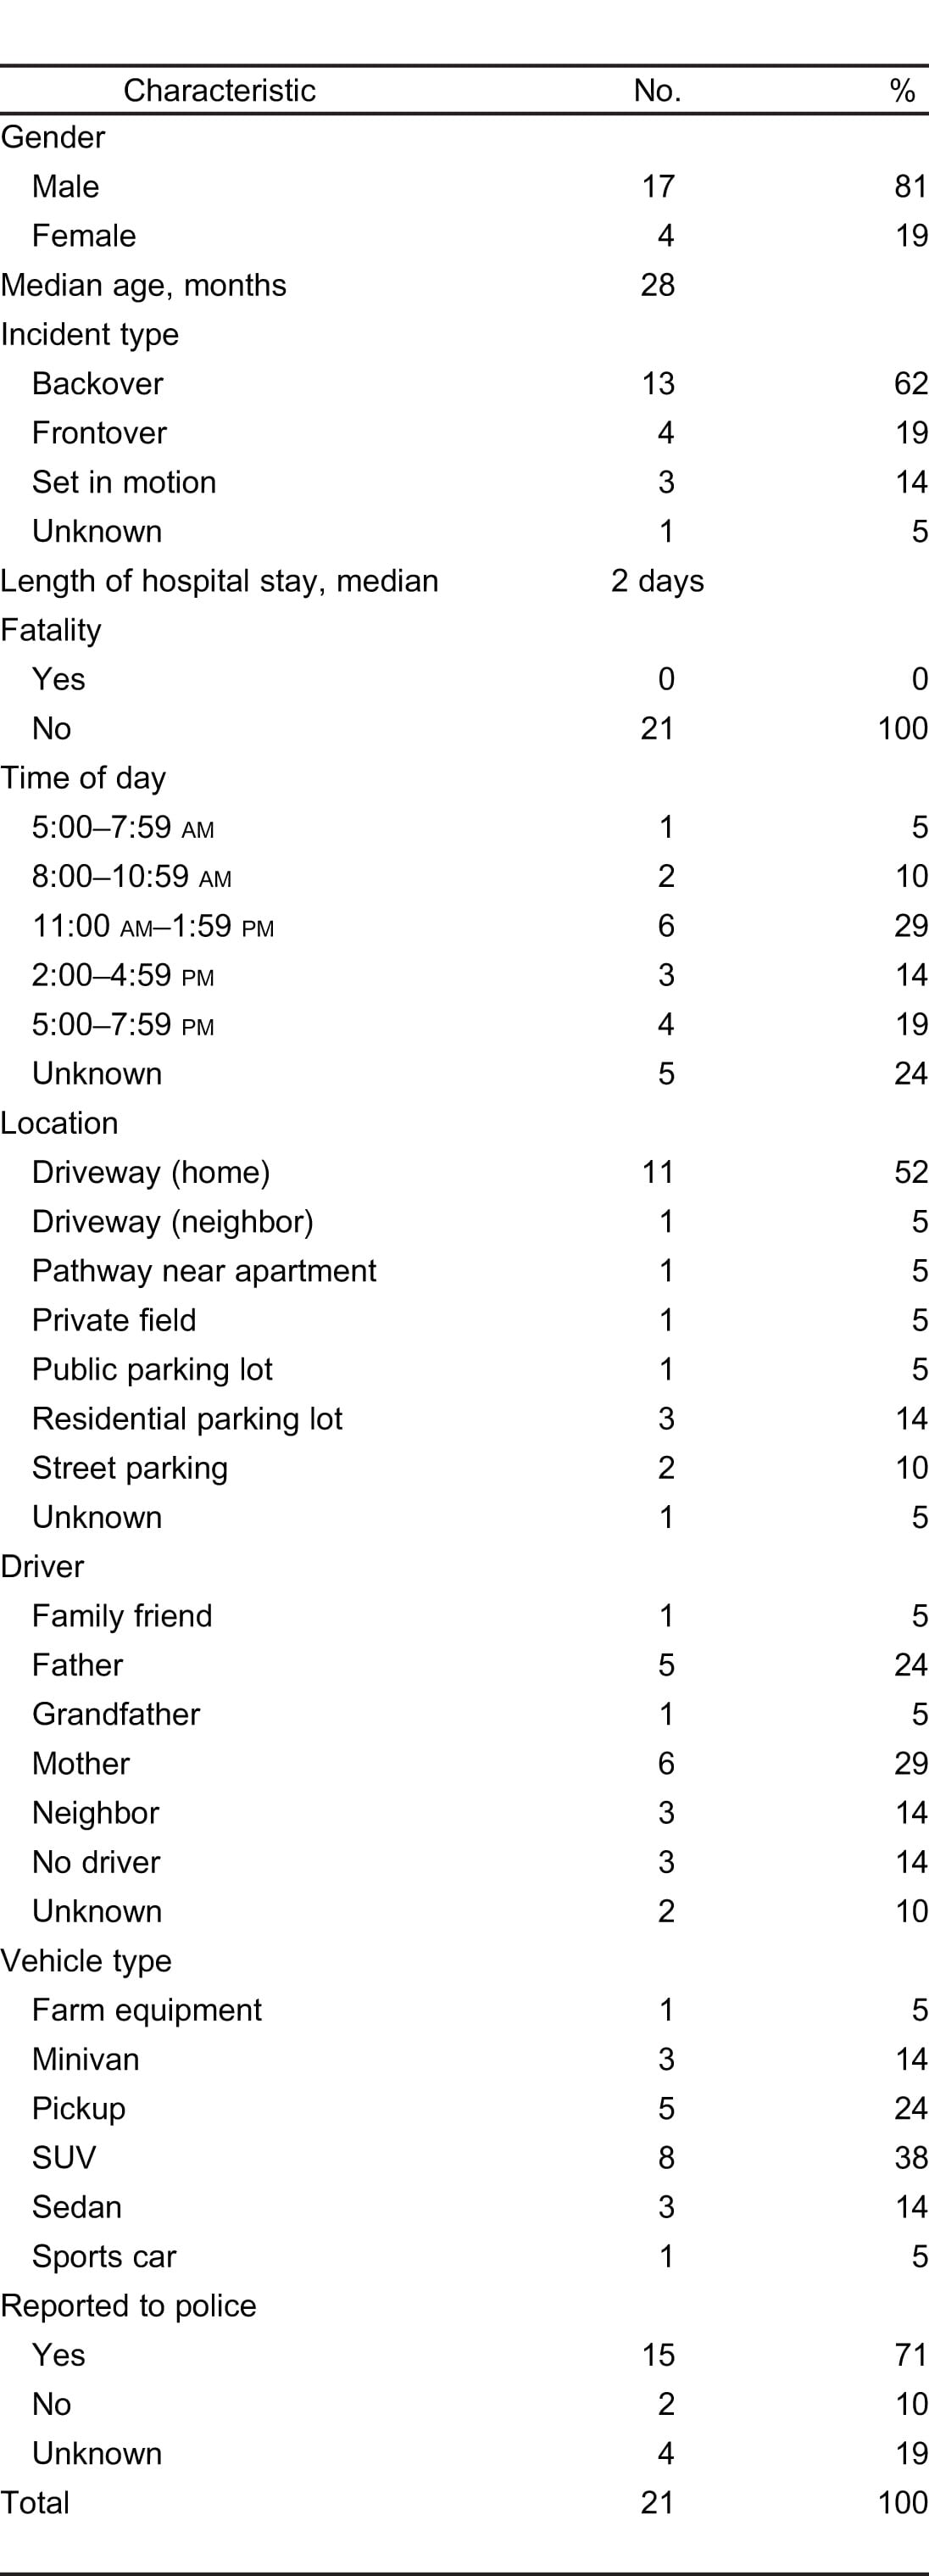
Most of the incidents were clustered around 11:00 am, 1:00 pm, and 5:00 pm. Twelve incidents (57%) occurred in a residential driveway, and 4 (19%) occurred in a residential parking lot. In 11 cases (52%), the driver was a parent of the victim. Three drivers (14%) were neighbors, 1 was a grandfather, and 1 was a family friend. Sixteen incidents (76%) involved an SUV, pickup truck, or minivan. Fifteen incidents (71%) were reported to the police.
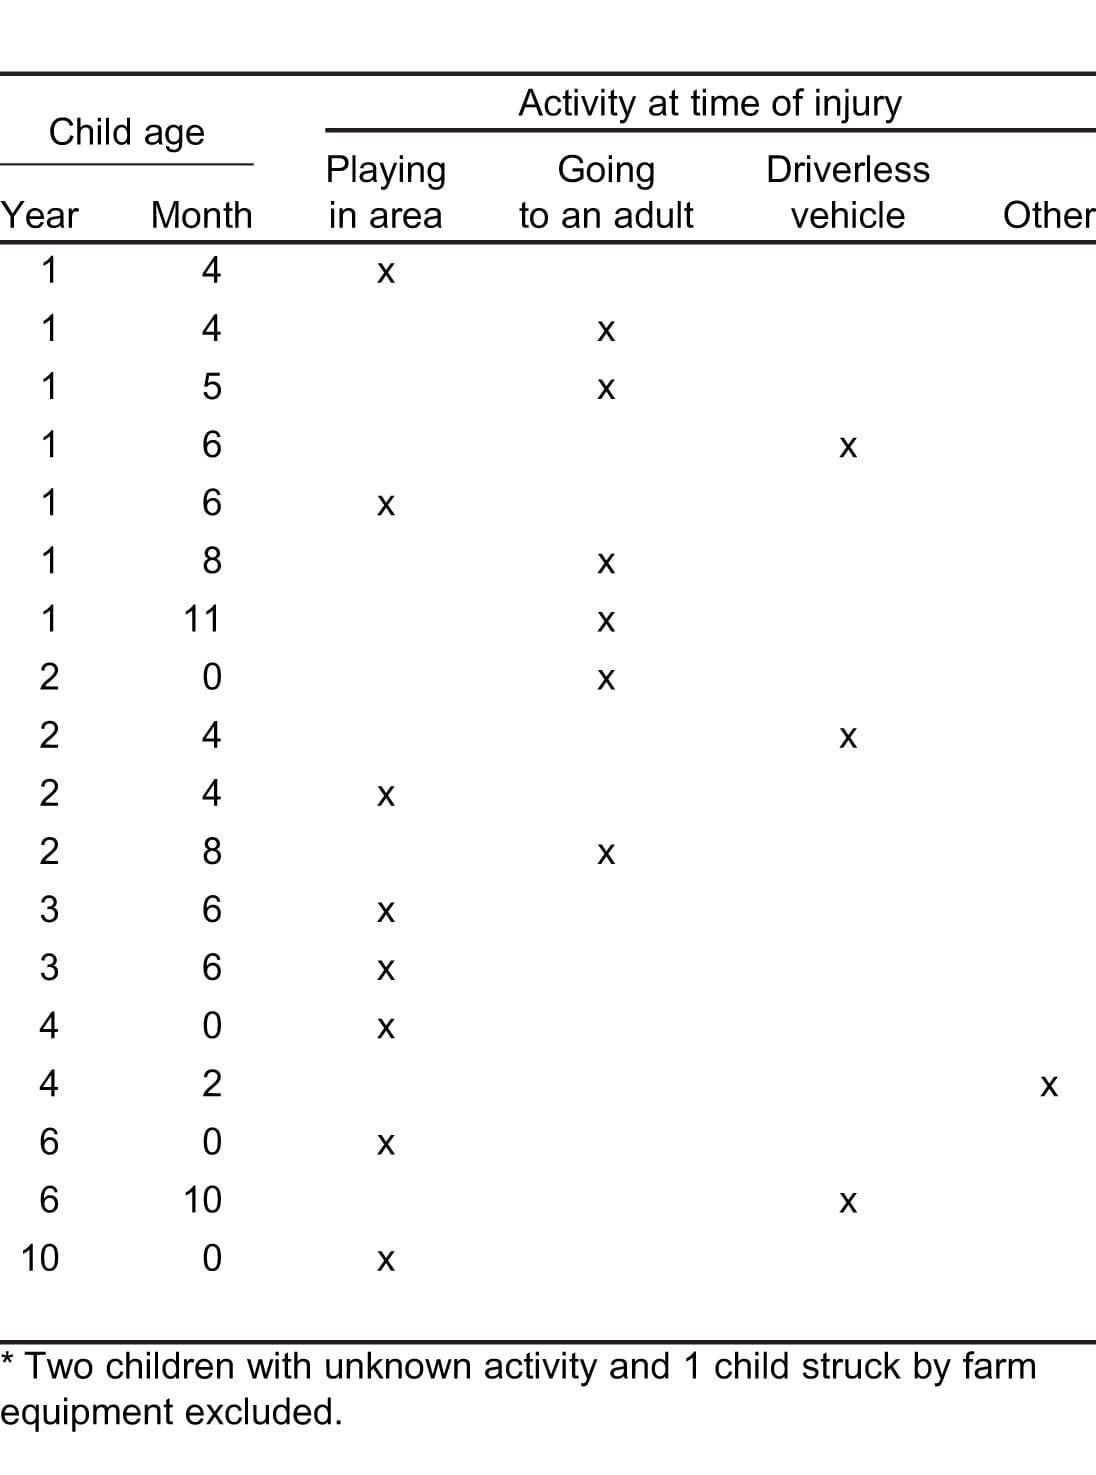
The victims were involved in 3 primary activities at the time they were struck (Table 3). In 8 cases (44%), the child was playing in the vicinity of the vehicle. Six children (33%) were walking or running to greet or say goodbye to the driver. In 3 cases (17%) the child was struck by a driverless vehicle. These vehicles were set in motion by the victim or another child or started rolling after being improperly parked. The child’s activity for 2 incidents (10%) could not be determined, and 1 child (5%) was injured by farm equipment.
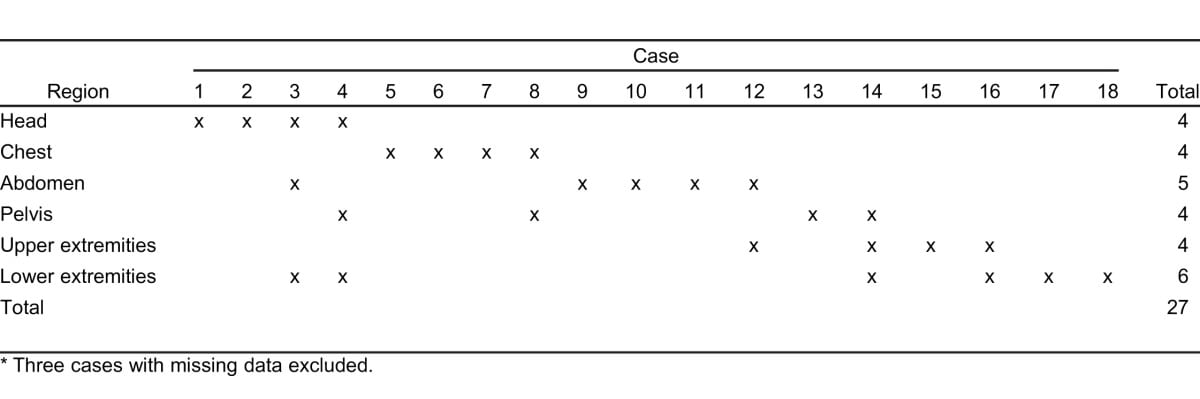
Twenty-seven body regions were injured among 18 children with injury-specific data (Table 4). Fourteen children (78%) suffered injury to a major region (head, chest, abdomen, or pelvis); 4 (15%) suffered injury to extremities only. Six children (23%) had injuries to more than 1 body region, with an average of 1.4 injured regions per child. Overall, lower extremity injuries were the most common, with 6 of 26 diagnoses (23%).
Four cases (19%) were correctly coded using either ICD E-code E822.7 (other motor vehicle nontraffic accident involving collision with moving object) or E825.7 (other motor vehicle nontraffic accident of other and unspecified nature). The other 17 cases (81%) had a traffic-related injury code, no code, or an incorrect code.
KidsAndCars.org statewide data for the same period included 41 deaths and 17 nonfatal injuries.
DISCUSSION
This study demonstrated the feasibility of trauma center surveillance of nontraffic pedestrian collision injury to young children.
The trauma centers identified 9 fatal and 85 nonfatal incidents. KidsAndCars.org identified 41 fatal and 17 nonfatal incidents during the same period. Only 4 of the fatal incidents and 1 of the nonfatal incidents identified by KidsAndCars.org were also identified by our trauma center surveillance system, whose catchment areas covered the areas surrounding Sacramento, Fresno, San Francisco, Oakland, San Jose, and San Diego. The lack of data overlap indicates that KidsAndCars.org was more likely to identify severe and fatal injury incidents than less severe injury incidents, while the trauma center surveillance system was more likely to identify nonfatal incidents. The 2 surveillance systems together identified 101 nonfatal incidents and 46 fatal incidents during the 2-year period.
This study also brought to light inconsistency in the use of external cause-of-injury codes18 by emergency departments. Coding is done by medical records staff who assign a code based on the narrative recorded by a physician in the medical chart. Nine of the 21 interviewed cases were coded E814.7 (motor vehicle traffic accident involving collision with pedestrian), and only 4 were correctly coded with either E822.7 (other motor vehicle nontraffic accident involving collision with moving object) or E825.7 (other motor vehicle nontraffic accident of other and unspecified nature). The remaining 10 cases had either no code or other incorrect codes. The inconsistent use of the codes may result from a lack of clarity on the definitions of traffic and nontraffic incidents. It may also be related to the lack of any specific code to capture pedestrian injuries in parking environments. The result, in this study, is that only 4 of 21 interviewed cases would have been identified by surveillance using emergency department records, inpatient hospital discharge records, or injury trauma registries. In addition, if these 4 patients were identified in a data system, they would not be differentiable from children injured by other means and coded with 1 of these 2 codes.
This medical record external cause coding problem has been recognized by the National Highway Traffic Safety Administration19 because the primary data used in studies of motor vehicle-related injury, police collision reports, also perform poorly in the ascertainment of these incidents. Police collision report data systems generally include only events on public roadways and thus often miss driveway and parking lot incidents. When these incidents are captured in a police collision report, they are often recorded as vehicle-versus-pedestrian events3 without reference to the nontraffic environment in which they occur. This omission makes it impossible to differentiate them from more typical vehicle-versus-pedestrian traffic collisions.
The children our surveillance identified had characteristics similar to those found in other studies that examined nontraffic incidents.20,13 Most were aged 1 to 3 years, and boys strongly predominated. This contrasts with the approximately equal incidence for vehicle occupant injury among young boys and girls and suggests that pediatric nontraffic pedestrian collisions are not a variety of traffic collision but a distinct injury problem.
Our examination of the circumstances of the collisions revealed a basic typology of activities. The most common activity was playing, primarily in children aged 2.5 years or older. The most common activity observed among children younger than this age was going to an adult, usually to say hello or goodbye. Although a majority of the interviewed family members reported that the child was with an adult at the time of the incident, a majority also reported that the child was out of sight of the adult at the time of the incident. This finding underscores the role that supervision plays in the occurrence of backover collisions.
In our data, pickups and SUVs predominated among the involved motor vehicles. The large blind zone behind light trucks, which are generally higher and longer than passenger cars, has been cited as a risk factor for nontraffic collision injury to young children.17,21,22 Consumers Union measured the blind zone of popular passenger vehicles for male and female drivers of average height (5 feet 8 inches [173 cm] for males, 5 feet 4 inches [163 cm] for females).23 The blind zone ranged from 12 feet (3.7 m) for a typical passenger car to 51 feet (28.5 m) for a large SUV or pickup truck. Drivers who are shorter than average height would experience even larger blind zones.
A primary strength of this study was the participation of several large pediatric trauma centers with catchment areas covering the populations of several large urban areas. More cases were identified than would have been possible using police reports alone. In addition, our surveillance approach was able to identify incidents with less severe injury, which appear to be underreported by media-based surveillance.
The salient characteristics of the incidents identified in this study included driveway occurrence, large passenger vehicles, vehicles operated in reverse, family members as drivers, and the absence of immediate child supervision. Pediatric health professionals who work with parents should focus on these factors as targets of educational efforts. Parents should be educated on how child mobility, developmental stage, vehicle blind zones, and environmental features contribute to risk, as well as the importance of close, constant supervision of children around driveways. An example of an educational countermeasure is Spot the Tot, a national campaign that encourages parents to walk around their vehicles before moving them.24 Other studies have also noted the importance of parental education and behavior modification in preventing these injuries.17,20,21,23,25 Several studies have recommended environmental countermeasures, such as play areas that are physically separated from driveways.11,13,15,26,27 Separated driveway areas would likely have prevented some of the incidents reported here, since most of the victims appeared to have access to parking areas, particularly in the morning and afternoon hours when outside play is most likely.
Additional research is needed to clarify the individual and joint contributions of the risk factors identified in this and other studies. Case-control studies should be used to identify modifiable risk factors that can be targeted by prevention programs.
LIMITATIONS
A primary limitation of the study was the low participation rate among case families. Of the 44 families that were invited to participate, 21 agreed (48%), giving an overall participation rate of 22% (21 of 94 total cases). Another limitation is the lack of a defined at-risk population. Most of our trauma centers had no geographically defined or otherwise identifiable catchment area. In addition, the interview questions had unknown validity and reliability.
The implementation of this surveillance effort proved to be challenging. Initially, trauma center staff struggled with obtaining human subject approval and standardizing case definitions and study protocols. Several centers were limited by the lack of interviewers (or translators) who could interview families who spoke languages other than English. Some trauma center staff were uncomfortable making a request for an interview during a time of crisis. Families often experienced strong feelings of guilt and grief and were at risk for posttraumatic stress. Lastly, there were instances of family discord over who was at fault.
Studies in Australia and New Zealand have used child death registry data to examine the involvement of larger vehicles,5,26 victim outcomes,28 and victim and place characteristics13,15 of nontraffic incidents. In the United States, surveillance efforts have relied primarily on hospital data29,30 and media reports17 because of the lack of existing data systems with relevant information. Both approaches have limitations. To our knowledge, child death review teams, nearly universal in large US cities, have not been fully exploited to study nontraffic pedestrian collision injury to children.
Surveillance conducted at large trauma centers is likely to miss children with less severe injuries who may present at community hospitals with lower level trauma centers. Regional surveillance could be conducted at smaller, nontrauma center hospitals, but statewide surveillance would not be possible due the large number of these hospitals in California and many other states. In addition, trauma center catchment areas are often unknown, particularly in urban areas, which may have several trauma centers and whose centers may receive patients transferred from other cities or rural areas.
During the study period, KidsAndCars.org media reports identified 41 fatal and 17 nonfatal collisions. KidsAndCars.org was much more likely than our surveillance system to identify incidents resulting in fatal injury, presumably because fatalities are more newsworthy to the media. For every fatal collision, they identified 0.4 nonfatal collisions, whereas the trauma centers identified 10 nonfatal collisions for every fatality. This indicates that media-based surveillance will severely underestimate the number of incidents of minor or moderate severity injury. If we accept as accurate the 10:1 ratio of moderate/severe injury to fatal injury observed by the trauma centers, we can infer that at least 200 children suffer moderate or severe injury in California each year. The 10:1 ratio may be an underestimate of the true ratio because some fatal incidents may not present at a trauma center, and thus the true number of children with moderate or severe injury may by higher than 200. This possibility is supported by the observation that only 4 fatalities were found in both systems’ data.
Despite the limitations of the 2 surveillance approaches used in this study, the data suggest that nontraffic pedestrian collision injury among young children is an under-recognized public health problem. Assuming the media-based surveillance of KidsAndCars.org ascertains almost all fatal incidents, a minimum of 20 or so children are killed each year in California in these events. However, 5 of the 9 trauma center-identified fatalities were not captured by the KidsAndCars.org system, indicating that the estimate of 20 deaths per year may be significantly understated.
CONCLUSION
In this study, nontraffic pedestrian injuries occurred primarily to boys aged 1 to 3. These events often occurred in driveways, involved large vehicles, and included parents or relatives as the drivers. Surveillance of nontraffic pedestrian injury at trauma centers is a promising approach to identifying incidents that are not captured by other data systems. Family member interviews provided detailed information not found in other data sources. This study also highlighted the inadequacy of ICD E-codes at classifying nontraffic pedestrian collisions. Only 4 of 21 interviewed cases were correctly coded and would be identifiable in hospital data systems. The utility of existing data systems will be improved if the use of ICD E-codes for these collisions is standardized or if a new, unambiguous code is adopted.
Footnotes
Supervising Section Editor: Bharath Chakravarthy MD, MPH
Submission history: Submitted June 18, 2010; Revision received April 15, 2011; Accepted July 29, 2011
Reprints available through open access at http://escholarship.org/uc/uciem_westjem
DOI: 10.5811/westjem.2011.7.6594
Address for Correspondence: Thomas M. Rice, MPH, PhD
University of California–Berkeley, Department of Environmental Health Services, 2614 Dwight Way #7374, Berkeley, CA 94720-7374
Email: tomrice@berkeley.edu.
Conflicts of Interest: By the WestJEM article submission agreement, all authors are required to disclose all affiliations, funding, sources, and financial or management relationships that could be perceived as potential sources of bias. The authors disclosed none.
REFERENCES
1. Centers for Disease Control and Prevention. Injuries and deaths among children left unattended in or around motor vehicles—United States, July 2000–June 2001. MMWR. 2002;51:570–572. [PubMed]
2. Patel R, Dellinger AM, Annest JL. Nonfatal motor vehicle-related backover injuries among children—United States, 2001–2003. MMWR. 2005;54:144–146. [PubMed]
3. Brison RJ, Wicklund K, Mueller BA. Fatal pedestrian injuries to young children: a different pattern of injury. Am J Public Health. 1988;78:793–795. [PMC free article] [PubMed]
4. Agran PF, Castillo DN, Winn DG. Limitations of data compiled from police reports on pediatric pedestrian and bicycle motor vehicle events. Accid Anal Prev. 1990;22:361–370. [PubMed]
5. Holland AJ, Liang RW, Singh SJ, et al. Driveway motor vehicle injuries in children. Med J Aust.2000;173:192–195. [PubMed]
6. Nadler EP, Courcoulas AP, Gardner MJ, et al. Driveway injuries in children: risk factors, morbidity, and mortality. Pediatrics. 2001;108:326–328. [PubMed]
7. Fenton SJ, Scaife ER, Meyers RL, et al. The prevalence of driveway back-over injuries in the era of sports utility vehicles. J Pediatr Surg. 2005;40:1964–1968. [PubMed]
8. Pinkney KA, Smith A, Mann NC, et al. Risk of pediatric back-over injuries in residential driveways by vehicle type. Pediatr Emerg Care. 2006;22:402–407. [PubMed]
9. Roberts I, Norton R, Jackson R. Driveway-related child pedestrian injuries: a case-control study.Pediatrics. 1995;95:405–408. [PubMed]
10. Robinson P, Nolan T. Paediatric slow-speed non-traffic fatalities: Victoria, Australia, 1985–1995.Accid Anal Prev. 1997;29:731–737. [PubMed]
11. Edwards J, Paine M. Sydney, Australia: IPWEA NSW Division Annual Conference; 2003. The Off Road Toll—Children at Risk in Driveways, Yards, and Carparks.
12. Carter WJ. Driveway motor vehicle injuries in children. Med J Aust. 2000;173:503. [PubMed]
13. Williamson A, Irvine P, Sadural S. Analysis of Motor Vehicle-Related Fatalities Involving Children Under the Age of Six Years (1995–2000) Sydney, Australia: University of New South Wales, Injury Risk Management Research Centre;; 2002.
14. Murphy F, White S, Morreau P. Driveway-related motor vehicle injuries in the paediatric population: a preventable tragedy. N Z Med J. 2002;115:U148. [PubMed]
15. Australian Transport Safety Bureau. Canberra: Australian Transport Safety Bureau; 2006. Driveway Deaths of Child Pedestrians.
16. National Highway Traffic Safety Administration. Washington, DC: National Highway Traffic Safety Administration; 2009. Traffic Safety Facts: Not-in-Traffic Surveillance 2007—Children.
17. KidsAndCars.org. Back over incidents—US fatalities by type. Nontraffic fatalities involving children < 15 years old. KidsAndCars.org. 2009 Available at. Accessed July 19.
18. AMA Press. International Classification of Diseases, 9th Revision, Clinical Modification (ICD 9 CM)Chicago, IL: AMA Press; 2007.
19. National Highway Traffic Safety Administration. Washington, DC: National Highway Traffic Safety Administration; 2004. Data Collection Study: Deaths and Injuries Resulting from Certain Non-Traffic and Non-Crash Events.
20. Walton-Haynes L. Pedestrian injuries to young children. EPICgram, Report no. 5. Sacramento, CA: California Department of Health Services;; 2002.
21. Lovette B. Back-up detection devices: what do we all need to know? Dangerous blind zones. J Pediatr Health Care. 2007;21:123–128. [PubMed]
22. Chidester A. Portland, OR: Lifesavers 2008 Conference; 2008. Backover and Non-Crash Events—Special Crash Investigations—Protecting Children in and Around Cars.
23. Consumers Union. Washington, DC: Consumers Union; The Danger of Blind Zones: The Area Behind Your Vehicle Can Be a Killing Zone. 2005, 2009.
24. Safe Kids USA. Safe Kids USA. Washington, DC: 2009. Spot the tot.
25. NAPNAP. NAPNAP position statement on the prevention of unintentional injuries in children. J Pediatric Health Care. 2008;22:A27–A28.
26. Neeman T, Wylie J, Attewell R, et al. Driveway Deaths: Fatalities of Young Children in Australia as a Result of Low-Speed Motor Vehicle Impacts. Canberra: Australian Transport Safety Bureau;; 2002.
27. Hsiao KH, Newbury C, Bartlett N, et al. Pediatric driveway run-over injuries: time to redesign? NZ Med J. 2009;122:17–24.
28. Roberts I, Kolbe A, White J. Non-traffic child pedestrian injuries. J Paediatr Child Health.1993;29:233–234. [PubMed]
29. Agran PF, Winn DG, Castillo DN. Unsupervised children in vehicles: a risk for pediatric trauma.Pediatrics. 1991;87:70–73. [PubMed]
30. Ballesteros MF, Dischinger PC, Langenberg P. Pedestrian injuries and vehicle type in Maryland, 1995–1999. Accid Anal Prev. 2004;36:73–81. [PubMed]