
| Author | Affiliation |
|---|---|
| Niels K. Rathlev, MD | Boston University Medical Center, Department of Emergency Medicine, Boston, Massachusetts |
| Dan Obendorfer, MBA | Boston University Medical Center, Department of Emergency Medicine, Boston, Massachusetts |
| Laura F. White, PhD | Boston University Medical Center, Department of Emergency Medicine, Boston, Massachusetts |
| Casey Rebholz, MPH | Boston University Medical Center, Department of Emergency Medicine, Boston, Massachusetts |
| Brendan Magauran, MD, MBA | Boston University Medical Center, Department of Emergency Medicine, Boston, Massachusetts |
| Willie Baker, MD | Boston University Medical Center, Department of Emergency Medicine, Boston, Massachusetts |
| Andrew Ulrich, MD | Boston University Medical Center, Department of Emergency Medicine, Boston, Massachusetts |
| Linda Fisher, RN | Boston University Medical Center, Department of Emergency Medicine, Boston, Massachusetts |
| Jonathan Olshaker, MD | Boston University Medical Center, Department of Emergency Medicine, Boston, Massachusetts |
ABSTRACT
Introduction:
The mean emergency department (ED) length of stay (LOS) is considered a measure of crowding. This paper measures the association between LOS and factors that potentially contribute to LOS measured over consecutive shifts in the ED: shift 1 (7:00 am to 3:00 pm), shift 2 (3:00 pm to 11:00 pm), and shift 3 (11:00 pm to 7:00 am).
Methods:
Setting: University, inner-city teaching hospital. Patients: 91,643 adult ED patients between October 12, 2005 and April 30, 2007. Design: For each shift, we measured the numbers of (1) ED nurses on duty, (2) discharges, (3) discharges on the previous shift, (4) resuscitation cases, (5) admissions, (6) intensive care unit (ICU) admissions, and (7) LOS on the previous shift. For each 24-hour period, we measured the (1) number of elective surgical admissions and (2) hospital occupancy. We used autoregressive integrated moving average time series analysis to retrospectively measure the association between LOS and the covariates.
Results:
For all 3 shifts, LOS in minutes increased by 1.08 (95% confidence interval 0.68, 1.50) for every additional 1% increase in hospital occupancy. For every additional admission from the ED, LOS in minutes increased by 3.88 (2.81, 4.95) on shift 1, 2.88 (1.54, 3.14) on shift 2, and 4.91 (2.29, 7.53) on shift 3. LOS in minutes increased 14.27 (2.01, 26.52) when 3 or more patients were admitted to the ICU on shift 1. The numbers of nurses, ED discharges on the previous shift, resuscitation cases, and elective surgical admissions were not associated with LOS on any shift.
Conclusion:
Key factors associated with LOS include hospital occupancy and the number of hospital admissions that originate in the ED. This particularly applies to ED patients who are admitted to the ICU.
INTRODUCTION
Emergency department (ED) mean length of stay (LOS) per patient measured from the patient’s arrival to departure has been promoted as a surrogate indicator of crowding in the absence of a standard or universal definition. It is also frequently considered a key process indicator for performance improvement and clinical and operational efficiency.1 From the patient’s perspective, total LOS and long wait times to see a physician or for test results create the sense that the ED is busy and crowded; however, a major limitation of LOS as an indicator of crowding is the retrospective nature of the measure; it cannot readily be used to manage flow real time.
It is important that variables associated with crowding are identified for optimal management of flow in the ED. It is of particular interest to define variables that are amenable to administrative change and redesign in order to reduce variability in performance.2 Asplin et al developed an input-throughput-output conceptual model of ED crowding which forms the basis for our selection of factors for study.3Input factors, such as the number of unscheduled ambulatory care ED visits and emergency medical services transports, cannot be controlled except by diverting ambulances away from the ED. These factors were therefore not included as covariates in the current analysis. Throughput relates to factors that are influenced by flow processes in the emergency, laboratory, and radiology departments from the time of triage to the time of disposition. Nursing staffing was included as a throughput factor in this study, as it can be controlled by administrative design. Mandatory ED nursing staffing ratios of 1 nurse for every 4 patients has led to a reduction in wait time to ED bed and ED bed to departure in the State of California.5 While staffing patterns would appear to be an important throughput factor, previous studies have not found attending physician staffing to be a statistically significant factor influencing LOS.4Consequently, attending physician staffing was not included in the present analysis. Output factors relate to the disposition of patients to home, chronic care facilities, or inpatient beds. Intense competition for the latter may occur especially on weekdays, when patients are frequently admitted to an inpatient bed either before or after elective surgical procedures; this is an example of artificial variability that is amenable to change on an institutional level. Similarly, the expediency of the departure process from the ED is an important output factor and the number of discharged patients per shift (ED discharges) leaving for home, an inpatient bed, or for another facility was therefore incorporated as a covariate in the study.
Studies have documented statistically significant associations between LOS measured over 24-hour periods and hospital occupancy, the number of ED admissions, and the number of elective surgical cases that were admitted directly to an inpatient bed while bypassing the ED.4 As recommended by other investigators, our goal was to measure the associations between throughput and output factors and LOS in more discreet time periods than previously reported.6,7 Since ED crowding and volume vary greatly during a given 24-hour period, we measured the independent variables during 3 separate 8-hour shifts per 24-hour period, when possible. Our purpose was to discern which covariates of interest were associated with LOS and, when relevant, whether this relationship was present during all shifts or only specific 8-hour shifts.
METHODS
Study Design
The purpose of the study was to measure the associations between the LOS measured during 8-hour time periods and covariates that we believed were related to ED crowding. LOS was measured in minutes as a continuous variable from the time of registration to the time of departure from the ED for all patients whether they were discharged, transferred to another facility, or admitted to an inpatient ward.
Setting and Participants
The study was conducted in a level 1 trauma center in an inner-city university teaching hospital. Data was collected retrospectively from ED and hospital electronic logs for all 91,643 adult ED visits over an 18-month period from October 12, 2005 to April 30, 2007. Patients aged 21 and under were not included in this analysis, as they were seen in a separate pediatric ED. The only exception to this rule was multiple trauma patients aged 15 and over.
Methods of Measurement
LOS and the covariates were measured with an electronic information technology system (IBEX, now Piscis ED Pulsecheck), which allowed reporting of these data during 8-hour shifts.8 We chose the following 8-hour time periods since they coincided with the clinical shifts for nurses: shift 1 (7:00 am to 3:00 pm), shift 2 (3:00 pm to 11:00 pm), and shift 3 (11:00 pm to 7:00 am). We measured the LOS per shift as well as the LOS on the previous shift. For each 8-hour shift, we measured the numbers of (1) ED nurses on duty; (2) ED discharges defined as patients leaving the ED whether admitted, transferred to another facility, or discharged; (3) ED discharges (as explained earlier) on the previous shift; (4) resuscitation cases; (5) admissions, ie patients seen in the ED who are subsequently admitted to an inpatient unit; and (6) intensive care unit (ICU) admissions, ie patients seen in the ED who are subsequently admitted to the ICU. The number of nurses on duty was included as a measure of staffing.9 ED resuscitation cases were cared for in resuscitation bays by a designated team of physicians, nurses, and aides drawn from the ED’s staffing pool. Our information technology system assigned patient visits to a specific shift based on the time of departure from the ED rather than the time of initial presentation.
The following independent variables were measured for each 24-hour period and therefore did not vary in their relationship with LOS by shift: (1) number of elective surgical cases that were admitted directly as inpatients while bypassing the ED (elective surgical admissions) and (2) hospital medical-surgical occupancy (hospital occupancy). The latter was defined as the number of patients in an adult medical or surgical hospital bed at midnight plus the number of patients discharged in the preceding 24 hours divided by the total number of staffed inpatient beds. Forster et al previously described this definition of hospital occupancy.10 We chose this definition in our analysis because the measure more accurately reflects total inpatient bed utilization over a 24-hour period than hospital occupancy measured at a given point in time.
Data Analysis
We retrospectively analyzed the associations between the LOS per 8-hour shift and the covariates of interest. LOS on the previous shift, hospital occupancy, and the numbers of ED discharges on the current shift as well as the previous shift, nurses on duty, admissions, resuscitation cases, and elective surgical admissions were analyzed as continuous variables. The number of ICU admissions was analyzed as a categorical variable based on the admission of 1, 2, or 3 critical care patients from the ED per shift. Descriptive statistics included frequency distributions, means, medians, and 95% confidence intervals. Only those variables with a confidence interval that did not contain 0 were considered statistically significant.
Observations between consecutive 8-hour shifts are not independent of each other due to the correlation of LOS between one shift and the next. The data was therefore analyzed using an autoregressive integrated moving average (ARIMA) time series model to account for the presumed serial correlation between successive 8-hour periods.11 The autoregressive term refers to the period of autocorrelation. For example, in our dataset, the unit of measure was 1 shift defined as a single 8-hour period. An autoregressive process or lag of 1 would indicate that the model takes into account the ED mean LOS of the previous shift. The adequacy of the model was analyzed using the autocorrelation function and periodogram. We used the Akaike information criteria (AIC) to select the appropriate ARIMA model. Stationarity of the ARIMA model was examined by using the Dickey-Fuller and Phillips-Perron unit root tests. Portmanteau statistics were used to determine if any autocorrelation remained in the residuals of the model. Interaction terms between the shift and other covariates were examined for statistical significance to determine if key variables varied in their relationship with LOS at different times of the day.
All variables of interest were included in the models to illustrate their impact on LOS, whether or not it was significant. We additionally investigated the impact of removing variables that were not significant and found that the results did not change dramatically. Therefore, we report results of the full models. Data were analyzed using STATA/SE 8.2 for Windows (Stata Corporation, College Station, Texas). The study was approved as exempt research by local institutional review.
RESULTS
A total of 1,689 8-hour shifts were analyzed during the study period. The mean number of patient visits per 8-hour shift was 54.2, and the mean LOS was 232 minutes for all patients, whether they were admitted, discharged, or transferred. Hospital occupancy was high during the study period with a mean of 94.9% and a range of 67.6% and 112.1%. The measure may exceed 100% since the numerator is the sum of patients physically in beds at midnight plus the number of patients discharged in the previous 24 hours. We could not demonstrate a nonlinear effect of occupancy on LOS after analyzing residuals and considering a quadratic term for occupancy in the models. The residual plots looked good and showed no signs of heteroscedasticity. The quadratic term was not significant, and the fit of the model by AIC was not improved significantly when it was added. The mean number of elective surgical admissions was 24 per 24-hour period. As expected, shift 2 was the busiest in terms of numbers of discharged patients, admissions, ICU admissions, and resuscitation cases. Outcome and explanatory variables are summarized in total and by 8-hour shift in Table 1.

The results of the ARIMA time series analysis are presented in Table 2. An ARIMA (2, 2) model provided the best fit to control for autocorrelation in the data. Most notably, the interaction between shift and hospital occupancy was not statistically significant, indicating that hospital occupancy did not vary by shift in its statistically significant association with LOS.
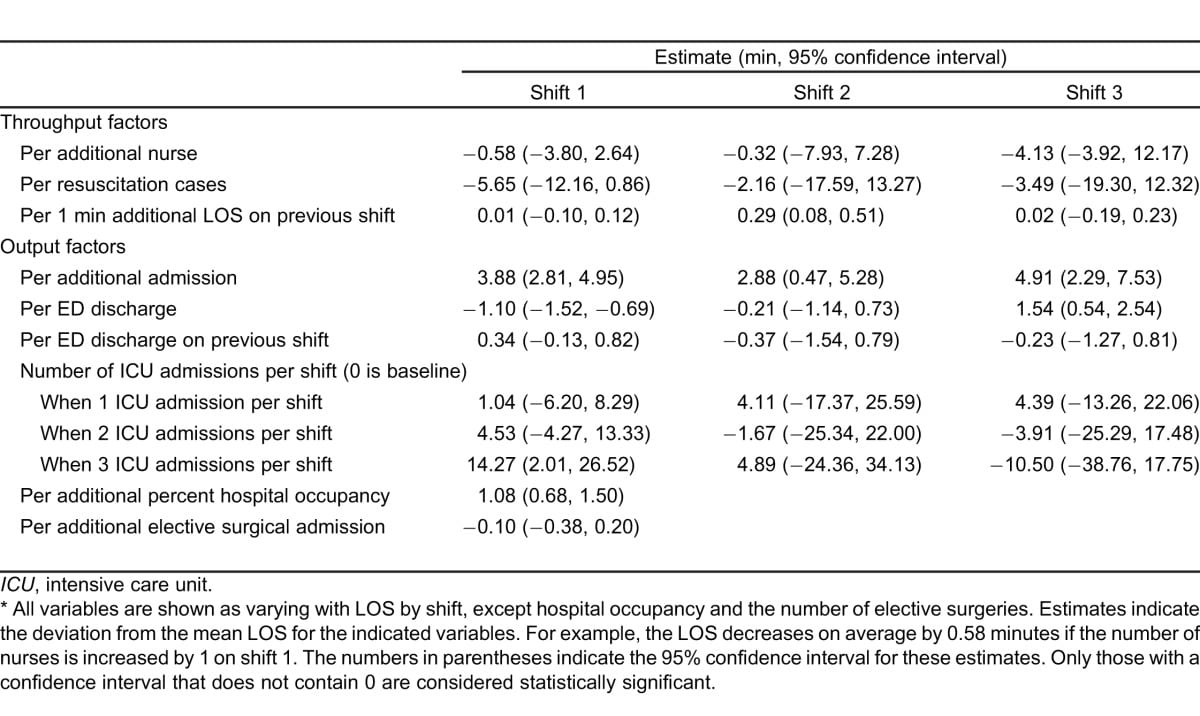
For every additional 1% increase in hospital occupancy, LOS in minutes increased by 1.08 (0.68, 1.50, P< 0.001). The number of ED admissions was statistically significantly associated with LOS on all 3 shifts. For every additional admission from the ED, LOS in minutes increased by 3.88 (2.81, 4.95) on shift 1, 2.88 (0.47, 5.28) on shift 2, and 4.91(2.29, 7.53) on shift 3. Three or more ICU cases (compared to 0) admitted from the ED per shift prolonged LOS by 14.27 minutes (2.01, 26.52) on shift 1, but a significant association was not found on shifts 2 or 3. Fewer than 3 ICU admissions failed to demonstrate an association with LOS on any of the 3 shifts. Every additional 1 minute increase in LOS on shift 1 was associated with a 0.29-minute (0.08, 0.51) increase in LOS on shift 2. For every additional ED discharge, LOS decreased by 1.10 minutes (1.52, 0.69) on shift 1, but increased by 1.54 minutes (0.54, 2.54) on shift 3. The numbers of nurses, ED resuscitation cases, discharges on the previous shift, and elective surgical admissions were not associated with LOS in multivariate analysis.
DISCUSSION
A number of prior studies have attempted to measure the associations between input, throughput, and output variables and ED LOS measured during 24-hour periods.4,12 Asplin et al has suggested that measuring LOS during shorter time periods may offer more relevant data since the level of crowding can change significantly from hour to hour;7 to that end, we measured variables during 8-hour shifts and performed a multivariate analysis to determine significant predictors of ED flow and LOS.
We chose to use a definition of hospital occupancy that reflects total inpatient bed utilization and demand over a 24-hour period. The results of prior studies that have used a similar measure suggest that it is a predictor of ED flow and LOS.4,10 Our study also supports this conclusion as it was a significant predictor of LOS in the analysis. The mean hospital occupancy in our institution during the study period was 94.9%. At this high level of demand for inpatient beds, our results suggest that even a mere 1% increase in occupancy can result in delays in the ED. Conversely, investigators that have measured inpatient census at a single point in time as a surrogate for hospital occupancy have not been able to demonstrate a similar relationship.12 Real-time changes in demand for inpatient beds cannot be assessed with a single daily measurement, which therefore lacks in utility from a real-time management perspective. The demand for inpatient beds often exceeds 100% of capacity during the late morning and early afternoon hours on weekdays. In order to alleviate this bed crunch, administrative efforts should be focused on early discharge of inpatients destined for home or transfer to another institution.
The adverse impact of an increased number of ED admissions, ie patients seen in the ED who are subsequently admitted, on LOS has been consistent in the literature. We demonstrated that LOS per patient on all 3 shifts increased by approximately 3 to 5 minutes for every additional ED admission. Of particular note is the fact that the number of ICU admissions, ie patients who are ultimately admitted to the ICU from the ED, were an important subset of all ED admissions, as they were independently associated with an increase in mean LOS for all ED patients. Intensive care unit boarders, ie admitted patients remaining in the ED for a period of time prior to transport to the ICU, were counted as admissions while still in the ED. The admission of 3 or more ICU patients in an 8-hour period prolonged LOS by more than 14 minutes for all ED patients on shift 1. The result inherently makes sense as these patients are labor intensive and typically require 1:1 or 2:1 patient-to-nurse ratios, even when boarding in the ED. Conversely, fewer than 3 ICU admissions during any shift were not associated with LOS. Administrative data from the ED at our university medical center confirm that ICU admissions boarding in the ED consume significant resources and impact flow. More than 80% of all ambulance diversions occurred when 1 or more ICU patients were boarding in the ED (institutional database, May 2007). The decision to admit a patient to the ICU may be amenable to administrative redesign as disease-specific protocols can appropriately allow a subset of these patients to be cared for in a step-down or telemetry unit.
The number of elective surgical admissions was calculated over a 24-hour period and therefore did not vary by shift in the relationship with LOS. Elective surgical admissions were included in the overall hospital occupancy measure when they occupied an inpatient bed either before or after the procedure. We could not demonstrate an independent association between these elective admissions and LOS presumably because they were subsumed by the greater role of hospital occupancy. It is conceivable that an independently significant increase in LOS can be demonstrated if the sum total of all elective scheduled admissions, including surgical procedures, cardiac catheterizations, endoscopies, etc, is taken into account.
Nursing staffing ratios on inpatient units and in the ED have received much attention in recent years.13,14 Mandatory ED and inpatient staffing ratios of 1 nurse for every 4 patients has been implemented in California hospitals; in this state, the throughput measures of wait time to ED bed and ED bed to departure were shorter when the ED nurse staffing was within state-mandated levels, after controlling for ED census and patient acuity.5 Simple measures of nursing staffing, such as nurse-to-patient ratios, perform as well as complicated formulas that correct for patient severity.9 We therefore chose to simply measure the number of nurses on duty on any given shift but, surprisingly, did not find that increasing nursing staffing reduced LOS. Previous studies have also failed to show that attending physician staffing affects LOS to a significant degree.4 While nursing staffing may impact crowding and LOS, the magnitude of the association pales in comparison with the effect of other factors that are not easily controlled by the ED. Our analysis suggests that nursing staffing is overshadowed in importance by hospital occupancy, the number of ED admissions in general, and ICU admissions in particular.
It makes intuitive sense that mean LOS decreased as the number of ED discharges increased on shift 1. Emphasizing the timely departure of appropriate patients will serve to increase ED capacity and decrease the time from arrival to ED bed for new patients. Patient flow on the night shift is inherently different than shifts 1 and 2. For humanitarian reasons, patients who come in during the evening shift with alcohol or substance abuse or are homeless are often allowed to stay in the ED for the night in our institution. Additionally, other categories of patients may be held until the morning when family members are available to retrieve them or public transportation resumes service. Many of those patients are discharged in the early morning hours immediately before the start of the next shift and therefore have a prolonged LOS. This may explain the paradoxical positive association between the number of ED discharges and increased LOS on shift 3. Early discharge of inpatients destined for home or transfer to another facility will increase the supply of inpatient beds and reduce the variability in hospital occupancy that occurs during a 24-hour period. This in turn will reduce LOS and relieve crowding during hours of peak demand in the ED.15
The number of resuscitation cases does not appear to have been large enough (mean 0.53 per shift) or exhibit sufficient variability to affect LOS. Future questions must assess how reducing variability and LOS affect patient outcomes and medical error. The impact of ED crowding and delays in flow on patient safety and quality of care must be evaluated by both quantitative and qualitative methods. The financial implications of ED crowding must also be measured, including costs and lost potential revenue.
LIMITATIONS
Our study had some limitations. Due to the retrospective nature of the model, it cannot be used to demonstrate causality, but merely to measure associations. LOS is an imperfect retrospective measure that cannot easily be used as a real-time indicator of ED crowding. Although LOS may not be normally distributed, we were not able to measure median LOS because of the constraints of our electronic information technology system. Based on recent studies, we do not believe that substituting median for mean LOS would have substantively altered our results.12,16 This is also a single-center study performed at a large inner-city level 1 trauma center ED; the results may not apply to institutions with a different size and patient demographic pattern.
The covariates analyzed were limited. It is conceivable that the results may have been different if patient visits were assigned to a given shift based on the time of arrival rather than the time of ED discharge. The number of new arrivals per shift may be a better indicator of the demand for services. Future studies should account for additional measures, such as triage severity, the number of patients in each triage category, ED capacity, ie number of bays, and the practice patterns of individual providers. Based on previous literature, we do not believe that inclusion of hours of coverage by attending physicians as covariates will provide additional information in the model. Although there is no data to support the assertion, we believe that the same applies to resident physicians and midlevel providers. The efficiency with which ancillary services, such as radiology and laboratory services, perform testing and report results is an important variable that affects flow.
CONCLUSION
Our study focused on the association between LOS and throughput and output factors related to the conceptual model of ED crowding. Not surprisingly, hospital medical-surgical occupancy is associated with LOS on all 3 shifts but is difficult to change with administrative redesign within the purview of the ED. Change in this variable requires broad hospital-wide redesign efforts in terms of capacity and practice protocols. On all 3 shifts, the number of admissions is associated with an increase in LOS. In addition, LOS on shift 1 increased by more than 14 minutes per patient whenever 3 or more ICU patients were boarding in the ED. Conversely, the numbers of resuscitation cases, elective surgical admissions, and nurses were not independently associated with LOS in this analysis. This is presumably because these measures are overshadowed by the greater effects of hospital occupancy, the number of ED admissions as a whole, and ICU admissions in particular.
Footnotes
Supervising Section Editor: Eric R. Snoey, MD
Submission history: Submitted March 13, 2011; Revision received June 12, 2011; Accepted July 29, 2011
Reprints available through open access at http://escholarship.org/uc/uciem_westjem
DOI: 10.5811/westjem.2011.7.6743
Address for Correspondence: Niels K. Rathlev, MD
Baystate Medical Center, Department of Emergency Medicine, 759 Chestnut St, Springfield, MA 01199
E-mail: niels.rathlev@tufts.edu
Conflicts of Interest: By the WestJEM article submission agreement, all authors are required to disclose all affiliations, funding, sources, and financial or management relationships that could be perceived as potential sources of bias. The authors disclosed none.
REFERENCES
1. Chan L, Reilly KM, Salluzzo RF. Variables that affect patient throughput times in an academic emergency department. Am J Med Qual. 1997;12:183–186. [PubMed]
2. Litvak E, Long MC. Cost and quality under managed care: irreconcilable differences? Am J Managed Care. 2000;3:305–312.
3. Asplin BR, Magid DJ, Rhodes KV, et al. A conceptual model of emergency department crowding. Ann Emerg Med. 2003;42:173–180. [PubMed]
4. Rathlev NK, Chessare J, Olshaker J, et al. Time series analysis of variables associated with daily mean emergency department length of stay. Ann Emerg Med. 2007;49:265–271. [PubMed]
5. Chan TC, Killeen JP, Vilke GM, et al. Effect of mandated nurse-patient ratios on patient wait time and care time in the emergency department. Acad Emerg Med. 2010;17:545–552. [PubMed]
6. Asplin BR. Ignoring the front door: US hospital operations circa 2009. Acad Emerg Med.2009:;16:665–667. [PubMed]
7. Asplin BR, Flottemensch TJ, Gordon BD. Developing models for patient flow and daily surge capacity research. Acad Emerg Med. 2006;13:1109–1113. [PubMed]
8. Rothenhaus TC, Stein B. An open source, intranet-based tracking system for the emergency department [abstract] Ann Emerg Med. 2000;36:S56.
9. Hobgood C, Vilani J, Quattlebaum R. Impact of emergency department volume on registered nurse time at the bedside. Ann Emerg Med. 2005;46:481–489. [PubMed]
10. Forster AJ, Stiell IG, Wells G, et al. The effect of hospital occupancy on emergency department length of stay and patient disposition. Acad Emerg Med. 2003;10:127–133. [PubMed]
11. Nelson BK. Statistical methodology, V: time series analysis using autoregressive integrated moving average (ARIMA) models. Acad Emerg Med. 1998;5:739–744. [PubMed]
12. Lucas R, Farley H, Twanmoh J, et al. Emergency department flow: the influence of hospital census variables on emergency department length of stay. Acad Emerg Med. 2009;16:597–602. [PubMed]
13. Aiken L, Clarke SP, Cheung RB, et al. Educational levels of hospital nurses and surgical patient mortality. JAMA. 2003;290:1617–1623. [PMC free article] [PubMed]
14. Aiken L, Clarke SP, Sloane DM, et al. Hospital nurse staffing and patient mortality, nurse burnout and job satisfaction. JAMA. 2002;288:1987–1993. [PubMed]
15. Powell ES, Khare RK, Venkatesh AK, et al. The relationship between discharge timing and emergency department boarding. J Emerg Med. 2010 Sep 29; [published online ahead of print September 29, 2010]
16. Qualls M, Pallin DJ, Schuur JD. Parametric versus nonparametric statistical tests: the length of stay example. Acad Emerg Med. 2010;17:1113–1121. [PubMed]