
| Author | Affiliation |
|---|---|
| Paul B. Dohrenwend, MD | Department of Family Medicine, University of California San Diego, La Jolla, California Department of Emergency Medicine, San Diego Medical Center Kaiser Permanente, San Diego, California |
| Minh V. Le, MD | Department of Family Medicine, University of California San Diego, La Jolla, California Department of Emergency Medicine, San Diego Medical Center Kaiser Permanente, San Diego, California |
| Jeff A. Bush, MD | Department of Emergency Medicine, San Diego Medical Center Kaiser Permanente, San Diego, California |
| Cyril F. Thomas, PA | Department of Emergency Medicine, San Diego Medical Center Kaiser Permanente, San Diego, California |
ABSTRACT
Introduction:
In 2007 wildfires ravaged Southern California resulting in the largest evacuation due to a wildfire in American history. We report how these wildfires affected emergency department (ED) visits for respiratory illness.
Methods:
We extracted data from a Kaiser Permanente database for a single metropolitan community ED. We compared the number of visits due to respiratory illness at time intervals of 2 weeks before and during the time when the fires were burning. We counted the total number of patients with chief complaint of dyspnea, cough, and asthma and final international classification of disease 9 coding diagnosis of asthma, bronchitis, chronic obstructive pulmonary disease and respiratory syndrome, and analyzed data for both total number and proportion of ED visits. We evaluated the data using Early Aberration Reporting System software to determine significant single-visit increases compared to expected counts. We also analyzed the average length of ED stay. Data on air quality were extracted from the http://www.airnow.gov site.
Results:
There were significant differences between pre-fire and fire period average visit counts for the chief complaints of dyspnea and asthma. Dypnea complaints increased by 3.2 visits per day. During the fire the diagnoses of asthma increased significantly by 2.6 patients per day. Air quality reached air quality index values of 300, indicating very unhealthy conditions. Average ED length of stay times remained unchanged during the fire period compared to the pre-fire period.
Conclusion:
The 2007 Southern California wildfires caused significant surges in the volume of ED patients seeking treatment for respiratory illness. Disaster plans should prepare for these surges when future wildfires occur.
INTRODUCTION
In October of 2007, southern California experienced a wildfire of unprecedented scale, resulting in the destruction of 1400 homes, 500,000 acres of land, and the evacuation of approximately 1 million people, the largest for a wildfire in American history from October 21, 2007 to November 9, 2007.1 High winds would fan the flames making the fires unmangeable and spread at a rapid rate. As a result, much of San Diego was evacuated to places deemed safe by the California government.1However, despite the evacuations away from the fires, the population had no real escape from the resulting pollution that was carried diffusely around the county. Our study investigated the wildfires impact on emergency department visits for respiratory illness.
METHODS
Setting
Data on emergency department (ED) visits were obtained from the Kaiser Permanente electronic database from a single community ED in a large metropolitan city. Annual ED visits were 99,000 for 2007 in an ED with 54 bed capacity and approximately 30% admission rate. Visit counts were extracted from October 1, 2007 to November 6, 2007. Visit data were compared over the following time intervals: the pre-fire period defined as October 1, 2007 to October 20, 2007 and the fire period defined as October 21, 2007 to November 6, 2007 by the State of California.1 The total number of ED visits were categorized based on international classification of disease (ICD) 9threvision (WHO Geneva) codes for asthma, chronic obstructive pulmonary disease (COPD), bronchitis and from chief complaints of dyspnea, cough, and asthma. A respiratory syndrome category of ICD 9 diagnoses (e.g. COPD, asthma, respiratory failure, congestive heart failure, etc) was defined. ED visit length of stay (LOS) times were obtained from the database for each day of the pre-fire and fire period. They pre-fire period and fire period LOS times were compared as an average for the period.
Data analysis
Data was analyzed based on actual counts and based on proportion of visits. The counts data was compared by chi-square tests over corresponding time intervals two weeks before the fire and the time during which the fires were burning. We ran a logistic regression of data for the time period before and during the fire using Kruskal-Wallis test. Because weekend and weekday visits differ, the pre-fire and fire period weekdays were compared. For the proportions data we used a Poisson Heterogeneity test and Poisson regression on time interval with the offset being the number of patients seen during the time period. To evaluate significant increases in visit counts and LOS times on single days the early aberration reporting system software (EARS) C-2 algorithm supplied publically through the Center for Disease Control was used. Single day counts were compared to visit counts expected on a 7 day moving average. Significance was determined if a daily count had a recurrence interval of > 100 days, corresponding to a P < 0.01.
We based sample size calculations on an estimated 50 ED respiratory distress patients per week out of about 2000 ED patients per week, and the ability to detect a difference of about 4 patients per week over a 2 week period, with significance of 0.05 with 80% power. Institutional review board (IRB) approval was granted in September 2008 by the IRB of Kaiser Permanente.
Atmospheric Data
In order to gain an understanding of how air quality changed during the fires and if poor air quality occurred on days ED visits spiked we charted the air quality index (AQI) for San Diego county. We used October 17, 2007 air quality readings as representative of pre-fire air quality. We used October 21, 2007 to November 6, 2007 readings for the fire period. We used November 10, 2007 readings to represent the air quality after the fires were suppressed. The air quality data was acquired from the AIRNow board of San Diego County. There were 9 sites available for viewing and available to the public on the website http://airnow.ca.gov.2 Daily readings were available. The AQI is comprised of 4 major pollutants which are particulate matter, ozone, carbon monoxide, and sulfur dioxide. The index is broken down into colors and numbers to report air quality. An AQI value of 100 corresponds to the national air quality standard for the pollutant. An AQI of 100 corresponds to 150 micrograms/m3 (μg/m3) of particulate matter < 10 microns (PM10) averaged over 24 hours which defines the yellow index, indicating a moderate health risk. An AQI of 200 corresponds to a PM10concentration of 354 μg/m3 averaged over 24 hours. The 24 hour AQI color values were used as a daily measure for each date studied. An AQI calculator supplied by AIRNow can be used to convert AQI to PM10 concentration.
RESULTS
We found significant increases in average visits between the pre-fire period and fire period for the chief complaints of dyspnea. (Table 1) During the fire dyspnea as a chief complaint increased by 3.2 visits per day (P = 0.0105). Visits with a chief complaint of asthma increased significantly by 1.5 visits (P = 0.0211). Visits with a chief complaint of cough did not see a significant difference when comparing the number of visits before and during the fires.
Number of emergency department visits for selected respiratory disease indicator – October 1 to November 6, 2007.
We evaluated the data using the diagnosis of asthma and found significant differences between the pre-fire period and during the fire period for the average number of daily visits (Table 1). A diagnosis of asthma was made in 2.6 more patients per day during the fire period (P = 0.038). There were no statistically significant increases in the average number of visits for the diagnosis of bronchitis, COPD, or respiratory syndrome.
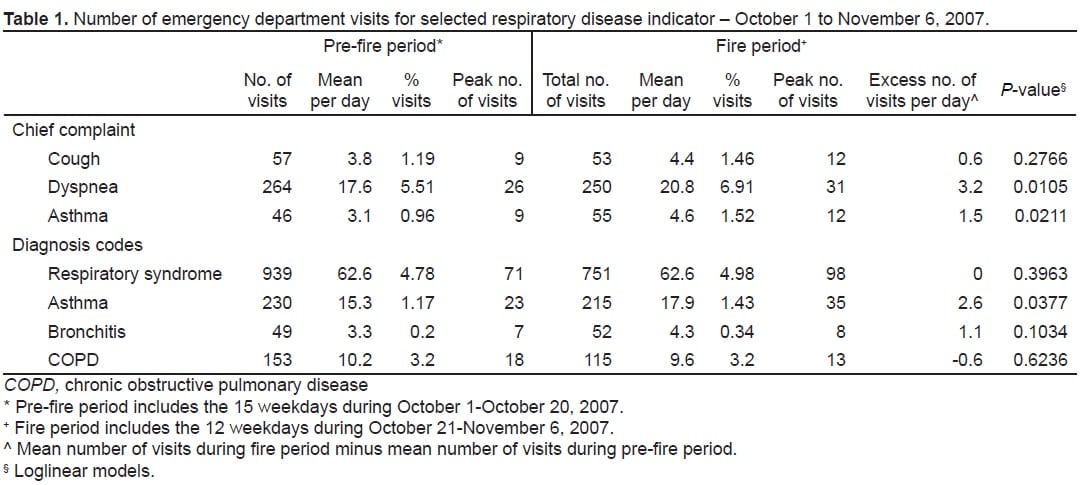
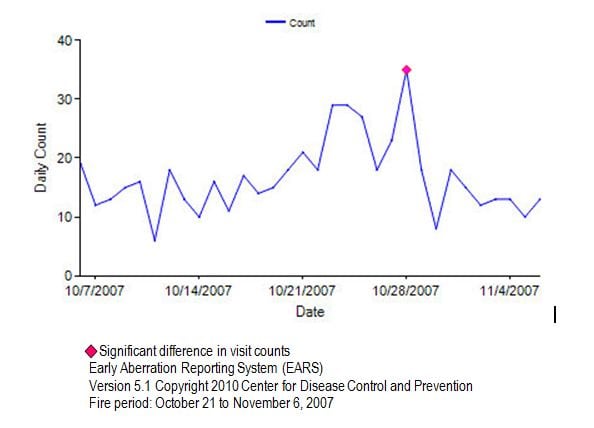
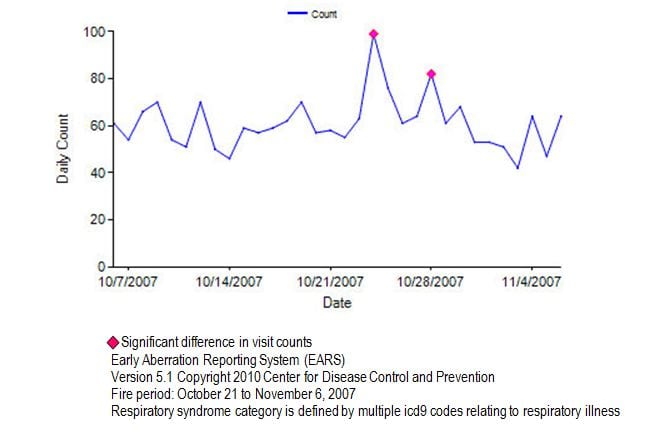
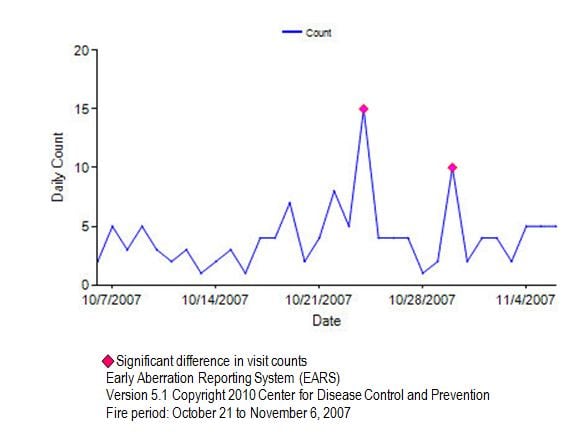
Using the EARS software, we found significant single day visit counts during the fire period. Visits for the diagnosis of asthma were significantly elevated (35 visits) on October 28, 2007, more than double the mean number of visits compared to the pre-fire period (15.9 visits) (Figure 1). When the respiratory syndrome category was analyzed, we found significant visit elevations on October 24 and October 28, 2007 (Figure 2). Two days during the fire period had significant spikes for the chief complaint of dyspnea on October 25, 2007 (15 visits) and October 30, 2007 (10 visits) (Figure 3). On October 23, 2007 visits for the chief complaint of asthma spiked significantly (12 visits) (Figure 4).
Emergency department visits for the diagnosis of asthma for October 7, 2007 to November 6, 2007.
Emergency department visits for the diagnosis of respiratory syndrome for October 7, 2007 to November 6, 2007.
Emergency department visits for the chief complaint of dyspnea for October 7, 2007 to November 6, 2007.
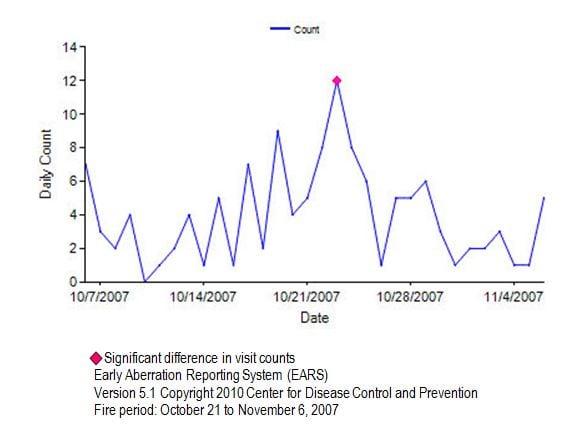
Emergency department visits for the chief complaint of asthma for October 7, 2007 to November 6, 2007.
When we evaluated the ED mean LOS averaged over all visits (LOS) for the pre-fire period and fire period. We found the duration for an average visit remained unchanged at 2.94 hours (Table 3).

Average length of stay.
Air quality during the fire period between October 21, 2007 to November 6, 2007 reached a level of purple (300) on the AQI scale near the Poomacha fire, interpreted as very unhealthy and corresponding to a PM10 level of 424 μg/m3, at its peak on Oct 23, 2007. For the week prior the AQI in the San Diego county was diffusely in the 1–50 health range. By 8pm November 10, 2007 the air quality stations all read normal readings in the 1–50 range (Table 2).2
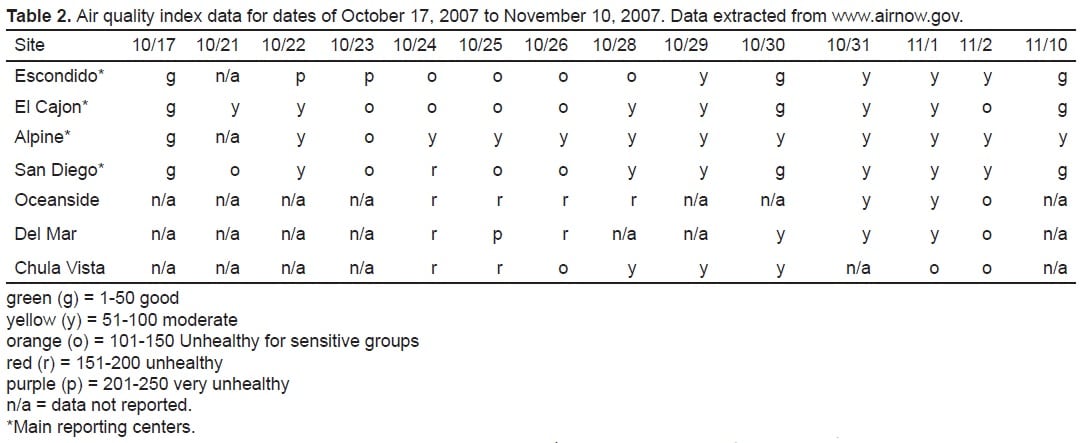
Air quality index data for dates of October 17, 2007 to November 10, 2007. Data extracted from www.airnow.gov.
DISCUSSION
Our data shows that during this unprecedented event in American history, our ED was affected with a significant increase in visits for respiratory syndromes and respiratory complaints, such as asthma, on numerous days during the fire period. Most notably on October 23, 2007 there was double the amount of asthma visits seen in the ED compared to the mean visit count in the preceding weeks before the fire. This finding of respiratory illness visits increasing during periods of poor air quality is supported by other similar studies.3–7 The direct impact on our department was the increase in demand on resources that were available at the time. Despite the increase in demand, staff and physicians still maintained similar throughput times compared to the pre-fire period (Table 3).
Air pollution has been directly correlated with ED visit increases for asthma.5 When air quality worsens it impacts certain populations more severely. This population include children, asthmatics, COPD patients, the elderly and pregnant women.5 Most strongly associated with this is particulate matter and especially PM10.5
PM10
In 1987, Particulate matter monitored by the Environmental Protection Agency was restricted to particles with a diameter of < 10 micrometers (PM10).3 Particles of this size, usually soot, can be deposited in the lungs and cause damage to the airways and gas exchanging portions of the lungs. The particulate matter’s biological effects on the respiratory tract are determined by the particulate composition, location of deposit, and the biological response to this particulate.5 Epidemiological studies have found the effects to be independent of the chemical composition of the particulate matter.5 Particulate matter from residential wood combustion was studied by Lipsett et al6, who found that colder temperatures most likely result in more particulate matter in the air with subsequent increases in ED visits. Dockery and Pope5 extensively studied PM10 and found that total mortality increased 1% for every 10 μg/m3 increase in PM10 matter. Even stronger an association was found with respiratory mortality which increased by 3.4% for every increase of 10 μg/m3 of PM10 matter. 5 Prior studies have demonstrated small but significant increases in ED visits during incremental spikes in daily particulate matter readings.6–8 Other studies evaluating the respiratory health of asthmatics showed increases in lower respiratory illness.9 Dockery et al5 showed that increasing levels of PM10 in the air results in a decrease in peak expiratory flow rates.
The Environmental Protection Agency (EPA) created the AQI to help the public understand easily the standards of air quality and correlate these numbers with health risk. Using an AQI to concentration conversion calculator supplied by the EPA, it is determined that a color level of purple (very unhealthy), with an numeric AQI between 201–300, corresponds to air having concentrations of PM10 ranging from 355 μg/m3 to 424 μg/m3. At the purple level the EPA states that there may be a significant increase in respiratory symptoms and aggravation of lung disease, such as asthma.2 Our study shows that the AQI reached dangerous levels at several different monitoring stations during the fire period. These monitoring stations were located in places within the catchment area of our hospital. Our results show a significant rise in ED visits for respiratory illness and asthma during this period of low air quality. This supports that patients caught in these areas of poor air quality were seeking medical attention at the ED.
Wildfires
When the morbidity caused by the 1991 Alameda County fire in California was studied, they showed that medical patients outnumbered trauma patients by a ratio of more than 2:1.3 An Australian paper in 2002 examined the relationship between particulate matter readings in Darwin, Australia from brushfires and the number of hospital presentations for asthma.7 They found that once the level of PM10 increased to greater than 40 μg/m3 there was a significant increase in the asthmatic cases that presented to their EDs.7 In some locations surrounding our hospital the PM10concentration rose to greater than 300 μg/m3. Studies from Colorado wildfires show that spikes in particulate matter results in significant elevations in symptom scores.10 At the time of the 2007 wildfires a Center for Disease Control and Prevention (CDC) program called Biosense, designed to collect chief complaint and diagnosis data for syndromic surveillance, was implemented in several participating hospitals in the San Diego area.11 We were not a participating federal hospital in the study, however our data supports their findings of increased asthma visits to the ED.11 We used the CDC early aberration reporting system (EARS) C-2 algorithm to analyze our counts and found it to be an effective tool in determining the significance of the spikes in counts. The software was able to determine if the spikes were expected or aberrant. Compared to the pre-fire period several single days during the fire period stand out as significant increases in volume. For the physician diagnosis of asthma October 28, 2007 was significantly elevated (Figure 1). For the respiratory syndrome category October 24 and October 28, 2007 were significantly elevated (Figure 2). Looking at the chief complaint of dyspnea we found October 24 and 30 as significant dates (Figure 3). Visits for the chief complaint of asthma were found to be significantly elevated on October 23, 2007 (Figure 4). Looking at this data as a whole we see that after October 21, 2007 our department was significantly affected on numerous days and thus confirms this was a notable 2 week period in our ED operations for respiratory illness.
Delayed Response
The lag time of presentation to the ED after a spike in increased particulate matter is consistent with previous data. Schwartz found data suggesting a delayed response.12 We found that the spike in PM10 was highest on October 22 and 23, 2007 for areas around Escondido, CA and El Cajon, CA (Table 2) and the physician diagnosis of asthma increased sharply on October 23, 2007 and remained elevated the next 2 days (Figure 1). The number of visits for dyspnea then elevated significantly on October 24, 2007 (Figure 3). Westerly towns affected by the Santa Ana winds, like Del Mar, CA, and Oceanside, CA had a decrease in air quality around October 25, 2007. Our ED saw an increase in visits with physicians diagnosing asthma starting again on October 27, spiking on October 28, at nearly double the visits compared to pre-fire mean counts (Figure 1). It is possible these increases in visits are related to delayed presentations to the ED for people affected by the October 25th air quality decrease. A possible explanation for the delay is that patients may attempt home treatment due to logitisitcs of the fire in regards to securing personal safety and structural dwellings. Alternative explanations include the cumulative worsening of the fires from the onset until containment or improvement in winds and weather. The fires were of varying intensities on different days in different geographical areas around the county. This may have contributed to the variable spikes in visitors we observed.
Length of stay
We found that overall LOS for the average visit remained unchanged at 2.94 hours during the fire period and the pre-fire period. We did not find that the increased volume of respiratory patients or the milieu of a historic disaster caused other patients to have increased stay times. ED LOS is affected by many factors such as triage operations, ethnicity, age, inpatient bed availability, and severity of illness.13,14 Care of the mild to moderate asthmatic requires limited triage time, few imaging studies if any, and most patients are discharged if treatment is successful. The increase in volume of respiratory patients most likely did not impact overall resources to treat sicker patients in the ED who required admission beds, blood work and imaging studies and who would affect LOS times.
LIMITATIONS
Limitations to the study are due to it being a database study. ICD 9 coding and chief complaint are diagnoses entered by staff and could be under or over representing the data if misdiagnosis or triage complaints were erroneous. However, prior studies have shown that database studies are reliable.15The effects of a massive evacuation resulting in the dispersion of our hospitals normal patients is not known. As well, government orders to remain off large interstate roadways, occurring between October 22, 2007 to October 24, 2007 limited traffic in the area for several days.1 These variables more likely reduced the number of visits, resulting in an underreporting of the numbers of people with respiratory disease to the ED.
CONCLUSIONS
In summary, the wildfires caused an increase in respiratory illness visits to our ED. This was due to the increase in air pollution during the time period the fires burned. This research supports the recommendation that people with respiratory diseases, such as asthma, avoid exposure to the pollutants of wildfires. For emergency providers treating victims of wildfires, the need to augment ED services in particular respiratory services in the wake of future wildfire disasters may be necessary. The clinical impact and significance of our data suggests the need to formulate specific surge capacity policies and procedures to mitigate the effects of wildfires and increased respiratory illness visits to the ED. In addition, respiratory staff and resources may be taxed by outside stressors. In particular, our hospital received transfers of ventilated patents from outllying hospitals and nursing homes that were forced to evacuate. Since our respiratory therapy staff administered the ED nebulization treatments these transfers may have burdened the EDs resources. The authors suggest developing a virtual disaster pack of supplies that can be readily deployed during surges. A virtual disaster pack consists of pre-set inventory of medical supplies to be used in a disaster. The pack does not physically exist until requested from the distributor thereby not taxing already limited physical storage space at facilities. In addition, a specific staffing surge capacity plan for providers, nursing and ancillary staff including respiratory therapists needs to be outlined in anticipation of additional staffing resources. This has been implemented at our facility with incorporation of a web based rapid response notification system. It allows rapid notification via text messages, email and phone call of predetermined personnel during surge capacity needs. Establishing policies and procedures specifically addressing staffing and resource needs should be instituted to mitigate the anticipated increased needs during wildfires.
Footnotes
Supervising Section Editor: H. Bryant Nguyen, MD
Submission history: Submitted October 18, 2011; Revisions received April 30, 2012; Accepted October 22, 2012
Full text available through open access at http://escholarship.org/uc/uciem_westjem
DOI: 10.5811/westjem.2012.10.6917
Address for Correspondence: Paul B. Dohrenwend, MD, Emergency Department, Kaiser Permanente San Diego, 4647 Zion Ave., San Diego, CA 92120. Email: dcdpbd@kaiser-ed.com.
Conflicts of Interest: By the WestJEM article submission agreement, all authors are required to disclose all affiliations, funding sources and financial or management relationships that could be perceived as potential sources of bias. The authors disclosed none.
REFERENCES
1. San Diego County firestorms after action report. San Diego, CA: County of San Diego, Office of Emergency Services; 2007. Available at:http://www.sdcounty.ca.gov/oes/docs/2007_SanDiego_Fire_AAR_Main_Document_FINAL.pdf. Accessed September 18, 2008.
2. Local Air Quality and Conditions. San Diego, Ca: Available at: http://airnow.ca.gov. Accessed September 18, 2008.
3. Shusterman DS. Immediate health effects of an urban wildfire. West J Med. 1992;158:133–138.[PMC free article] [PubMed]
4. Caslellsague J, Sunyer J, Saez M, et al. Short-term association between air pollution and emergency room visits for asthma in Barcelona. Thorax. 1995;50:1051–1056. [PMC free article][PubMed]
5. Dockery DW, Pope CA. Acute respiratory effects of particulate air pollution. Ann Rev Public Health. 1994;15:107–132. [PubMed]
6. Lipsett M, Hurley SB, Ostro B. Air pollution and emergency room visits for asthma in Santa Clara County, California. Environ Health Perspect. 1997;105:216–222. [PMC free article] [PubMed]
7. Johnston FH, Kavanagh AM, Bowman DM, et al. Exposure to bushfire smoke and asthma: an ecological study. Med J Aust. 2002;176(11):535–538. [PubMed]
8. Scarlett JF, Abott KJ, Peacock JL, et al. Acute effects of summer air polluton on respiratory function in primary school children in southern England. Thoras. 1996;51:1109–1114.[PMC free article] [PubMed]
9. Romieu I, Meneses F, Ruiz S, et al. Effects of air pollution on the respiratory health of asthmatic children living in Mexico City. Am J Respir Cril Care Med. 1996;154:300–307. [PubMed]
10. Wordley J, Walters S, Ayres J. Short Term variations in the hospital admissions and mortality and particulate air pollution. Occup Environ Med. 1997;54(2):108–116. [PMC free article] [PubMed]
11. Norris G, YoungPong S, Koenig J, et al. An association between fine particles and asthma emergency department visits for children in Seattle. Environmental Health Perspective.1999;107:489–493. [PMC free article] [PubMed]
12. Sutherland ER. Wildfire smoke and respiratory symptoms in patients with chronic obstructive pulmonary disease. J Allergy Clin Immunol. 2005:420–422. [PubMed]
13. Olson DR, Heffeman RT, Paladini M, et al. Monitoring the impact of influenza by age: emergency department fever and respiratory complaint surveillance in New York City. PloS Med.2007;4(8):247. [PMC free article] [PubMed]
14. Ginsberg M. Monitoring health effects of wildfires using Biosense System – San Diego County. CA: Oct, 2007. Available at: http://www.cdc.gov/mmwr/preview/mmwrhtml/mm5727a2.htm. Accessed September 18, 2008. [PubMed]
15. Canny GJ, Reiman J, Healy R. Acute asthma: observations regarding the management of a paediatric emergency room. Pediatrics. 1989;83:507–512. [PubMed]
16. Schwartz C, Petrou C, Rebycj AS, et al. Acute asthma observations regarding the management of a pediatric emergency room. Pediatrics. 1989;83:507–512. [PubMed]
17. Delfino RJ, Beckdale MR, Hanley JA. Reliabilty of hospital data for population based studies or air pollution. Arch Environ Health. 1993;48:140–146. [PubMed]
18. CDC Biosense – Monitoring tthe Health Effects of Wildfires Using the Biosense System Available at:http://www.cdc.gov/mmwr/preview/mmwrhtml/mm5727a2.htm. Accessed September 18, 2008.