
| Author | Affiliation |
|---|---|
| Chad S. Kessler, MD | Jesse Brown Veteran’s Affairs Medical Center, Chicago, IL |
| Stephen Bhandarkar, MSIV | Jesse Brown Veteran’s Affairs Medical Center, Chicago, IL |
| Paul Casey, MD | Jesse Brown Veteran’s Affairs Medical Center, Chicago, IL |
| Andrea Tenner, MD | Jesse Brown Veteran’s Affairs Medical Center, Chicago, IL |
ABSTRACT
Veteran’s Affairs (VA) hospitals represent a unique patient population within the healthcare system; for example, they have few female and pediatric patients, typically do not see many trauma cases and often do not accept ambulance runs. As such, veteran-specific studies are required to understand the particular needs and stumbling blocks of VA emergency department (ED) care. The purpose of this paper is to analyze the demographics of patients served at VA EDs and compare them to the national ED population at large. Our analysis reveals that the VA population exhibits a similar set of common chief complaints to the national ED population (and in similar proportions) and yet differs from the general population in many ways. For example, the VA treats an older, predominantly male population, and encounters a much lower incidence of trauma. Perhaps most significantly, the incidence of psychiatric disease at the VA is more than double that of the general population (10% vs. 4%) and accounts for a significant proportion of admissions (23%). Furthermore, the overall admission percentage at the VA hospital is nearly three times that of the ED population at large (36% versus 13%). This paper provides valuable insight into the make-up of a veteran’s population and can guide staffing and resource allocation accordingly.
INTRODUCTION
Over the past two decades, the role of the emergency department (ED) has evolved from its intended function of providing acute emergent care to become the “safety net” of the healthcare system, providing both urgent and non-urgent care to millions of patients who have no alternative.1,2 From 1995 to 2005, annual ED visits in the United States increased by 20%, from 96.5 million to 115.3 million per year, and the number continues to rise. Despite the increased consumption of emergency services, EDs nationwide are struggling to keep their doors open. Saddled with heavy operating costs and growing rates of non-reimbursed care, the number of EDs has decreased by nearly 10% over the last five years. Moreover, the number of hospitals and hospital beds has also dropped, creating a dangerous bottleneck for sick patients waiting to be admitted to the hospital.3, 4
Veteran’s Affairs (VA) hospitals represent a unique patient population within the healthcare system. They have few female and pediatric patients and VA EDs typically do not encounter many trauma cases or accept 911 ambulance runs. While numerous studies have evaluated patient characteristics and patient flow through the ED, limited information exists about the specific demographics of the veterans’ ED.5–9 The purpose of this paper is to analyze the patients served at a large VA ED and compare them to the ED population at large. Specifically, the paper will look at patient complaints and admissions, severity of illness, and the timing of visits of the VA population. The data will help VA hospitals and community practitioners caring for veterans to better anticipate the needs of a typical VA patient.
METHODS
A retrospective analysis was performed on all patients presenting to the ED of a large urban Level I Veteran’s Administration medical center over a one-year period, from January 1, 2006, to December 31, 2006. The center is a 188-bed, Level I-B tertiary hospital that provides care to approximately 62,000 veterans in a major urban area. The ED consists of 15 beds and is staffed by a combination of board-certified emergency physicians, internists, internal medicine residents and staff nurses. During the study, the majority of overnight shifts were staffed by internists and residents, a practice that has since changed. Twenty-four hour psychiatric services are available. The ED does not accept 911 ambulance calls and is not a trauma referral center.
In total, 13,464 patient encounters were identified via the hospital’s electronic medical records system. Prior to analysis, all patient data were de-identified to include patient age, sex, visit day and date and time and length of ED stay. Visit severity was divided into five categories based on current procedural code (CPT): self-limited/minor, low, moderate, high and highest severity. For admitted patients, the type of admission (ward, ICU, etc) and primary admission diagnosis were included, as coded by International Classification of Disease Clinical Modification, ninth revision (ICD-9-CM). National data were derived from the 2006 National Hospital Ambulatory Medical Care Survey (NHAMC). For data not included in the national report, data were available from the public dataset athttp://www.cdc.gov/nchs/ahcd/ahcd_questionnaires.htm. We tabulated and analyzed data for statistical significance using SAS-PC for Windows Version 8.0. The local institutional review board approved the research proposal.
RESULTS
From January 1, 2006, to December 31, 2006, there were 13,464 patient encounters in the Veterans Administration ED. Ninety-five percent of patients were men. The mean age was 60 years old, with a range from 21 to 101 years. January was the busiest month, accounting for 9.2% of patient visits, and Monday was the busiest day of the week, with 16% of visits. November and July were the least busy months (7.7% each), while Sunday was the quietest day of the week, with 12% of visits. In the national survey, January also proved to be the busiest month (9.1% of visits), while April was the quietest month (7.2%). Nationally, Monday was also the busiest day of the week (15.3%), while Thursday was the quietest day (13.9%).
The majority of patient visits to the VA ED occurred during the hours of 9AM–5PM, followed by the periods of 5 PM–1 AM and 1 AM to 9 AM, respectively. Overall, 4,847 patients, or 36%, were subsequently admitted. The highest gross number of admissions occurred during the hours of 9AM–5 PM (2,036); however, the highest percentage of admissions occurred from 5 PM – 1 AM (51%). Nationally, the highest number of visits took place from 5 PM – 1 AM, while the highest percentage of admissions came during the daytime hours (9 AM – 5 PM). Admission percentages for all time periods were significantly different (p<0.01) between the VA and the national population.
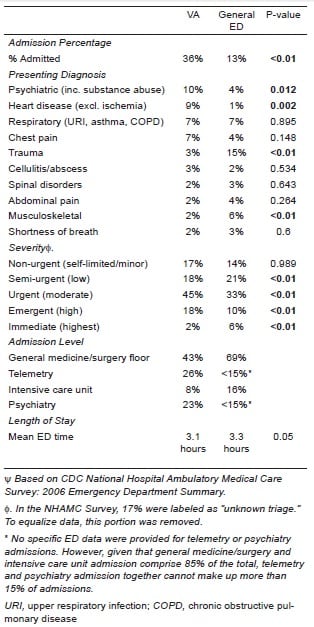
The majority of patients admitted to the VA hospital were admitted to general medical-surgical floors, followed by telemetry and intensive care. Twenty-three percent were admitted to the psychiatric unit. The average length of stay in the ED for admitted patients (from time of triage to admission to the inpatient ward) was three hours and six minutes. Length of stay in the national survey was three hours and 18 minutes; this difference was not statistically significant.
The most common presenting complaints at the VA were psychiatric in nature (including substance abuse), accounting for over 10% of all visits. This was followed by non-ischemic heart disease, respiratory complaints, chest pain and trauma. The most common diagnoses leading to admissionwere psychiatric, followed by non-ischemic heart disease. Chest pain, respiratory complaints and abdominal pain complete the top five diagnoses leading to admission. A list of the top 10 presenting and admitting diagnoses is provided in Table 1. The majority of visits were of a moderate severity (45%), followed by high and low severity. Problems categorized as “highest severity” accounted for only a small percentage of visits (2%). Table 2 provides a comparison of primary diagnosis, problem severity, admissions and length of stay in the VA and national ED populations.

DISCUSSION
The data in this survey provide information about the veteran population that may be used to better anticipate and guide staffing needs in VA EDs and communities where veterans reside. The overall admission rate for the VA ED was 36%-significantly higher than that of the ED population nationally (13%). This percentage is partially explained by the large proportion of psychiatric illness, which surpassed all other diagnoses, including cardiac disease, and led to nearly one-fourth of all admissions. Such a high incidence of psychiatric patients has prompted this institution to have 24-hour mental health staff available. When these patients are removed from the data, the VA admission percentage drops to 30%. However, this is still more than double the rate of the national ED population, suggesting that the VA treats a sick patient population.
Beyond psychiatric disease, the top diagnoses in the VA appear in similar proportions to the general ED population, with a few notable exceptions. First, non-ischemic cardiac disease is seen in a significantly higher percentage at the VA. This may be attributable to the older age of the VA population. Second, the incidence of trauma was significantly lower at the VA – as this institution is not a trauma referral center, a lower percentage is not surprising. Finally, musculoskeletal complaints were also significantly lower at the VA. This may be associated with the scarcity of minor trauma in the older VA population.
LIMITATIONS
This study has a number of limitations. First, the study was retrospective in nature and relied heavily on subjective diagnostic coding for analysis. Government-funded VA hospitals place less emphasis on insurance providers and billing than non-government centers. Accordingly, the CPT coding may not be reliable.
The study was conducted at a single urban veteran’s hospital, which may not be “typical.” As such, the data may not be generalizable to the VA population as a whole. During the study, morning shifts (1 AM – 9 AM) were staffed almost exclusively by internists and an assortment of residents, while other hours of the day were staffed by a combination of internists, emergency physicians and residents. Data regarding specific staffing are not available, and the impact this has on admissions is unknown. Finally, though comparison data from the CDC NHAMC Survey was generally analogous to our data, certain information was not equivalent. For example, admission level (general, ICU, etc.) was not broken down into the same categories as our data and thus required some extrapolation.
CONCLUSION
This paper yields practical data that characterizes the VA ED patient population and aids practitioners in determining the unique needs of this demographic. There are limited data pertaining specifically to the VA population and this study will allow a re-evaluation of resource allocation within the VA ED to ensure satisfactory staffing and ancillary services are available. With ongoing wars in Iraq and Afghanistan, increasing numbers of women serving in the armed forces, and an aging veteran population, the VA ED remains a dynamic place. As such, this paper not only provides insight into current ED trends, but can act as a baseline for future research.
Footnotes
Supervising Section Editor: Leslie Zun, MD
Submission history: Submitted January 21, 2010; Revision received April 22, 2010; Accepted July 1, 2010
Reprints available through open access at http://escholarship.org/uc/uciem_westjem.
Address for Correspondence: Chad S Kessler, MD, Department of Emergency Medicine, Jesse Brown VA Medical Center, M/C 111, Chicago, IL 60612
Email: Chad.kessler@va.gov
Conflicts of Interest: By the WestJEM article submission agreement, all authors are required to disclose all affiliations, funding sources, and financial or management relationships that could be perceived as potential sources of bias. The authors disclosed none.
REFERENCES
1. Asplin BR. Tying a knot in the unraveling health care safety net. Acad Emerg Med. 2001;8:1075–9.[PubMed]
2. American Academy of Pediatrics Committee on Pediatric Emergency Medicine Overcrowding crisis in our nation’s emergency departments: is our safety. Pediatrics. 2004;114(3):878–88.[PubMed]
3. Pitts SR, Niska RW, Xu J, et al. National Hospital Ambulatory Medical Care Survey: 2006 Emergency Department Summary. Available at: http://www.cdc.gov/nchs/data/nhsr/nhsr007.pdfAccessed February 15, 2008.
4. AHA Hospital Statistics. Chicago, IL: Health Forum; 2008.
5. Schull MJ, Kiss A, Szalai J-P. The effect of low-complexity patients on emergency department waiting times. Ann Emerg Med. 2007;49:257–64. [PubMed]
6. United States General Accounting Office Emergency departments: unevenly affected by growth and change in patient use. Jan, 1993. Report to the Chairman, Subcommittee on Health for Families and the Uninsured, Committee on Finance, US Senate, Available at:http://161.203.16.4/d36t11/148331.pdf. Accessed February 15, 2008.
7. Trzeciak S, Rivers E. Emergency department overcrowding in the United States: an emerging threat to patient safety and public health. Emerg Med J. 2003;20:402–405. [PMC free article][PubMed]
8. Espinosa G, Miro O, Sanchez M, et al. Effects of external and internal factors on emergency department overcrowding. Ann Emerg Med. 2002;39:693–5. [PubMed]
9. Rathlev NK, Chessare J, Olshaker J, et al. Time series analysis of variables associated with daily mean emergency department length of stay. Ann Emerg Med. 2007;49:265–72. [PubMed]