
| Author | Affiliation |
|---|---|
| Barbara J Barnett, MD | NSLIJ Healthcare System, Emergency Medicine Department, New Hyde Park, New York NSLIJ Healthcare System, Internal Medicine Department, New Hyde Park, New York Hofstra North Shore–LIJ, School of Medicine at Hofstra University, Hempstead, New York |
| Stacy Nunberg, MD | NSLIJ Healthcare System, Emergency Medicine Department, New Hyde Park, New York |
| Julia Tai, MA | Feinstein Institute for Medical Research, Biostatistics Unit, Manhasset, New York |
| Martin L Lesser, PhD | Hofstra North Shore–LIJ, School of Medicine at Hofstra University, Hempstead, New York Feinstein Institute for Medical Research, Biostatistics Unit, Manhasset, New York |
| Vladmir Fridman, MS | Albert Einstein School of Medicine, Bronx, New York |
| Patricia Nichols, MD | NSLIJ Healthcare System, Emergency Medicine Department, New Hyde Park, New York |
| Richard Powell, MD | NSLIJ Healthcare System, Emergency Medicine Department, New Hyde Park, New York |
| Robert Silverman, MD | NSLIJ Healthcare System, Emergency Medicine Department, New Hyde Park, New York Hofstra North Shore–LIJ, School of Medicine at Hofstra University, Hempstead, New York Feinstein Institute for Medical Research, Biostatistics Unit, Manhasset, New York |
ABSTRACT
Introduction:
Identifying fever can influence management of the emergency department (ED) patient, including diagnostic testing, treatment, and disposition. We set out to determine how well oral and tympanic membrane (TM) temperatures compared with rectal measurements.
Methods:
A convenience sample of consecutively adult ED patients had oral, TM, and rectal temperatures performed within several minutes of each other. Descriptive statistics, Bland–Altman agreement matrices with 95% confidence interval (CI), and measures of test performance, including sensitivity, specificity, predictive values, and interval likelihood ratios were performed.
Results:
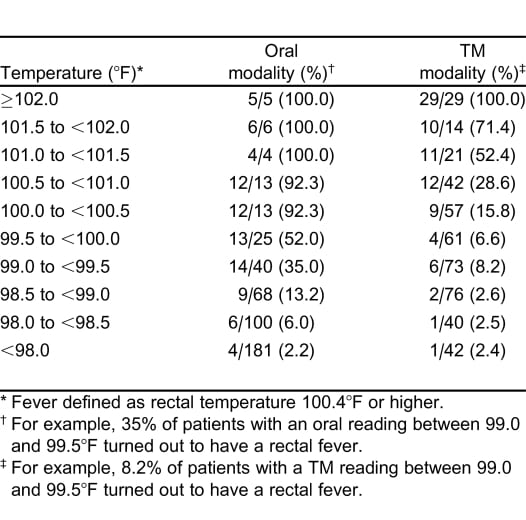
A total of 457 patients were enrolled with an average age of 64 years (standard deviation: 19 years). Mean temperatures were: oral (98.3°F), TM (99.6°F), and rectal (99.4°F). The mean difference in rectal and oral temperatures was 1.1°F, although there was considerable lack of agreement between oral and rectal temperatures, with the oral temperature as much as 2.91°F lower or 0.74°F higher than the rectal measurement (95% CI). Although the difference in mean temperature between right TM and rectal temperature was only 0.22°F, the right TM was lower than rectal by up to 1.61°F or greater by up to 2.05°F (95% CI). Test performance varied as the positive predictive value of the oral temperature was 97% and for tympanic temperature was 55% (relative to a rectal temperature of 100.4°F or higher). Comparative findings differed even at temperatures considered in the normal range; among patients with an oral temperature of 98.0 to 98.9, 38% (25/65) were found to have a rectal temperature of 100.4 or higher, while among patients with a TM of 98.0 to 98.9, only 7% (10/134) were found to have a rectal temperature of 100.4 or higher.
Conclusion:
The oral and tympanic temperature readings are not equivalent to rectal thermometry readings. Oral thermometry frequently underestimates the temperature relative to rectal readings, and TM values can either under- or overestimate the rectal temperature. The clinician needs to be aware of the varying relationship between oral, TM, and rectal temperatures when interpreting readings.
INTRODUCTION
Determining the body temperature can influence management of the emergency department (ED) patient, including diagnostic testing, treatment, and disposition. In the ED, the first and sometimes only measured temperature occurs during the triage process. There are several common modes of temperature measurement in the ED setting: axillary, oral, tympanic, and rectal. Although rectal temperature measurements are generally accepted as the most practical estimation of core temperature,1–3 the need for privacy and patient discomfort/embarrassment limit its use as a first-line measurement. Axillary readings do not adequately approximate core readings and are not recommended for general screening.2
Even though EDs commonly rely on oral or tympanic measures to screen for fever, the standard for thermometry in the ED remains in question.4 Several studies have evaluated oral and tympanic thermometry to assess body temperature; however, no one study has compared oral, rectal, and tympanic thermometry in the adult ED. Little evidence supports the use of oral or tympanic as substitutes for rectal measurement in adult emergency patients.2,5,6 Studies have typically found oral readings to be lower than rectal readings, while tympanic membrane (TM) readings have been found to be higher, lower, or the same as rectal values.7–9 Less attention has been given to determining how well oral or tympanic thermometry performs in predicting fever by rectal measurement in the ED setting. We set out to determine how well oral and tympanic temperatures agree with rectal measurements in an adult ED population, and we calculated interval likelihood ratios for a range of temperature values to assess the utility of these measurements as surrogate indicators for rectal fever.
METHODS
A convenience sample of consecutive patients was enrolled over a 4-month period in the ED of Long Island Jewish Medical Center. After patients were triaged by the nurse, the investigator determined patient eligibility. All patients 18 years or older presenting to the ED with triage categories 1, 2, or 3 were eligible for the study. Patients were triaged on the basis of a 4-tier approach:10 category 1 (most severe emergency) included cardiac arrest, severe chest pain, and massive blood loss; category 2 (strong potential for emergency) included acute abdominal pain, chest pain, or dyspnea; category 3 (potential emergency) included abdominal pain or acute back pain. Category 4, which was classified as nonemergent and included patients with minor or chronic issues, was not included in our study. Patients with an altered mental status, extirpated rectum, and those who had received chemotherapy within the previous 3 weeks were also excluded.
Two investigators [a medical student (V.F.) and a senior emergency medicine (EM) resident (P.N.)] were trained in the proper use of the instruments and obtained all measurements in the study. Within 30 minutes of being placed in a treatment room, the patient’s temperature was measured via oral, rectal, and tympanic routes by 1 of the investigators. All measurements were obtained within 5 minutes of each other. Oral temperature measurements were obtained utilizing the electronic oral probe of the IVAC Temp Plus II, model 2080A (IVAC Corporation, San Diego, California). The probe was placed in the posterior lingual pocket until the thermometer auditory signal was sounded.11 The adequacy of this measurement was documented based on predetermined criteria of patient cooperation and operator technique. Oral temperatures were taken at least 30 minutes after mastication, drinking hot or cold liquids, or smoking so as not to alter the measurement.11,12Tympanic temperature measurements were obtained with the First Temp Genius II, model 3000A infrared tympanic thermometer (Kendall Company, Mansfield, Massachusetts) set in the rectal mode and performed according to the manufacturer’s instructions. The ear-based measurements were taken after inspecting for cerumen in both auditory canals. The rectal temperature measurements were obtained by first lubricating the rectal probe of the IVAC Temp Plus II, model 2080A (IVAC Corporation) with room temperature gel, then inserting it into the rectum 2 to 4 cm and removing it after the instrument signaled completion. Any abnormally high or low temperature readings (less than 96°F or greater than 100.4°F) obtained via this method was reported to the senior resident and/or attending physician on duty. All study instruments were factory calibrated and used only for study purposes. Calibration of the oral and rectal thermometer was confirmed by water bath at 98°F and 105.8°F at the start and completion of the study. Tympanic thermometer calibration was verified by the vendor’s electronic calibration unit at the midpoint and end of the study.
The Institutional Review Board at Long Island Jewish Medical Center approved this study and waived the need for written informed consent. Verbal consent was provided by all study patients.
Statistical Methods
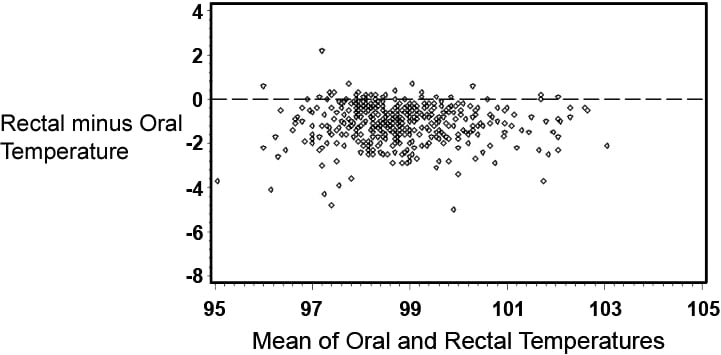
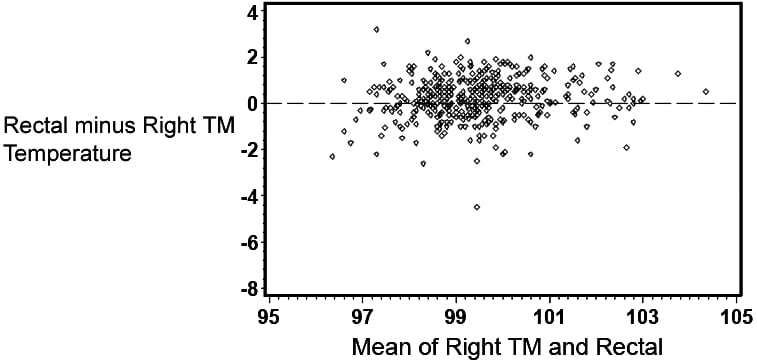
The statistical analysis was carried out in 4 parts. The first was to determine degree of agreement between rectal temperature and each of the oral, left and right TM, and maximum TM readings. For these analyses, the method of Bland and Altman13 was used. The difference between 2 measurements was plotted as a function of the mean of the 2 measurements, and limits of agreement (which are equivalent to 95% confidence intervals for an individual difference between the 2 measurements; the limits are not a confidence interval for the mean difference) were computed, allowing the reader to decide whether the upper and lower limits of agreement are consistent with the reader’s concept of equivalence.
The second set of analyses used rectal temperature as a reference gold standard for core body temperature. Fever was defined as a rectal temperature of at least 100.4°F.2,14,15 These analyses used a cut point of 100.4°F for oral and right TM to determine the sensitivity, specificity, predictive values, and likelihood ratios for that cutoff point. Left TM, which yielded results nearly identical to right TM, was excluded from these and subsequent analyses.
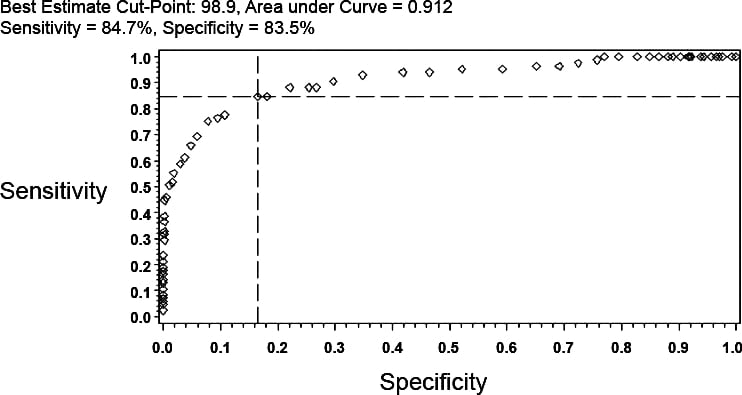
In the third analysis, receiver operating characteristic (ROC) curves were constructed for oral and right TM in order to determine an optimal cut point for prediction of rectal fever.16 The optimality criterion that was used for deriving a cutoff point was done algorithmically by computing the Euclidian distance from the point (0, 1) to the various points on the empirical ROC curve and choosing the point that minimized the distance.
The final set of analyses involved stratifying temperatures and determining both the prevalence of fever and calculation of interval likelihood ratios (ILR) for varying cutoff points for both oral and right TM.17–19
RESULTS
Characteristics of Study Patients
A total of 457 patients were enrolled in the study. The average age was 64 years (standard deviation: 19, range: 18–96 years) and 59% were female. Two patients were excluded due to incomplete data collection, leaving 455 patients in the analysis. The average ambient temperature of the ED was 71°F (standard deviation: 0.9) and fell into a narrow range of 70 to 74°F during the study period. There were 2 (0.4%), 47 (10.3%), and 399 (87.3%) patients in triage category 1, 2, and 3, respectively, with a triage level not available for 9 (2.0%). Oral temperature technique was considered adequate in 97.6% of patients.
Analysis of Agreement
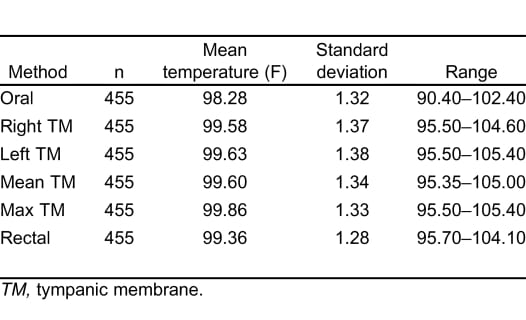
Table 1 provides summary statistics for the sample of 455 subjects with rectal, oral, and TM temperature measurements. The lowest mean temperatures were obtained via the oral route, and the highest readings were found via the tympanic method. The oral temperatures averaged 1.1°F lower than the rectal temperatures (Table 1). There was, however, considerable lack of agreement between oral and rectal temperatures with the oral temperature as much as 2.91°F lower or 0.74°F higher than the rectal measurement (95% confidence limits). Although the differences in mean temperature between right TM and rectal temperature was only 0.22°F, the computed 95% confidence limits of agreement show that right TM might be lower than rectal by up to 1.61°F or greater by up to 2.05°F. Using the method of Bland and Altman,13 Figures 1 and 2 demonstrate the actual differences in rectal temperature for each patient by oral or TM modality.
Detection of Fever
There was considerable variation in the frequency with which fever (defined as greater than or equal to 100.4°F by any modality) was identified with the 3 measurement locations. Fever was identified in 85 cases (19%) with rectal thermometry, 29 cases (6%) using oral thermometry, and 114 cases (25%) using right TM thermometry.
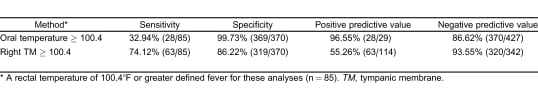
We used the study definition of fever (rectal temperature of 100.4°F or greater) to determine the sensitivities, specificities, and positive and negative predictive values of oral and tympanic thermometry. As Table 2 indicates, of the 85 patients with fever (rectal temperature of 100.4°F or greater), only 33% of them had oral temperatures greater than or equal to 100.4°F. The positive predictive value was 97%, indicating that patients with an oral temperature 100.4°F or higher almost always had a rectal fever (rectal temperature of 100.4°F or greater). TM measurements of 100.4°F or higher identified 74% of rectal fevers. The positive predictive value was 55%, indicating that only about half of patients with a tympanic temperature 100.4°F or higher had a rectal fever.
ROC for Binary Cutpoints
ROC curves were used to determine an optimal cutoff point that would dichotomize both oral temperature and right TM temperature such that a binary prediction could be made. The optimal cut point for oral readings corresponded to 98.9°F (sensitivity = 84.7%, specificity = 83.5%, AUC = 0.912) (Figure 3). In a similar way, for the right TM, ROC analysis identified a temperature of 100.2°F as the optimal cutoff (sensitivity = 80.0%, specificity = 80.8%, AUC = 0.878). For an oral reading the posttest probability of rectal fever for a 15% and 25% pretest probability was 47.6% and 63.1%, respectively (Figure 3). Likewise, the posttest probability for right TM would be 42.4% and 58.2%.
Prevalence of Rectal Fever by Multiple Temperature Intervals
To obtain a better estimate of the relationship of a range of oral or TM with rectal readings, temperature was stratified by multiple intervals and the prevalence of fever calculated (Table 3). As noted, even patients with relatively low oral temperatures occasionally had rectal temperatures considered febrile, and patients with elevated TM readings did not always have elevated rectal temperatures.
Interval Likelihood Ratios
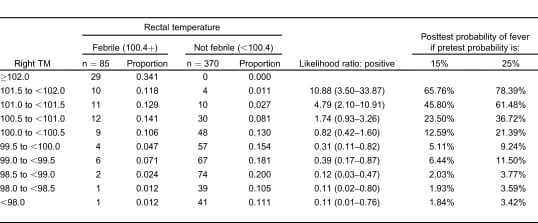
The interval likelihood ratios for a number of oral or right TM temperature ranges relative to the study definition of rectal fever are shown in Tables 4 and and5.5. While both tables show the likelihood ratio for a positive test increases steadily as the observed temperature for that modality increases, the ratios are higher for any given oral temperature range relative to tympanic readings. For example, if a patient has an oral temperature between 99.0 and 99.5°F, then the likelihood ratio is 2.34, indicating that temperatures in this range are 2.34 times as likely to come from patients with a rectal fever as without a rectal fever; this is higher than the corresponding TM likelihood ratio of 0.39. If the patient’s oral temperature is between 100.5 and 101.0°F, then the ratio rises to 52.24; this is considerably higher than the corresponding TM ratio of 1.74.
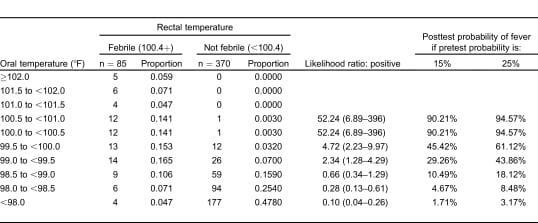
Another advantage of using likelihood ratios is the ability to estimate the posttest probability of disease for a given test result. Using the calculated interval likelihood ratio, the posttest probability of the presence of a rectal fever was determined for a pretest probability of both 15% and 25% (Tables 4 and 5). We chose these numbers since they closely bounded the overall 19% study prevalence of a rectal fever. For an oral temperature less than 98°F, the probability of a rectal temperature is very small at either pretest probability. However, at oral readings that might not be considered very elevated, there were relatively high chances of having a rectal fever. For example, at oral temperatures ranging from 99.0 to 99.49°F, the chances of a rectal fever at the lower pretest probability are about 29% and at the higher pretest probability about 44%. Oral temperatures of 100°F or greater are usually indicative of a rectal temperature regardless of which pretest probability is chosen.
As Table 5 indicates, posttest probabilities for having a rectal fever were relatively low for tympanic measures less than 100.0°F. Even at a tympanic temperature range of 100.5 to 100.9°F, most patients would be categorized as afebrile. It was only when the tympanic temperature was over 101.5°F that the majority of patients would have a rectal fever for each of the pretest probabilities.
DISCUSSION
This study helps to define the relationship between oral, tympanic, and rectal temperature measures among adults presenting to an ED. Similar to previous studies, the oral temperatures averaged 1.1°F lower than the rectal temperatures.2,7,8 This average difference, however, does not adequately represent the relationship between oral and rectal readings. As indicated by the analysis of agreement, the oral temperature can be as much as several degrees lower than the rectal temperature, while only infrequently is the oral temperature higher than the rectal reading. These differences were noted even though uniform efforts to optimize technique in assessing oral temperature were in place.
Since clinicians typically use cutoffs to categorize patients as being febrile or afebrile, interval likelihood ratios were used to assess the modalities. A rectal temperature of 100.4°F or higher was used to define fever since this cutoff is commonly used in clinical practice. It was only when oral temperatures were below 98°F that rectal temperatures were consistently (but not always) afebrile. When oral readings were in intervals ranging between 98 and 100°F, the prevalence of fever ranged widely, suggesting that oral values in this range cannot be used to exclude a fever. In contrast, the findings of oral temperatures of 100°F or higher in this adult population usually indicated the presence of a rectal fever.
In contrast to oral thermometry, the TM readings (an imputed value when the device is set to the rectal mode) averaged more similar to the rectal value, as reported in previous studies.8,21 While the intra-individual differences between the TM and rectal temperatures were also relatively large, in contrast to the oral readings, these differences were more evenly distributed in both the upper and lower directions. However, this did not indicate that rectal and TM readings were equivalent. Instead, TM readings commonly both overestimate and underestimate rectal temperatures. In contrast to oral temperatures, TM values approximating 99 to 102°F provided less certainty regarding the lack or presence of a rectal fever.
In this study we used interval likelihood ratios rather than a simply binary cut point (such as a positive predictive value or ROC), allowing comparisons of oral or tympanic readings to rectal fever with greater precision.17,19 Based on the assumption that rectal temperatures best reflect core values, the ILR allowed calculation of posttest probabilities that any given oral or TM temperature represented a fever. If these probabilities offer enough certainty, the clinician may choose to act based on these oral or TM readings. Still, as our analyses indicate, it is only at relatively low or relatively high values that greater levels of certainty are established.
For the clinician, the overall findings highlight the challenges of extrapolating a rectal temperature for any given oral or TM measure. Viewing either the oral or TM temperature as being normal or abnormal based on a predefined temperature cutoff can lead to misclassification. For example, relying on the commonly accepted definition of a normal oral temperature value less than 100.4°F, clinicians will miss a substantial number of rectally identified fevers. Further, a TM reading approximating 100.4°F often does not represent a febrile rectal temperature, and yet these same temperature cutoffs are often used by clinicians to determine whether a fever is present. This is problematic since any misinterpreted temperature reading can potentially lead to diagnostic and management errors. When any oral or TM reading does not provide enough certainty for a given clinical scenario or the penalty for missing a fever is too great, the study findings suggest rectal thermometry should be measured.
LIMITATIONS
An important study limitation is the use of rectal thermometry as the criterion standard for many of the statistical analyses. A rectal temperature was used as the criterion standard because invasive measurement of core temperature is not practical in the ED and because clinical experience has accepted rectal temperature as the best surrogate measure of body temperature. Still, it is possible that the other modalities may be equivalent or better measures of meaningful infection or illness. For example, investigators have questioned whether the rectal readings lag behind TM readings in assessing core readings.20,21 However, there is a scarcity of evidence showing that any one modality is best for diagnosing or managing patients in clinical practice.
Another limitation inherent to assessing for fever (regardless of the modality) is the difficulty in identifying which temperature cutoff determines a clinically meaningful fever. The mean oral temperature in healthy adults is 98.2°F, but for 99% of the population normal values widely extend from 96.3 to 99.9°F.15 Factors such as gender may also impact the temperature norms,15 and body temperature varies by time of day, with the lowest values in the morning and highest values in the late afternoon. Even the often cited gold standard rectal temperature of 100.4°F to define fever is a relative and not absolute cutoff.22 This has been widely accepted but never rigorously proven. Defining a cutoff is important because the lower the threshold for identifying febrile patients, the less likely a true fever is missed, but the more likely patients without true fever are misclassified. Conversely, the higher the febrile threshold, the more likely patients with a true fever will be missed.
Other limitations are the devices and technique used to assess temperature. None of the devices we used measure temperature directly.23 The oral and rectal electronic thermometers present an estimated rather than actual reading. TM devices detect thermal radiation from the ear canal, and after the signal is converted into a reading, providing adjusted values in core, oral, or rectal modes. We used a popular tympanic thermometer at the time of the study, but different or upgraded TM devices may yield different readings. The formulas to convert TM readings to rectal readings may vary by manufacturer, and findings might also differ when devices are upgraded or replaced by newer models. Regardless, our data indicates that detailed device performance should be provided to allow the clinician to understand the strengths and limitations for any given thermometer or setting.
Our TM readings turned out to be slightly higher than rectal readings. While the calibration of our device was checked twice in the study, it is possible it was reading higher (but still within acceptable standards) than similar model instruments produced by the same manufacturer. Previous studies indicated that TM readings could be higher or lower than rectal readings, although, on average, TM readings tended to be slightly lower.2,24 However, in support of our findings were the broadly similar mean TM-rectal differences, sensitivities, specificities, and predictive values to an adult inpatient population that included over 600 measurements.25 In addition, while our research assistants were trained and periodically observed to use the device according to manufacturer’s recommendations, there is no assurance that other users will obtain similar findings in clinical practice.
Finally, in calculating the ILR, we used relatively narrow temperature ranges and, due to the smaller sample sizes, lost power. This resulted in wider confidence intervals, especially at higher or lower values. A larger sample size would provide greater power for the study. The patients selected were also from a single ED and may not represent all patients or specific populations where it is suspected that generation of fevers is altered (eg, patients on dialysis).
CONCLUSION
In conclusion, the oral and tympanic temperature readings are not equivalent to rectal thermometry readings. Oral thermometry frequently underestimates the temperature relative to rectal readings, and TM values can either under- or overestimate the rectal temperature. Likelihood ratios help the clinician develop a more precise estimate of a rectal fever based on any given oral or TM reading and alter the posttest probabilities for a rectal fever. When likelihood ratios for a given range of oral or TM readings generate sufficient uncertainly, we recommend that rectal thermometry be used to assess for fever.
Footnotes
Supervising Section Editor: Michael Epter, DO
Submission history: Submitted May 5, 2010; Revision received October 5, 2010; Accepted February 4, 2011
Reprints available through open access at http://escholarship.org/uc/uciem_westjem
DOI: 10.5811/westjem.2011.2.1963
Address for Correspondence: Barbara Barnett, MD, NSLIJ
Healthcare System, Emergency Medicine and Internal Medicine Departments, 270-05 76th Ave, New Hyde Park, NY 11040
E-mail: bbarnett@lij.edu
Conflicts of Interest: By the WestJEM article submission agreement, all authors are required to disclose all affiliations, funding sources, and financial or management relationships that could be perceived as potential sources of bias. The authors disclosed none.
REFERENCES
1. Houdas Y, Ring EFJ. Human Body Temperature. Vol. 1982. New York, NY: Plenum Press; pp. 57–141.
2. Hooker EA, Houston H. Screening for fever in an adult emergency department: oral vs tympanic thermometry. South Med J. 1996;;89:230–233. [PubMed]
3. Jensen BN, Jeppesen LJ, Mortensen BB, et al. The superiority of rectal thermometry to oral thermometry with regard to accuracy. J Adv Nurs. 1994;;20:660–665. [PubMed]
4. Jaffe DM. What’s hot and what’s not: the gold standard for thermometry in emergency medicine.Ann Emerg Med. 1995;;25:97–99. [PubMed]
5. Jensen BN, Jensen FS, Madsen SN, et al. Accuracy of digital tympanic, oral, axillary, and rectal thermometers compared with standard rectal mercury thermometers. Eur J Surg. 2000;;166:848–851. [PubMed]
6. O’Brien DL, Rodgers IR, Jacobs I, et al. The accuracy of oral predictive and infrared emission detection tympanic thermometers in an emergency department setting. Acad Emerg Med.2000;;7:1061–1064. [PubMed]
7. Green MM, Danzl D, Praszkier H. Infrared tympanic thermography in the emergency department.J Emerg Med. 1989;;7:437–440. [PubMed]
8. Varney SM, Manthey DE, Culpepper VE, et al. A comparison of oral, tympanic, and rectal temperature measurement in the elderly. J Emerg Med. 2002;;22:53–157.
9. Klein DG, Mitchell C, Petrinec A, et al. A comparison of pulmonary artery, rectal, and tympanic membrane temperature measurement in the ICU. Heart Lung. 1993;;22:435–441. [PubMed]
10. Derlet R. Triage. Emedicine Web site. Available at:http://www.emedicine.com/emerg/topic670.htm. Accessed February 25, 2007.
11. Woodman EA, Parry SM, Simms L. Sources of unreliability in oral temperatures. Nurs Res.1967;;16:276–279.
12. Terndrup TE, Allegra JR, Kealy JA. A comparison of oral, rectal, and tympanic membrane-derived temperature changes after ingestion of liquids and smoking. Am J Emerg Med. 1989;;7:150–154. [PubMed]
13. Bland J, Altman D. Statistical methods for assessing agreement between two methods of clinical measurement. Lancet. 1986;;1:307–310. [PubMed]
14. Anagnostakis D, Matsaniotis N, Grafakos S, et al. Rectal-axillary temperature difference in febrile and afebrile infants and children. Clin Pediatr (Phila) 1993;;32:268–272. [PubMed]
15. Mackowiak PA, Worden G. Carl Reinhold August Wunderlich and the evolution of clinical thermometry. Clin Infect Dis. 1994;;18:458–467. [PubMed]
16. Perkins NJ, Schisterman EF. The inconsistency of “optimal” cut-points using two ROC based criteria. Am J Epidemiol. 2006;;163:670–675. [PMC free article] [PubMed]
17. Simel DL, Samsa GP, Matchar DB. Likelihood ratios with confidence: sample size estimation for diagnostic test studies. J Clin Epidemiol. 1991;;44:763–770. [PubMed]
18. Sonis J. How to use and interpret interval likelihood ratios. Fam Med. 1999;;31:432–437.[PubMed]
19. Brown MD, Reeves MJ. Interval likelihood ratios: another advantage for the evidence-based diagnostician. Ann Emerg Med. 2003;;42:292–297. [PubMed]
20. Giuliano KK, Scott SS, Elliot S, et al. Temperature measurement in critically ill orally intubated adults: a comparison of pulmonary artery core, tympanic, and oral methods. Crit Care Med.1999;;27:2188–2193. [PubMed]
21. Greenes DS, Fleisher GR. When body temperature changes, does rectal temperature lag? J Pediatr. 2004;;144:824–826. [PubMed]
22. O’Grady NP, Barie PS, Bartlett JG, et al. Practice guidelines for evaluating new fever in critically ill adult patients. Clin Infect Dis. 1998;;26:1042–1059. [PubMed]
23. Erickson RS. The continuing question of how best to measure body temperature. Crit Care Med.1999;;27:2307–2310. [PubMed]
24. Freed GL, Fraley JK. Lack of agreement of tympanic membrane temperature assessments with conventional methods in a private practice setting. Pediatrics. 1992;;89:384–386. [PubMed]
25. Stavem K, Saxholm H, Smith-Erichsen N. Accuracy of infrared ear thermometry in adult patients.Intensive Care Med. 1997;;23:100–105. [PubMed]