
| Author | Affiliation |
|---|---|
| Leah S. Honigman, MD, MPH | Beth Israel Deaconess Medical Center, Harvard Medical School, Department of Emergency Medicine, Boston, Massachusetts |
| Jennifer L. Wiler, MD, MBA | University of Colorado School of Medicine, Department of Emergency Medicine, Denver, Colorado |
| Sean Rooks, BA | University of Colorado School of Medicine, Department of Emergency Medicine, Denver, Colorado |
| Adit A. Ginde, MD, MPH | University of Colorado School of Medicine, Department of Emergency Medicine, Denver, Colorado |
Introduction
Methods
Results
Discussion
Limitations
Conclusion
ABSTRACT
Introduction:
Reducing non-urgent emergency department (ED) visits has been targeted as a method to produce cost savings. To better describe these visits, we sought to compare resource utilization of ED visits characterized as non-urgent at triage to immediate, emergent, or urgent (IEU) visits.
Methods:
We performed a retrospective, cross-sectional analysis of the 2006–2009 National Hospital Ambulatory Medical Care Survey. Urgency of visits was categorized using the assigned 5-level triage acuity score. We analyzed resource utilization, including diagnostic testing, treatment, and hospitalization within each acuity categorization.
Results:
From 2006–2009, 10.1% (95% confidence interval [CI], 9.2–11.2) of United States ED visits were categorized as non-urgent. Most (87.8% [95% CI, 86.3–89.2]) non-urgent visits had some diagnostic testing or treatment in the ED. Imaging was common in non-urgent visits (29.8% [95% CI, 27.8–31.8]), although not as frequent as for IEU visits (52.9% [95% CI, 51.6–54.2]). Similarly, procedures were performed less frequently for non-urgent (34.1% [95% CI, 31.8–36.4]) compared to IEU visits (56.3% [95% CI, 53.5–59.0]). Medication administration was similar between the 2 groups (80.6% [95% CI, 79.5–81.7] vs. 76.3% [95% CI, 74.7–77.8], respectively). The rate of hospital admission was 4.0% (95% CI, 3.3–4.8) vs. 19.8% (95% CI, 18.4–21.3) for IEU visits, with admission to a critical care setting for 0.5% of non-urgent visits (95% CI, 0.3–0.6) vs. 3.4% (95% CI, 3.1–3.8) of IEU visits.
Conclusions:
For most non-urgent ED visits, some diagnostic or therapeutic intervention was performed. Relatively low, but notable proportions of non-urgent ED visits were admitted to the hospital, sometimes to a critical care setting. These data call into question non-urgent ED visits being categorized as “unnecessary,” particularly in the setting of limited access to timely primary care for acute illness or injury.
INTRODUCTION
In 2009 healthcare spending accounted for 17.9% of the gross domestic product in the United States (U.S.), a number that has nearly doubled in the last 30 years.1 One of the stated goals of policymakers is to slow this growth and increase the value of healthcare spending.2,3 Some have advocated for policies that reduce “unnecessary” emergency department (ED) visits as a way to generate significant cost savings for the healthcare system.4
ED visits classified at triage as non-urgent are often considered to represent an “unnecessary” ED visit,5–7 as some argue that similar medical services could be provided at alternative sites of care for a lower cost.8,9 However, there is no standard definition of a non-urgent visit and estimates of the number of annual non-urgent ED visits vary and are dependent on the nature of categorization. Classification based on triage acuity or presenting complaint tends to predict a lower proportion of non-urgent visits, whereas retrospective assessments based on explicit criteria (i.e. final ED diagnosis or resource utilization) tend to result in a higher proportion of non-urgent visits.4–7 One systemic review found that the most commonly used definition of a non-urgent visit depended on whether care could be delayed and reported that an overall median of 32.1% of ED visits could be classified as non-urgent.5
Currently, limited data exist that describe the resource needs and disposition of patients presenting to the ED with non-urgent triage acuity.5,7 Therefore, we sought to use national data to compare resource utilization of ED visits characterized as non-urgent at triage to those visits with higher triage acuity levels. We hypothesized that although non-urgent visits would have less intense resource utilization than higher acuity visits, some non-urgent visits would involve important ED interventions, including hospitalization.
METHODS
Study Design and Setting
We performed a retrospective, cross-sectional analysis of the 2006–2009 National Hospital Ambulatory Medical Care Survey (NHAMCS). This study received institutional review board approval as an exempt protocol with a waiver of informed consent. A detailed description of the NHAMCS survey methods is provided elsewhere.10 Briefly, the NHAMCS is a stratified, multi-stage probability sample conducted annually by the National Center for Health Statistics (NCHS). Data were collected by trained NCHS personnel using a standardized data abstraction form, which were similar between the study years. During 2006–2009, a total sample of 1,932 U.S. non-institutional general and short-stay hospitals was selected for participation in NHAMCS. Of the 1,566 hospitals that were deemed eligible, 1,408 (90%) participated and a total of 140,415 ED visits were abstracted.
Study Protocol
ED visits were grouped by a 5-level triage acuity score representing immediate, emergent, urgent, semi-urgent, or non-urgent, based on the triage nurse’s judgment about the patient’s need for immediacy of evaluation, stabilization, and/or treatment. A level 1, or immediate visit, was a severe condition where any delay in medical attention would likely result in death and included a major trauma or medical problem. A level 2, or emergent visit, required evaluation within 1–14 minutes and represented a severe illness or injury requiring immediate care to combat danger to life or limb and where any delay would likely result in deterioration. A level 3, or urgent visit, was an illness or injury requiring treatment within 60 minutes. A level 4, or semi-urgent visit, could be evaluated in between 1–2 hours. A level 5, or non-urgent visit, represented conditions where a delay of up to 24 hours would make no appreciable difference to the clinical condition and where subsequent referral may be made to the appropriate alternative specialty. Triage acuity was missing for 19,024 (13.5%) visits and were therefore excluded from the primary analysis. Comparative analysis was undertaken to evaluate the excluded visits with the remainder of the charts with triage level recorded. We evaluated all remaining ED visits for clinical characteristics and resource utilization.
We analyzed the visit data in terms of patient-level characteristics including age, sex, race / ethnicity, and source of payment. We also analyzed the data by hospital facility characteristics, including U.S. region (Northeast, Midwest, South, and West), the hospital metropolitan statistical area status (urban and nonurban), and hospital ownership (nonprofit, government [non-federal], and private / for profit). Regional and metropolitan statistical area categories were included representing standardized geographical divisions as defined by the U.S. Bureau of the Census. Additionally, we analyzed visit characteristics including arrival time, day of arrival (weekend or weekday), mode of arrival, and ED length of stay.
We analyzed resource utilization, including imaging, diagnostic tests, procedures, or medications ordered. Imaging utilization was subcategorized as cross-sectional imaging, including computed tomography, magnetic resonance imaging, and ultrasound. Diagnostic tests included blood and urine tests, cardiac monitoring, electrocardiography, wound culture, and influenza test. Procedures included intravenous hydration, casting or splinting, wound repair, incision and drainage, foreign body removal, nebulizer therapy, bladder catheterization, pelvic examination, central line placement, performance of cardiopulmonary resuscitation, or endotracheal intubation. Medications included those given in the ED, as well as those prescribed at discharge. Finally, we included visit disposition, including rate of hospitalization and admission to a critical care unit, operating room, or catheterization lab.
Statistical Analysis
The primary analysis was descriptive, with 95% confidence intervals (CIs). We adhered to published checklists regarding recommendations for NHAMCS data analysis.11,12 We analyzed clinical characteristics and resource utilization within each triage categorization and compared the characteristics of non-urgent visits with those of higher acuity visits, categorized as immediate, emergent and urgent (IEU), and semi-urgent visits. We performed the statistical analyses using Stata 12.1 (StatCorp, College Station, TX) and used survey commands to adjust for the complex survey design and weight the sample to provide estimates for all U.S. ED visits.
RESULTS
In 2006–2009, 10.1% of the estimated 110 million annual U.S. ED visits included in the primary analysis were categorized as non-urgent. Table 1 shows clinical characteristics of ED visits, stratified by triage categorization. Non-urgent visits were more likely to be younger, non-Hispanic black race, have Medicaid or no insurance (self-pay), and less likely to have Medicare. Non-urgent visits were less likely to have arrived by ambulance and less likely to have a length of stay over 3 hours. Non-urgent visits were more common in hospitals located in non-urban areas and less common in the West. Time of day and day of the week were similar across triage acuity categories.
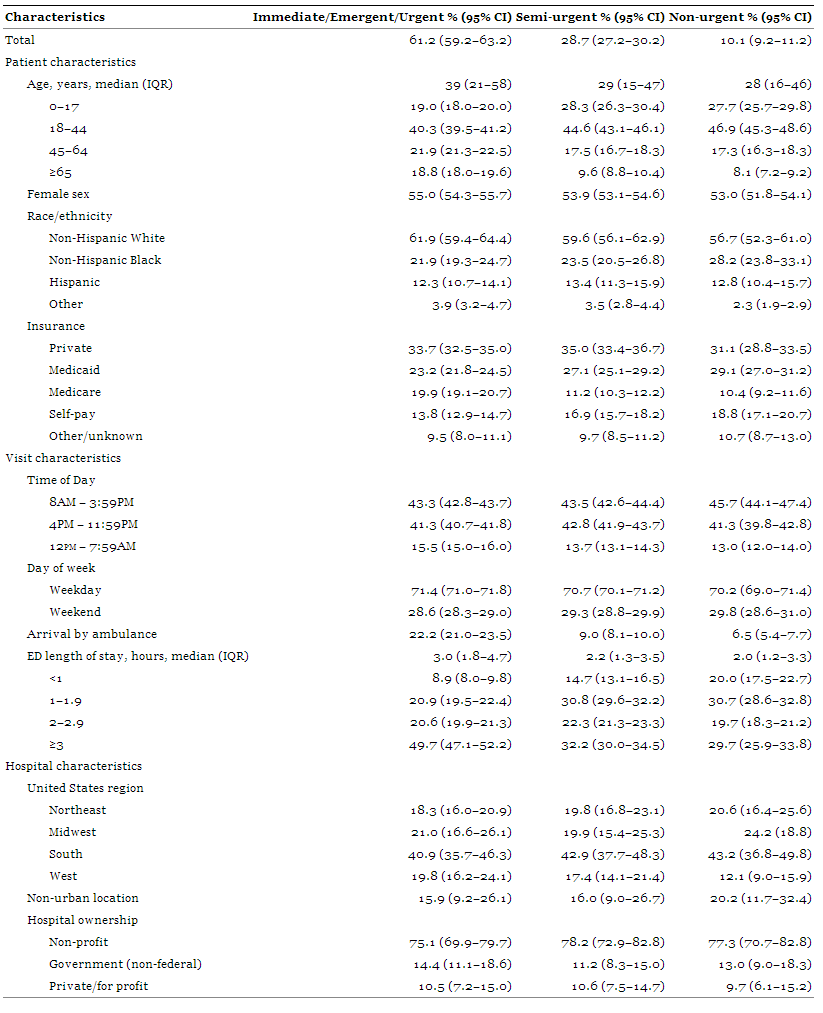
Clinical characteristics of 2006–2009 United States emergency department (ED) visits by triage acuity.
Most (87.8%) non-urgent visits had at least one intervention in the ED including imaging, diagnostic or screening services, a procedure performed, or medication administered (Table 2). Radiologic imaging was performed in 52.9% of immediate, emergent, or urgent (IEU) visits and 29.8% of non-urgent visits and 7.3% of non-urgent visits had cross-sectional imaging. Procedures were performed more frequently in IEU visits compared to non-urgent visits (56.3% versus 34.1%). Medication administration was similar between the 2 groups (80.6% versus 76.3%). Four percent of non-urgent visits were admitted to the hospital and 0.5% of visits were admitted to a critical care unit, operating room, or catheterization lab.
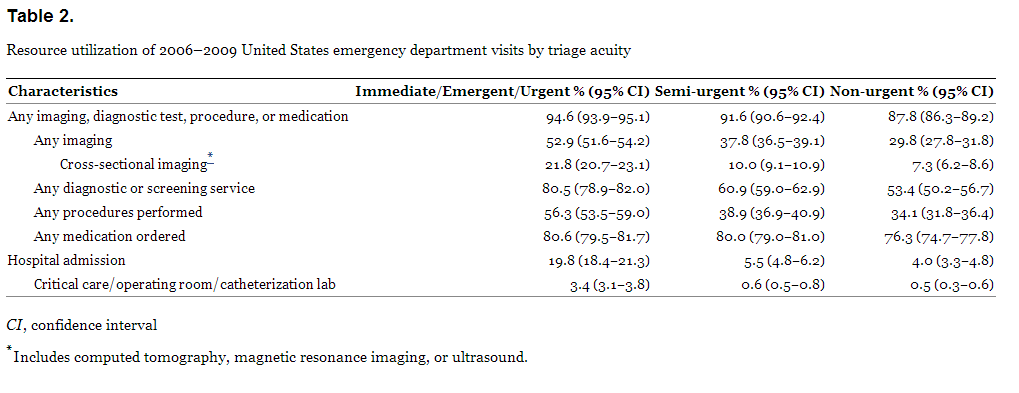
Resource utilization of 2006–2009 United States emergency department visits by triage acuity
The characteristics of non-urgent visits requiring hospital admission compared to those not admitted are presented in Table 3. Among non-urgent visits, hospital admission was more likely among older, non-Hispanic white, Medicare-insured visits, as well as those who arrived by ambulance and less likely among Medicaid and self-pay visits. Nearly all (96.8%) non-urgent visits resulting in hospitalization had some intervention in the ED.
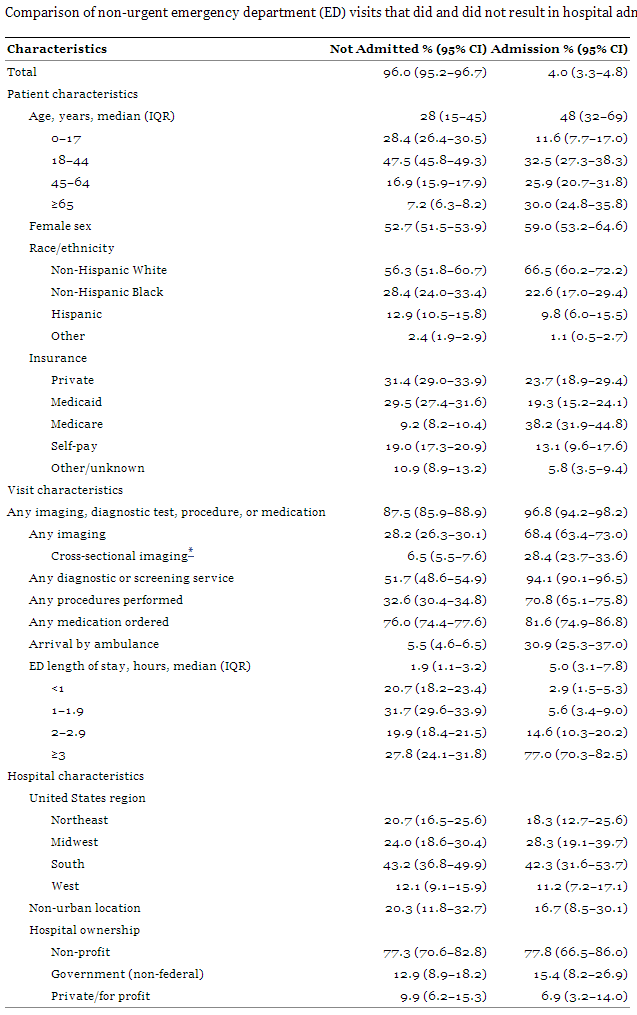
Comparison of non-urgent emergency department (ED) visits that did and did not result in hospital admission.
The ED visits with missing triage level (12.3% of weighted total ED visits) were compared to the visit and hospital characteristics of the study population (Table 4). Those visits with missing triage levels were less likely to have any imaging performed, less likely to have advanced imaging, less likely to have a procedure preformed, and less likely to have a medication ordered. Additionally they were less likely to have a length of stay greater than 3 hours and less likely to be admitted.
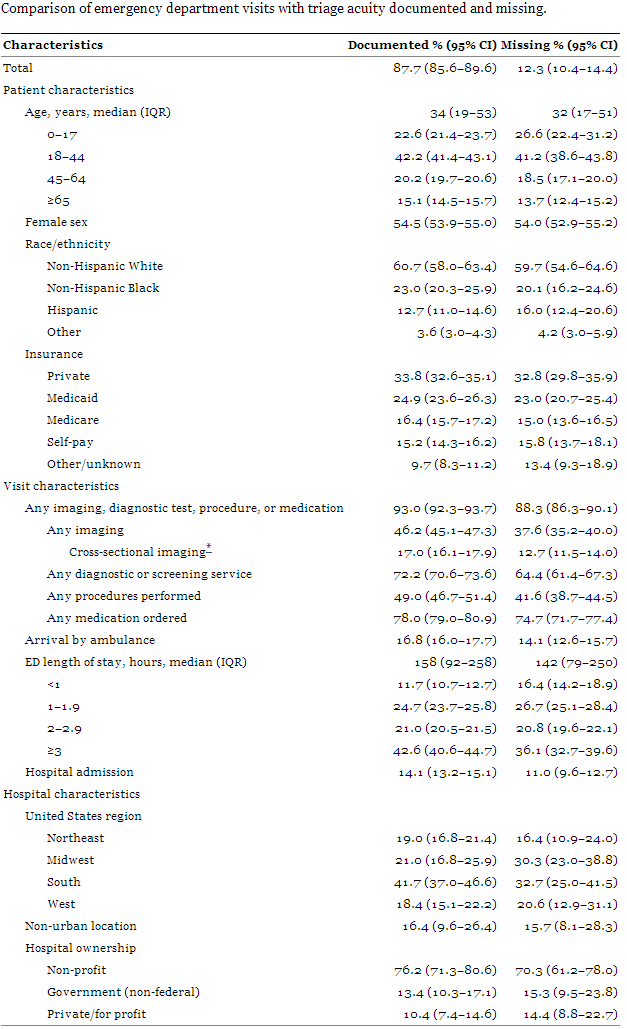
Comparison of emergency department visits with triage acuity documented and missing.
DISCUSSION
Our findings demonstrate that most ED visits categorized as non-urgent had some diagnostic or therapeutic intervention performed during the visit. Previous studies have found a lower rate of resource utilization for non-urgent patients;13–15 however, our analysis shows a high rate of interventions for even the lowest acuity visits. This suggests that healthcare services are needed even for the lowest acuity visit and calls into question the designation of a non-urgent ED visits as being “unnecessary.” We would argue that categorizing an ED visit as “unnecessary” depends not only on patient acuity but also the appropriateness of the site of service and availability of alternate sources of acute, unscheduled care.7 The ED may in fact be an appropriate site of service for a non-urgent presentation or complaint if there are no other available sites to provide timely care to the patient.
It is possible that some of these non-urgent patients could have had their medical needs met at a different site of service. Furthermore, clinical practice differences might lead to fewer interventions by primary care providers than are typically obtained in the ED. However, many barriers to accessing timely outpatient care have been associated with increased ED utilization.16,17 One study found that up to 32% of non-urgent ED patients attempted to access primary care but were unsuccessful.18 Of patients who described the ED as their usual source of care, over two thirds (68%) desired to obtain a primary care physician and nearly half (48%) tried to get one.19
We found that non-urgent ED visits were higher among Medicaid and self-pay visits. Not surprisingly, these are also the patients who have the most difficulty obtaining access to a primary care provider. Indeed, just over a quarter (25.5%) of primary physicians surveyed were not accepting new Medicaid patients and 22.8% were not accepting new patients without insurance.20 In comparison, only 5.1% of primary physicians were not accepting patients with private insurance.20 Collectively, these data suggest that although a patient may have a non-urgent condition that could be evaluated in up to 24 hours, barriers to care may predispose them to use the ED for non-urgent care.
Our analysis showed a similar rate of non-urgent visits across times of day and days of the week, with no surge of visits in off hours or on weekends. Furthermore, our results demonstrate that non-urgent ED visits occur even at times when health care clinics are open. Patients who present with non-urgent conditions often do so because they perceive a need for immediate medical attention, have been referred by their primary physician, or simply because the ED provides easier accessibility.18,21,22 Of patients who report having a primary physician, 47% noted the ease of obtaining unscheduled care in the ED as a reason for their choice of site of service.21 The barriers to obtaining timely care are also noted among primary physicians, 73.4% of whom stated that a lack of timely reports from other physicians or labs limited their ability to provide high quality care.20 Many diagnostic interventions are not easily available in the outpatient setting. The ED offers a unique set of services and diagnostic capabilities in a time-efficient manner, which can expedite medical management for some patients. While the appropriateness of this clinical practice is debatable, it reflects the reality for many patient populations.
Some policymakers have advocated for the reduction of “unnecessary” ED visits as a means to generate significant savings in the healthcare system.4 However, the estimates of potential costs associated with treatment of non-urgent visits in the ED as opposed to other sites of care are variable and the true cost-savings from a reduction in non-urgent ED visits may only be modest.9 Some have reported that ED costs for minor health problems or non-urgent visits are as much as two to three times higher than care provided in other sites of service.23 Yet others have found the cost for providing non-urgent care in the ED are relatively comparable to that provided in the outpatient settings.8 Furthermore, previous studies comparing ED and outpatient costs of care only consider a single visit and do not include ancillary services in cost-value calculations,8,24 which limit the interpretability of the comparison. In addition, the relative use of diagnostic tests, procedures, and medications in the outpatient setting, compared to the ED setting, for a comparable presentation is unknown. Thus, the high resource utilization in non-urgent ED visits reported in our study should prompt further analysis and comparison of the true costs associated with ED and outpatient care.
A small, but not insignificant number of non-urgent visits were admitted, sometimes in critical care settings. Prior single-center studies have reported admission rates up to 6.2% in non-urgent ED populations.18,25,26 Similarly, we found an overall admission rate of 4.0% for non-urgent ED visits nationally. This highlights the limitations and difficulty with using triage acuity systems as a reliable surrogate marker to predict patient acuity and disposition including hospitalization.
LIMITATIONS
Data from the NHAMCS are subject to the limitations of general survey research, with possible errors in data collection and coding. In particular, data abstractors may have recorded incorrect or incomplete data on triage acuity levels, the type of ED services provided, and patient disposition. A recent NHAMCS study on the disposition of intubated patients in the ED has highlighted errors in data coding27 and suggests that this may result in undercounting of ED interventions.12 However, NHAMCS data have been used widely to report the epidemiology of a variety of characteristics and conditions, using rigorous methodology.28
We did find that a moderate number of charts had missing data, which can be attributed to multiple factors including the lack of nursing triage systems at some hospitals, as well as general errors in coding. We found that the characteristics of the missing visits were generally similar to those charts that were included in analysis. There was a lower rate of resource utilization and a lower proportion of admissions among the visits with missing triage acuity. It is possible that these could represent more lower acuity visits, which if included in primary analysis would actually decrease the resource utilization for non-urgent visits. However, there is no explicit reason to suspect those charts with missing triage acuity would preferentially be from less acute visits. Therefore, all triage categories would be affected similarly and the missing charts are unlikely to represent a major source of bias.
Finally, this analysis relies on triage classification of acuity, which may be subject to interpretation and the expertise of the classifying practitioner and is not standardized across hospital EDs. There are multiple different methodologies for classifying level of acuity but there is no clear evidence the level would be skewed in one direction and therefore should not markedly influence the results.
CONCLUSION
Most non-urgent ED visits had some diagnostic or therapeutic intervention. Relatively low, but notable, proportions of non-urgent ED visits had advanced imaging or were admitted to the hospital, sometimes to a critical care setting. These results call into question non-urgent ED visits being broadly classified as “unnecessary,” particularly in the setting of limited access to timely primary care for acute illness or injury.
Footnotes
Address for Correspondence: Adit A. Ginde, MD, MPH. Department of Emergency Medicine, University of Colorado School of Medicine, 12401 E. 17th Avenue, B-215, Aurora, CO 80045. Email: adit. ginde@ucdenver.edu. 11 / 2013; 14:609 – 616
Submission history: Revision received February 3, 2013; Submitted March 4, 2013; Accepted May 2, 2013
Conflicts of Interest: By the WestJEM article submission agreement, all authors are required to disclose all affiliations, funding sources and financial or management relationships that could be perceived as potential sources of bias. The authors disclosed none.
REFERENCES
1. Centers for Medicare & Medicaid Services, U.S. Department of Department of Health and Human Services National health expenditure data. Available at:http://www.cms.gov/NationalHealthExpendData/ Accessed December 18, 2012.
2. Goldsmith J Accountable care organizations: the case for flexible partnerships between health plans and providers. Health Aff. 2011; 30:32-40
3. July 2009 update of the hospital outpatient prospective payment system. . 2009;
4. Cunningham PJ, Clancy CM, Cohen JW The use of hospital emergency departments for nonurgent health problems: a national perspective. Med Care Res Rev. 1995; 52:453-474
5. Durand AC, Gentile S, Devictor B ED patients: how nonurgent are they? systematic review of the emergency medicine literature. Am J Emerg Med. 2011; 29:333-345
6. Richardson LD, Hwang U Access to care: a review of the emergency medicine literature. Acad Emerg Med. 2001; 8:1030-1036
7. Mistry RD, Brousseau DC, Alessandrini EA Urgency classification methods for emergency department visits: do they measure up?. Pediatr Emerg Care. 2008; 24:870-874
8. Williams R The costs of visits to emergency departments. N Engl J Med. 1996; 334:642-646
9. Simonet D Cost reduction strategies for emergency services: insurance role, practice changes and patients accountability. Health Care Anal. 2008; 17:1-19
10. Centers for Disease Control and Prevention Ambulatory health care data. Available at:http://www.cdc.gov/nchs/ahcd.htm Accessed December 18, 2012.
11. McCaig LF, Burt CW Understanding and interpreting the national hospital ambulatory medical care survey: key questions and answers. Ann Emerg Med. 2012; 60:716-721
12. Cooper RJ NHAMCS: Does it hold up to scrutiny?. Ann Emerg Med. 2012; 60:722-725
13. Storm-Versloot MN, Ubbink DT, Kappelhof J Comparison of an informally structured triage system, the emergency severity index, and the manchester triage system to distinguish patient priority in the emergency department. Acad Emerg Med. 2011; 18:822-829
14. Wuerz RC, Milne LW, Eitel DR Reliability and validity of a new five-level triage instrument. Acad Emerg Med. 2000; 7:236-242
15. Billings J, Parikh N, Mijanovich T Emergency department use in New York City: a substitute for primary care?. Issue brief (Commonw Fund). 2000; 433:1-5
16. Cheung PT, Wiler JL, Lowe RA National study of barriers to timely primary care and emergency department utilization among Medicaid beneficiaries. Ann Emerg Med. 2012; 60:4-10
17. Cheung PT, Wiler JL, Ginde AA Changes in barriers to primary care and emergency department utilization. Arch Intern Med. 2011; 171:1397-1399
18. Afilalo J, Marinovich A, Afilalo M Nonurgent emergency department patient characteristics and barriers to primary care. Acad Emerg Med. 2004; 11:1302-1310
19. O’Brien G, Stein M, Zierler S Use of the ED as a regular source of care: associated factors beyond lack of health insurance. Ann Emerg Med. 1997; 30:286-291
20. Center for Studying Health System Change HSC data online. Available at:http://hschange.org/index.cgi?file=cts1. Accessed on December 18, 2012.
21. Northington WE, Brice JH, Zou B Use of an emergency department by nonurgent patients. Am J Emerg Med. 2005; 23:131-137
22. Baker DW, Stevens CD, Brook RH Determinants of emergency department use by ambulatory patients at an urban public hospital. Ann Emerg Med. 1995; 25:311-316
23. Baker LC, Baker LS Excess cost of emergency department visits for nonurgent care. Health Aff. 1994; 13:162-171
24. Bamezai A, Melnick G, Nawathe A The cost of an emergency department visit and its relationship to emergency department volume. Ann Emerg Med. 2005; 45:483-490
25. Tanabe P, Gimbel R, Yarnold PR Reliability and validity of scores on the emergency severity index version 3. Acad Emerg Med. 2004; 11:59-65
26. van der Wulp I, Sturms LM, Schrijvers AJP An observational study of patients triaged in category 5 of the emergency severity index. Eur J Emerg Med. 2010; 17:208-213
27. Green SM Congruence of disposition after emergency department intubation in the national hospital ambulatory medical care survey. Ann Emerg Med. ;
28. McCaig LF, McLemore T Plan and operation of the National Hospital Ambulatory Medical Survey. Series 1: programs and collection procedures. Vital Health Stat. 1994; :1-78