
| Author | Affiliation |
|---|---|
| Scott Krall, MD, MBA | Texas A&M University, Corpus Christi |
| Robert E. O’Connor, MD, MPH | University of Virginia Health System |
| Lisa Maercks, MD | St. Francis Hospital, Wilmington, Delaware |
ABSTRACT
Introduction:
Determine the effect that increased medical surgical (med/surg) bed occupancy has on the time interval from admission order to arrival in the bed for the patients admitted from the emergency department (ED).
Methods:
This retrospective observational study compares the total hospital bed occupancy rate and the medical surgical inpatient bed occupancy rate to daily averages for the time interval from admission order (patient posting for admission) to the patient’s arrival in the inpatient bed. Medical surgical inpatient bed occupancy of 92% was chosen because beyond that rate we observed more frequent extended daily transfer times. The data is from a single large tertiary care institute with 590 beds and an annual ED census of 80,000.
Results:
Group 1 includes 38 days with (med/surg) inpatient bed occupancy rate of less than 92%, with an average ED daily wait of 2.5 hrs (95% confidence interval 2.23–2.96) for transfer from the ED to the appropriate hospital bed. Group 2 includes 68 days with med/surg census greater than 92% with an average ED daily wait of 4.1 hours (95% confidence interval 3.7–4.5). Minimum daily average for the two groups was 1.2 hrs and 1.3 hrs, respectively. The maximum average was 5.6 hrs for group 1 and 8.6 hrs for group 2. Comparison of group 1 to 2 for wait time to hospital bed yielded p <0.01. Total reported hospital occupied capacity shows a correlation coefficient of 0.16 to transfer time interval, which indicates a weak relationship between total occupancy and transfer time into the hospital. Med/surg occupancy, the beds typically used by ED patients, has a 0.62 correlation coefficient for a moderately strong relationship.
Conclusion:
Med/surg bed occupancy has a better correlation to extended transfer times, and occupancy over 92% at 5 AM in our institution corresponds to an increased frequency of extended transfer times from the ED. The process of ED evaluation, hospital admission, and subsequent transfer into the hospital are all complex processes. This study begins to demonstrate one variable, med/surg occupancy, as one of the intervals that can be followed to evaluate the process of ED admission and hospital flow.
INTRODUCTION
Emergency departments (EDs) nationwide are encountering extended delays in evaluating patients.1–3 Solutions have included attempts to improve the ED patient evaluation process, additional ED beds, additional hospital beds, and improved patient stay times through earlier discharges. However, little research has been done to evaluate the effect of hospital capacity on ED patient length of stay (LOS). In the 1990s managed care focused on controlling hospital LOS, decreasing ED visits, and moving patient care into the outpatient and home care settings. Delaware Healthcare Association data from 1997–2001 showed a resultant 6.5% increase in hospital discharges and a 13% increase in emergency visits. Medicare had a 1.2% increase in hospital LOS, and private carriers had a 7.8% increase in LOS.4 Hospitals anticipating managed care’s increased efficiency and decreased utilization did little in expanding inpatient and emergency care services during the 1990s, instead striving to increase efficiency by increasing occupied capacity in the hospital.
Nationwide, metropolitan areas with high health maintenance organization (HMO) penetration showed a greater reduction in beds per capita than areas with less HMO penetration.5 Current attempts to optimize beds have resulted in 85–100% hospital occupancy and the subsequent difficulty transferring patients from the ED to inpatient beds.6 Modeling of the dynamics for such a hospital system supports the occurrence of bed shortages and crisis at these occupancy levels.6 In the Toronto area, for example, area hospitals closed 30% (2,890) of their acute care beds through 1997, which resulted in minimal crowding. When 943 additional beds were closed between 1998 and 2000 and occupancy rates exceeded 90% with a peak at 96% for acute care beds in the region, ED crowding became a frequent occurrence.7
We hypothesized that hospital occupancy has an effect on ED admission transfer time. We compared hospital occupancy with the time interval from notification of an ED admission to eventual arrival in the inpatient bed. The study allowed us to see what level of occupancy starts to impact ED patient transfer times.
METHODS
Data for this observational study were drawn from several manual databases used in tracking patients presenting to the ED on a daily basis. Over a four-month period, we tracked ED length of stay, hospital occupancy, and transfer times from the time the patient was posted in the ED to his or her arrival in the hospital bed. The study setting was a 590-bed tertiary care referral center with an annual ED census of 80,000. All patients presenting to the ED were tracked. We obtained the time interval from patient posting for admission (decision by the emergency physician to admit with approval from the admitting attending) in the ED to the time the patient arrived to the appropriate hospital bed (“ED transfer wait time” or transfer time interval.)
The hospital tracked the bed occupancy for publication on a daily institution report card. The hospital occupancy was determined at 5 AM daily and entered into a Microsoft Corporation, Excel 2000 database based on manual bed count. The time was chosen secondary to convenience and represented a stable hospital-census time. Medical surgical (med/surg) occupancy was determined at 5 AM using the same Excel database. Beds not used routinely for ED admission, such as pediatric and obstetrical beds, were removed for a total of 480 med/surg beds. The data was collected from December 2000 to March 2001. The data were analyzed using SPSS inc., version 10, Chicago Illinois, statistical program. Tables incorporate summary statistics, using average daily time intervals and 5 AM occupancy rates. We arbitrarily divided the two occupancy data groups at 92% occupancy. We used Student’s t-test to compare numerical data and linear regression to determine the relationship of the published total hospital occupancy and med/surg occupancy to the “ED transfer wait time” or transfer time interval.
RESULTS
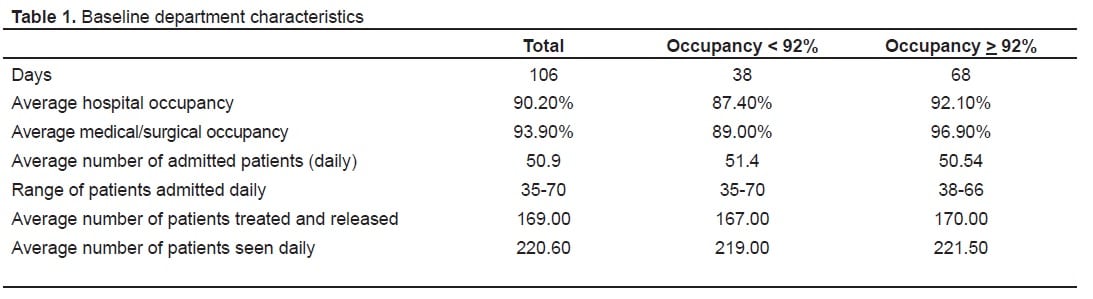
The analysis was done on a total of 106 days (Table 1), during which 38 days had med/surg bed occupancy <92% (Group 1), 68 days had ≥92% (Group 2), and the remaining 15 days had incomplete time intervals. The baseline data shows an expected lower average occupancy in Group 1 compared to Group 2. Patient census for the department as well as the number of admissions did not vary between groups (Table 1). Student’s t-test analysis showed no statistically significant difference between daily ED census, patients treated and released, or admitted patients. ED staffing did not vary by day of the week. There was an increase of five patients seen on the weekends, but three fewer patients were admitted.
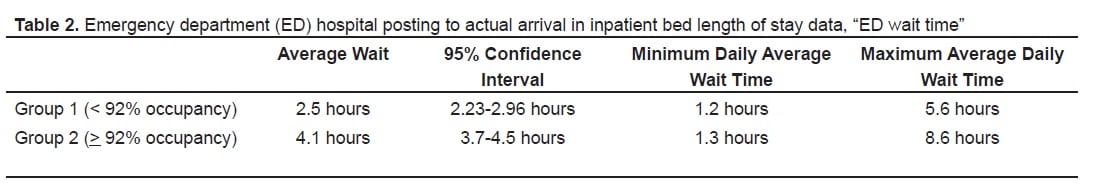
Group 1 had an average transfer wait time interval of 2.5 hrs (95% confidence interval (CI) 2.23–2.96) to be transferred from the ED to the floor. Group 2 had an average transfer wait time interval of 4.1 hours (95% CI 3.7–4.5). The minimum transfer wait time for the two groups was 1.2 and 1.3 hours, supporting the possibility of more efficient patient transfer. The maximum transfer wait time was 5.6 hours for Group 1 and 8.6 hours for Group 2, demonstrating the wide range in average daily times for transfer.
Comparison of Group 1 and Group 2 for wait time to hospital bed by Student’s t-test yielded p<0.01. Overall hospital occupancy linear regression analysis showed a correlation coefficient of 0.16, indicating a weak relationship for total inpatient occupancy to transfer wait time, versus 0.62 for a moderately strong relationship to med/surg bed occupancy.
DISCUSSION
Dangerous ED crowding nationally has resulted in numerous attempts to increase the ED flow process. Departmental efficiency has some effect on LOS. Hoffenberg et al.8 evaluated 291 EDs, shared the best-demonstrated processes and showed an improvement of 29 minutes in LOS for the slowest one-third of the hospitals. A study comparing time intervals showed that when the department had an ED bed immediately available there was a 36-minute decrease in LOS.9 The study also showed a significant decrease in the time to initial physician evaluation of 29 minutes when an ED bed was immediately available. Schneider et al.10 conducted a descriptive analysis of overcrowding in Rochester, New York, based on ED-only strategies versus system wide strategies and showed little effect on ED crowding from intramural ED strategies versus system wide strategies. In this same study, efforts to provide inpatient resources, float nurses, and a transition team to care for patient waiting for beds in the ED was successful in helping the crowding.
Our data demonstrate significant delays in effective transfer of patients from ED beds to inpatient beds when med/surg inpatient areas exceed 92% occupancy. Kyriacou et al.9showed delays in ED patient evaluation from lack of inpatient bed availability. Beth Israel Deaconess Medical Center in Boston, in combination with 150 hospitals in New York, found that using target occupancy levels as a determinant of bed capacity was inadequate and lead to excessive delays for beds.11
Our study shows an additional 100-minute delay in transferring patients from the ED if 5 AM med/surg bed occupancy is greater than 92%, representing the effect inpatient bed occupancy had on the ED. The med/surg bed occupancy information at 5 AM can be used to establish available capacity for that day and allow for earlier implementations of processes to increase efficient inpatient flow or capacity increases.
LIMITATIONS
The hospital occupancy data is collected at 5 AM and based on a single institution, so it does not represent ongoing crowding in the ED. The actual delays in transfers are not individually evaluated; the data represent a broad measure of bed availability. The study is retrospective and has the associated potential errors, including incomplete data collection on 14% of the days. The data are older but still represent one of the major outside effects on ED crowding. The 92% med/surg occupancy represents the occupancy level where we start to see an increased frequency of transfer delays. Each hospital will have variation in process and hospital efficiency and will need to determine their best occupancy for anticipated delays in inpatient flow. It remains unclear the effect patient management systems, communication and other factors can have on the point at which med/surg bed occupancy will cause delays in transfer from the ED.
The objective of the study was to determine the effect increasing hospital occupancy had upon ED transfer time. The data were analyzed after collection to determine the med/surg occupancy at which we started to see increased frequency of significant delays in the throughput system. The 92% occupancy rate was chosen based on the point prior to consistently seeing increased delay in transfer times, administratively representing the optimal point to start initiating focused protocols for intervention in the admission process. The post hoc analysis potentially skews the conclusions, but the results match the logical expectation of increasing occupancy and provide a framework for looking at your own hospital admission system.
CONCLUSION
In our institution a predictor of flow for admitted patients from the ED was the occupancy of beds predominantly used for the ED (med/surg beds). Our study showed a 100-minute average daily increase in transfer time when the 5 AM med/surg occupancy was over 92%. Med/Surg bed occupancy at 5 AM can give hospital administration the opportunity to plan for interventions earlier in the admission process to keep ED patient flow optimal.
Future Directions
Best predictions available show that the increasing ED census is a predictor of increased numbers of patients needing admission, as shown in Lambe et al.12 Emergency care will require paradigmatic shift ideas, as well as efficient staff, ancillary service, and space utilization to care for the increasing numbers of patients. At the same time, a similar focus on increasing efficiencies in the hospital admission and discharge process is needed. Future process evaluation and analysis of hospital admissions times and activity within the hospital around admission and discharge can be used to understand the impact on ED crowding and delays in admission. This can be used to evaluate changes in staffing and to focus on inpatient process and the effect on the transfer time from the ED. Future proposals include the early morning focus from the staff providing care to the patient and earlier discharge planning on the patients being discharged to make beds available earlier. With the measurements of these intervals we can see the effect on the admission wait time.
Footnotes
Supervising Section Editor: Jeffrey Druck, MD
Submission history: Submitted December 04, 2007; Revision Received November 20, 2008; Accepted December 01, 2008
Full text available through open access at http://escholarship.org/uc/uciem_westjem
Address for Correspondence: Scott P. Krall MD, MBA. Assistant Professor, Texas A&M College of Medicine, Department of Emergency Medicine, 2606 Hospital Blvd, Corpus Christi, Texas 78405
Email: Scott.krall@christushealth.org
Conflicts of Interest: By the WestJEM article submission agreement, all authors are required to disclose all affiliations, funding sources, and financial or management relationships that could be perceived as potential sources of bias. The authors disclosed none.
REFERENCES
1. Shute N, Marcus MB. Code blue crisis in the ER. Turning away patients. Long delays. A surefire recipe for disaster. US New & World Report. 2001;131:54–61.
2. Richards JR, Navarro ML, Derlet RW. Survey of directors of emergency departments in California on overcrowding. Western Journal of Medicine. 2000;172:385–8.[PMC free article] [PubMed]
3. Derlet R, Richards J, Kravitz R. Frequent overcrowding in U.S. emergency departments. Acad Emerg Med. 2001;8:151–5. [PubMed]
4. Delaware Healthcare Association. Statistics and reports. Dover, Delaware. Available at:www.deha.org/navbar.htm.
5. Worzala C, Zhang N, Anderson GF. The effect of HMOs on hospital capacity. Managed Care Interface. 2000;13:51–61. [PubMed]
6. Bagust A, Place M, Posnett JW. Dynamics of bed use in accommodating emergency admissions: stochastic simulation model. BMJ. 1999;319:155–8. [PMC free article][PubMed]
7. Schull MJ, Szalai J, Schwartz B, Remdelmeier DA. Emergency department overcrowding following systematic hospital restructuring: trends at twenty hospitals over ten years. Acad Emerg Med. 2001;8:1037–1043. [PubMed]
8. Hoffenberg S, Hill BH, Houry D. Does sharing process differences reduce patient length of stay in the emergency department? Acad Emerg Med. 2001;8:578.
9. Kyriacou DN, Ricketts V, Dyne PL, et al. A 5-year time study analysis of emergency department patient care efficiency. Ann Emerg Med. 1999;34:326–335. [PubMed]
10. Schneider S, Zwemer F, Doniger A, et al. Rochester, New York: A decade of emergency department overcrowding. Acad Emerg Med. 2001;8:1044–50. [PubMed]
11. Green LV, Nguyen V. Strategies for cutting hospital beds: impact on patient services.Health Services Research. 2001;36:421–424. [PMC free article] [PubMed]
12. Lambe S, Washington DL, Fink A, et al. Trends in the use and capacity of California’s emergency departments, 1990–1999. Ann Emerg Med. 2002;39:389–39. [PubMed]