| Author | Affiliation |
|---|---|
| Shahram Lotfipour, MD, MPH | University of California, Irvine, Department of Emergency Medicine, Orange, California |
| Rockan Sayegh, MA | University of California, Irvine, Department of Emergency Medicine, Orange, California |
| Bharath Chakravarthy, MD, MPH | University of California, Irvine, School of Medicine, Orange, California |
| Wirachin Hoonpongsimanont, MD | University of California, Irvine, Department of Emergency Medicine, Orange, California |
| Craig L. Anderson, PhD, MPH | University of California, Irvine, Department of Emergency Medicine, Orange, California |
| J. Christian Fox, MD | University of California, Irvine, Department of Emergency Medicine, Orange, California |
| Federico E. Vaca, MD, MPH | Yale University, Department of Emergency Medicine, New Haven, Connecticut |
ABSTRACT
Introduction:
Injuries and fatalities in adult drivers 18–65 years of age have decreased in recent years due to safer vehicles, enhanced medical policies, and implementation of injury prevention policies. However, adult drivers over 65 years of age are continuing to suffer from motor vehicle collision-related injuries and fatalities at a more constant rate. A number of physiological factors contribute to the deterioration in visual acuity, slower reaction speeds, and decreased awareness in older drivers. The objective of this study was to examine injury severity and fatality rates in older drivers compared to their younger counterparts in Orange County, California.
Methods:
This study used the Statewide Integrated Traffic Record System data for Orange County for the years 1998–2007. Drivers were categorized into 4 age groups: 25–64, 65–74, 75–84, and older than 85 years of age. Injury severity was assessed by the investigating officer.
Results:
Of the 197,814 drivers involved in motor vehicle collisions, 178,481 (90.2%) were in the 25–64 age group; 11,397 (5.8%) were 65–74; 6,592 (3.3%) were 75–84; and 1,344 drivers (0.7%) were over 85. Those aged 25–64 had the lowest fatality rate per 100,000 people, 2.5, whereas those 75–84 had the highest fatality rate, 4.9. The percent of crashes involving a left turn increased with age, and the percent that were stopped in the road decreases with age. Change in injury collision involvement ratio in the 3 younger age groups decreased by 26% to 32%, but decreased by 18% among drivers aged 85 years and older.
Conclusion:
The decrease in collision fatalities was greater in the 25–64-year-old group compared to the older adult population. This disparity highlights the need for further injury prevention efforts for older drivers.
INTRODUCTION
In 2009, the US Census Bureau reported that, by the year 2050, the population of adults 65 years of age and older will more than double (39 million to 89 million).1 Based on the US census between 1990 and 2000, California experienced a 15% increase in residents over age 65 and a 42% increase in those over age 85. In 2000, in the United States, Orange County had the eighth largest population of older adults (over 65) and was 10th in population of older adults over 85.2 As a result of this population growth, the number of licensed older drivers continues to be on the rise. In 2004, nearly 2.7 million licensed drivers in the US were older adults.3 The Centers for Disease Control and Prevention reported that, in 2007, for those 65 and older, unintentional injury was the ninth leading cause of mortality with over 38,000 deaths. Motor vehicle collisions (MVC) made up a little over 17% of those deaths; only falls account for a greater number of unintentional deaths for this age group.4 According to the National Highway Traffic Safety Administration, in 2008, drivers 65 and older accounted for 14% of all traffic fatalities.5 Many federal and state government agencies, including traffic safety organizations, have tried to understand and reduce the risk associated with MVCs in older drivers; however, the death rate from MVCs in older drivers is decreasing more slowly compared to other age groups. In the United States between 1990–2000, the death rate in older adults decreased from 23.1 to 21.4 (7%) deaths per 100,000 people, compared to a drop from 34.1 to 26.9 (21%) in the 15–24 age group, and from 23.6 to 17.3 (27%) in the 25–34 age group.6Although the fatality rate decreased in older adult drivers, the fact that younger drivers drive more miles per year and show a greater decrease may present an even greater problem for the older adult age group. This suggests that MVC-related deaths among the older adult age group may be less responsive to improvements in traffic safety, including improved automobiles, better street lighting and traffic signals to enhance visibility, better enforcement of traffic and seatbelt laws, and efforts against impaired driving. In this study, we attempt to analyze the impact these safety strategies have had on older drivers by investigating older adult MVC incidence and severity in Orange County, California, from 1998–2007.
METHODS
This study used the Statewide Integrated Traffic Record System (SWITRS) data for Orange County, California (urban-suburban mix with population 2.7–3.0 million), for the years 1998–2007. The SWITRS accumulates data for vehicle traffic collisions occurring on public roadways in California. The Information Management Division of the California Highway Patrol maintains SWITRS.
We excluded drivers aged 24 and younger, those with no reported age, and collisions with no reported injuries.7 The remaining drivers were categorized into 4 age groups: working age (25–64 years), and 3 categories of older drivers, using conventional vital statistics categories (65–74, 75–84, and older than 85). The severity of each injury was assigned by the investigating police officer for 1 of 4 categories: fatality (occurring within 30 days), severe injury (including broken or dislocated limbs, severe lacerations, or unconsciousness), other visible injury (including bruises and abrasions), and complaint of pain (which is interpreted to include confusion, limping, and claims of injury).8 These categories do not necessarily correspond to medically-assessed severity.9,10
We defined the injury collision involvement ratio as the number of collisions divided by estimated population and the driver fatality ratios as the number of driver deaths divided by the estimated population. Data was taken from MVCs occurring in Orange County, California. We calculated injury collision involvement ratios and driver fatality ratios by age and sex using population estimates from the California Department of Finance and calculated confidence intervals (CI) for the ratios using the log normal approximation to the Poisson distribution.11,12 These ratios approximate rates if the number of Orange County drivers involved in collisions outside of Orange County is equal to the number of non-Orange County drivers involved in collisions in Orange County and if the population is equal to the number of drivers. Trends in ratios were assessed by variance-weighted least squares regression using Stata (version 10.1, Stata Corporation, College Station, Texas).
Due to the use of a publicly available dataset, this project was exempt from the institutional review board.
RESULTS
Age and Gender
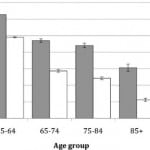
Of the 197,814 drivers involved in MVCs, 178,481 (90.2%) were in the 25–64 age group; 11,397 (5.8%) were 65–74; 6,592 (3.3%) were 75–84; and 1,344 drivers (0.7%) were over 85. Excluding 151 (0.08%) drivers where sex was unknown, the injury collision involvement ratios by age and sex are shown in Figure 1. Collision involvement decreased with age (P < 0.0005). Female drivers had a lower injury collision involvement ratio, and their ratio decreased more steeply with age than that of males (P < 0.0005).
Figure 1. Injury collision involvement ratio per 100,000 people annually by age group and sex, Orange County, California, 1998–2007.
Severity of Injury
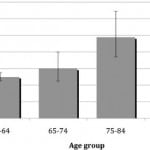
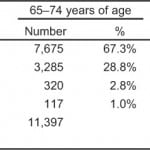
Figure 2 shows the driver fatality ratios per 100,000 people in each age group. The trend across age groups was the opposite of the trend for the injury collision involvement shown in Figure 1. Those aged 25–64 had the lowest fatality ratio per 100,000 people, 2.5 (95% CI was 2.3–2.7), whereas those 75– 84 had the highest fatality ratio, 4.9 (95% CI was 3.7–6.4), despite having a lower collision involvement. As shown in the Table, of the 178,481 collisions in those aged 25–64, complaint of pain was the most common category of injury (70.1%). The percentage of collisions classified as complaint of pain deceased with increasing age, while the percentage of collisions that involved other visible injuries, severe injuries, and fatalities increased with age.
Figure 2.Driver fatality ratio per 100,000 people annually by age group, Orange County, California, 1998–2007.
Table. Highest degree of injury by driver age, Orange County, California, 1998–2007.
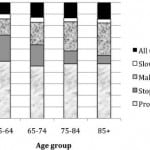
The type of movement preceding collision for 149,769 nonfreeway collisions (76% of the total) is shown in Figure 3. The percent of collisions involving a left turn increased progressively with each age group, and the percent that were stopped in the road decreased with each age group. Presumably, young people stop in the road, and older adults avoid heavy traffic.
Figure 3.Type of movement preceding collision in nonfreeway collisions by driver age, Orange County, California, 1998–2007.
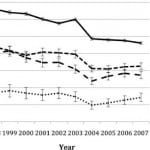
Figure 4 shows the change in injury collision involvement ratio over the study period for the 4 age groups. The injury collision involvement ratio decreased by 26% to 32% in the 3 younger age groups, but the ratio decreased by only 18% among drivers aged 85 years and older (P value for difference by age group < 0.0005).
DISCUSSION
Age and Gender
Biophysical changes, human factors, and socioenvironmental factors contribute to older drivers having higher risks of an MVC. Age-related declines in their useful field of view, dynamic visual acuity, lateral motion detection, cognition, hearing, trunk/neck mobility, polypharmacy factors, and psychomotor function contribute to their high collision rates.13–15
However, older drivers do compensate for some of their impairments and adjust their driving to maintain safety.16 Our study demonstrated a decreased injury collision involvement ratio per 100,000 people by age, but McGwin et al reported a collision rate per million miles driven that was increasing by age.17 This contradiction may be explained by the difference in denominators. There are 3 conventional choices for injury-collision rate denominators: population, the number of older adults with valid driver’s licenses, and vehicular miles driven. Miles driven (the denominator used by McGwin et al) is probably the most accurate denominator to evaluate collision rates since approximately two thirds of older adults have a valid driver’s license, and they also drive less than middle-aged drivers. Male drivers have greater potential for risk-taking behaviors, such as alcohol-impaired driving and speeding, which may explain the higher collision involvement rate than that of female drivers.18,19
We found decreases in the injury collision involvement ratio for all age groups. However, the decrease was smaller for those aged 85 years and older than for younger drivers. Changes in motor vehicle crash protection may not be as effective for the oldest drivers.
Older Driver Movements and Collisions
Older drivers had proportionally more collisions involving left turns. This may be related to perceptual and cognitive difficulties in assessing the movements of other vehicles. On the other hand, older drivers had fewer collisions while stopped in the road. This may be related to less commuting and driving in congested traffic.
Severity of Injury
Studies in Maryland and Western Australia have shown that drivers became more fragile as they aged, especially drivers over 80.20,21 Our study found older drivers had a higher fatality ratio per 100,000 people than middle-aged drivers. Cook et al also found that older drivers were more likely to be killed in MVCs than younger drivers.21 Furthermore, some studies found older adults were more likely to be hospitalized, their hospital stays were longer, and their mortality rates were higher than younger patients.22,23 With regards to prevention, the presence of passengers has been shown to decrease risk of motor vehicle collisions. Rueda-Domingoa et al found that the presence of passengers with drivers over the age of 65 years reduced the risk of motor vehicle collisions.24 This relationship could be further investigated to assist in advising older adults on driving safety.
Older Adult Fragility
The current study demonstrates that older adults are more prone to injury and have lower injury tolerance thresholds in MVCs. Furthermore, physiological and pathological changes in this group increase their morbidity and mortality when involved in MVCs. While the reasons for this increase are multifactorial, it likely reflects biophysical changes of aging, coupled with concomitant disease processes of the crash victim at the time of the collision. Some of the specific reasons for older adult frailty can be delineated by age-related limitation of biological systems. Changes in the cardiovascular system, including the stiffening of the heart and pericardium, combined with atherosclerotic vessels, limit the ability of the heart to compensate after blood loss in MVCs.25Pulmonary parenchyma changes and osteoporosis make older adults more prone to rib fractures and pulmonary contusion. Chronic bony changes and narrowing of the spinal canal place older adults at risk for cord contusions as well as central cord syndrome. Loss of the ability of older adults to concentrate urine makes urine output an unreliable indicator for evaluating shock. Subdural hematoma can occur more commonly compared to younger age groups because of less brain volume in a rigid skull.26 Furthermore, the effect of medications, such as anticoagulants and beta blockers, can increase the difficulty in evaluation and treatment of MVCs. Therefore, evaluation of the older adult patients requires specific attention to the physiologic changes, thorough evaluation, and careful inpatient observation.27
Injury Prevention
Injury prevention for the older driver involves 3 distinct aspects: the driver, the vehicle, and the road. Approaches to driver fitness include fitness-to-drive screening and medical and administrative strategies. All approaches should focus on optimizing the opportunity for the senior to safely maintain their mobility because many regions of the US have very poor alternative mobility opportunities for seniors.
Approaches to injury prevention would also include training healthcare providers, family, and the community about the risks of unsafe driving due to age or driving habits. The educational interventions would include providing material to help seniors drive more safely, collaboration with senior focus groups on assessment and licensing tools, as well as looking at options for mobility when driving is no longer safe. Driver aspects would also include screening older adults for safe driving. These would include tools such as the “Roadwise Review” by the American Automotive Association (AAA) and the “Physician’s Guide to Assessing and Counseling Older Drivers” by the American Medical Association. In 2004, Florida passed a law that required drivers aged 80 and older to pass a visual screening test before a driver’s license can be renewed. Recent research has shown that since the implementation of this mandated law, fatalities in this age group in Florida have decreased linearly.28
The vehicle component includes emerging in-vehicle technologies (such as side airbags, age-appropriate restraints that accommodate older drivers’ different physiology, and automatic crash notification, blind spot warning systems, and night vision) and helping mature drivers find their perfect fit in their car. Other problems include drivers who cannot reach the brake pedal properly, inappropriately positioned steering wheels (either up or down too much), incorrectly adjusted head restraints or mirrors, and drivers needing instruction in seat adjustment. One AAA program in California administered by trained personnel leads each senior driver through a 20-minute educational assessment to identify and address vehicle fit.
The road aspect focuses on senior-friendly road designs, improving visibility and size of street signs, larger traffic signals, improved lighting, and protected left-turn lanes. Traffic calming may benefit both senior drivers and other road users.29
LIMITATIONS
The SWIRTS data were collected by many departments, which can lead to errors during collection and entry. However, the requirement to use the same report as the Traffic Collision Report (CHP555) likely reduces this variability among departments. Regarding severity of injuries, correlating with the hospital medically assessed severity will be much more accurate and comprehensive than using field-assessed data by the investigating officers. Also, most studies have used Injury Severity Scores or Anatomic Injury Scores to report injury severity, but these were not available via the data collected on the CHP555.30,31 This study also concentrated on only Orange County, California, but a better representative sample for the US would have likely been the state of California. Orange County older adult drivers could have different characteristics than older drivers in other parts of California or in rural parts of the US. The lack of available and viable public transportation in Orange County creates a dynamic that is different than other places in the United States Orange County geography and the comparatively vast distances required to commute create special circumstances for older adults, placing them at further risk than might be encountered on relatively shorter drives common in smaller towns.
CONCLUSION
This study demonstrated that older adult fatalities and the percentage of collisions that involved other visible injuries or severe injuries increased with age. Factors associated with older drivers’ MVCs are different from other age groups. There is need for further investigation and prevention strategies to reduce fatalities as well as rate of collisions in older adults.
Footnotes
The authors wish to thank Professor Roberta Malmgren and Dr Christian Jivcu for their contributions to this research project, June Casey for her editorial help, and the California Highway Patrol Information Service Unit for making the SWITRS data available to us.
Supervising Section Editor: Trevor Mills, MD, MPH
Submission history: Submitted July 22, 2010; Revision received December 31, 2010; Accepted August 3, 2011
Full text available through open access at http://escholarship.org/uc/uciem_westjem
DOI: 10.5811/westjem.2011.8.6610
Address for Correspondence: Shahram Lotfipour, MD, MPH, University of California, Irvine, Departments of Surgery and Emergency Medicine, 101 The City Dr, RT 128-01, Orange, CA 92868
E-mail: shl@uci.edu
Conflicts of Interest: By the WestJEM article submission agreement, all authors are required to disclose all affiliations, funding, sources, and financial or management relationships that could be perceived as potential sources of bias. The authors disclosed none. The project described was supported by Grant Number UL1 RR031985 from the National Center for Research Resources, a component of the National Institutes of Health (NIH) and the NIH Roadmap for Medical Research.
REFERENCES
1. US Census Bureau. Census bureau reports world’s older population projected to triple by 2050. Available at: http://www.census.gov/PressRelease/www/releases/archives/international_population/013882.html. Accessed October 27, 2009.
2. He W, Sengupta M, Velkoff VA. 65+ in the United States: 2005. Washington, DC: US Government Printing Office; 2005. US Census Bureau, current population reports: special studies; pp. 23–209.
3. Federal Highway Administration. Section III: Driver licensing. Highway statistics 2004. Available at: http://www.fhwa.dot.gov/policy/ohim/hs04/dl.htm. Accessed August 22, 2006.
4. National Center for Injury Prevention and Control. Center for Disease Control injury research agenda 2009–2018. Atlanta, GA: Center for Disease Control and Prevention; 2009.
5. National Highway Safety Administration. Traffic Safety Facts 2008: Older Drivers. Washington, DC: National Highway Safety Administration’s National Center for Statistics and Analysis; 2009. pp. 1–6.
6. National Center for Health Statistics. Health, United States, 2005 with Chartbook on Trends in the Health of Americans. Washington, DC: US Government Printing Office; 2005. p. 214.
7. California Highway Patrol. 2007 Annual Report of Fatal and Injury Motor Vehicle Traffic Collisions. Sacramento, CA: 2008.
8. Department of California Highway Patrol. Collision Investigation Manual (complete revision). HPM 110.5. Sacramento, CA: 2003.
9. Shinar D, Treat JR, McDonald ST. The validity of police reported data. Accident Analysis & Prevention. 1983;15:175–191.
10. Farmer CM. Reliability of police-reported information for determining crash and injury severity.Traffic Injury Prevention. 2003;4:38–44. [PubMed]
11. State of California, Department of Finance. Race/Ethnic Population with Age and Sex Detail, 1990–1999. Sacramento, CA: 2009.
12. State of California, Department of Finance. E-3 Race/Ethnic Population Estimates with Age and Sex Detail, 2000–2007. Sacramento, CA: 2009.
13. Grabowski DC, Morrisey MA. The effect of state regulations on motor vehicle fatalities for younger and older drivers: a review and analysis. Milbank Q. 2001;79:517–545. [PMC free article][PubMed]
14. Messinger-Rapport BJ. Assessment and counseling of older drivers: a guide for primary care physicians. Geriatrics. 2003;58:16–18. [PubMed]
15. Lotfipour S, Vaca F. Commentary: polypharmacy and older drivers: beyond the doors of the emergency department (ED) for patient safety. Ann Emerg Med. 2007;49:535–537. [PubMed]
16. Center for Injury Prevention Policy and Practice. California’s aging drivers fact sheet. Available at: http://www.eldersafety.org. Accessed February 18, 2006.
17. McGwin G, Brown DB. Characteristics of traffic crashes among young, middle-aged, and older drivers. Accid Anal Prev. 1999;31:181–198. [PubMed]
18. Liu C, Chen C, Subramanian R. National Highway Traffic Safety Administration Technical Report. Springfield, VA: National Technical Information Service; 2005. Analysis of speeding-related fatal motor vehicle traffic crashes; p. 18.
19. National Highway Traffic Safety Administration. DOT HS 809 419. Washington, DC: National Highway Traffic Safety Administration; 2002. Alcohol involvement in fatal crashes 2000; p. 10.
20. Li G, Braver ER, Chen LH. Fragility versus excessive crash involvement as determinants of high death rates per vehicle-mile of travel among older drivers. Accid Anal Prev. 2003;35:227–235.[PubMed]
21. Meuleners LB, Harding A, Lee AH. et al. Fragility and crash overrepresentation among older drivers in Western Australia. Accid Anal Prev. 2006;38:1006–1010. [PubMed]
22. Cook LJ, Knight S, Olson LM. et al. Motor vehicle crash characteristics and medical outcomes among older drivers in Utah, 1992–1995. Ann Emerg Med. 2000;35:585–591. [PubMed]
23. Schiller WR, Knox R, Chleborad W. A five-year experience with severe injuries in elderly patients.Accid Anal Prev. 1995;27:167–174. [PubMed]
24. Rueda-Domingoa T, Lardelli-Claret P, Luna-del-Castillo J. et al. The influence of passengers on the risk of the driver causing a car collision in Spain: analysis of collisions from 1990 to 1999. Accident Analysis and Prevention. 2004;36:481–489. [PubMed]
25. Branfronbrener M, Landowne M, Shock NW. Changes in cardiac output with age. Circulation.1984;69:203–213. [PubMed]
26. Timiras P. Physiological basis of Aging and Geriatrics. 4th ed. New York, NY: Lippincott Williams & Wilkins; 2007.
27. Lotfipour S, Vaca FE. Harwood-Nuss’ Clinical Practice of Emergency Medicine. 4th ed. Philadelphia, PA: Lippincott Williams & Wilkins; 2005. pp. 1124–1128.
28. McGwin G, Sarrels SA, Griffin R. et al. The impact of a vision screening law on older driver fatality rates. Arch Ophthalmol. 2008;126:1544–1547. [PMC free article] [PubMed]
29. Bunn F, Collier T, Frost C. et al. Traffic calming for the prevention of road traffic injuries: systematic review and meta-analysis. Inj Prev. 2003;9:200–204. [PMC free article] [PubMed]
30. Shih HC, Hu SC, Yang CC. et al. Alcohol intoxication increases morbidity in drivers involved in motor vehicle accidents. Am J Emerg Med. 2003;21:91–94. [PubMed]
31. Cunningham RM, Maio RF, Hill EM. et al. The effects of alcohol on head injury in the motor vehicle crash victim. Alcohol. 2002;37:236–240.


