
| Author | Affiliation |
|---|---|
| John J Cienki, MD, MSPH | University of Miami, Jackson Memorial Hospital/Miller School of Medicine, Division of Emergency Medicine, Miami, Florida |
| Lawrence A DeLuca, MD, EdD | University of Arizona, College of Medicine, Department of Emergency Medicine, Tempe, Arizona |
| Daniel J Feaster, PhD | University of Miami, Miller School of Medicine, Division of Biostatistics, Miami, Florida |
ABSTRACT
Introduction:
No clear understanding exists about the course of a patient’s blood pressure (BP) during an emergency department (ED) visit. Prior investigations have demonstrated that BP can be reduced by removing patients from treatment areas or by placing patients supine and observing them for several hours. However, modern EDs are chaotic and noisy places where patients and their families wait for long periods in an unfamiliar environment. We sought to determine the stability of repeated BP measurements in the ED environment.
Methods:
A prospective study was performed at an urban ED. Research assistants trained and certified in BP measurement obtained sequential manual BPs and heart rates on a convenience sample of 76 patients, beginning with the patient arrival in the ED. Patients were observed through their stay for up to 2 hours, and BP was measured at 10-minute intervals. Data analysis with SAS PROC MIXED (SAS Institute, Cary, North Carolina) for regression models with correlated data determined the shape of the curve as BP changed over time. Patients were grouped on the basis of their presenting BP as normal (less than 140/90), elevated (140–160/90–100), or severely elevated (greater than 160/100) for the regression analysis.
Results:
A statistically significant downward trend in systolic and diastolic BP was observed only for those patients presenting with severely elevated BPs (ie, greater than 160/100).
Conclusion:
We demonstrate a statistically significant decline in systolic and diastolic BP over time spent in the ED only for patients with severely elevated presenting BPs.
INTRODUCTION
The emergency medicine literature contains many studies demonstrating that blood pressures (BP) are not stable over time in patients in the emergency department (ED). Nielsen et al1 demonstrated that the BPs of severely hypertensive patients decreased over several hours of rest in a quiet environment, decreasing by approximately 30 mmHg over 1 hour regardless of whether or not they received antihypertensive therapy. Pitts and Adams2 found that patients who presented with hypertension in the ED experienced a spontaneous decline in BP. He attributed most of this decline to statistical regression to the mean. In a prior study, we demonstrated that repeating triage BP measurements in a quiet environment resulted in decrements of at least 10 mmHg in most participants, regardless of the initial BP.3
There are 2 important limitations to these prior studies. First, aside from the Nielsen study, there was no attempt to quantify the timeframe under which stabilization of BP measurements occurs, if at all, nor the extent to which the BP decreases. Second, these studies involved interventions targeted at reducing the BP.
Recent data demonstrate that ED wait times have increased substantially; therefore, patients are left waiting for longer periods before any intervention occurs. We sought to define the extent and magnitude of BP change that occurs during this waiting time. We considered a stable change of 10 mmHg in either direction for systolic or diastolic pressure to be clinically relevant.
METHODS
Study Design
The study used a prospective design. A convenience sample of patients presented to ED triage were enrolled in the study. Patients were provided with written informed consent that was approved by the local Committee for the Protection of Human Subjects in Research.
Study Setting
The study was conducted from December 2003 to February 2004 at an urban university ED. The annual ED census was greater than 150,000.
Selection of Participants
All patients age 18 years and older who presented to the ED were eligible to participate provided that they were capable of giving consent and that conducting repeated measurements of their BP would not adversely affect their care. Study participants were excluded if they had ingested caffeine or other stimulants in the previous 24 hours or if they had had changes to their medication regimen in the last several days that might affect BP. Patients with critical medical conditions that required immediate evaluation and treatment (eg, hypertensive emergency or conditions with severe pain) were excluded from the study. In addition, no patients received any medications, including anti-hypertensive agents, during the course of this study.
Methods of Measurement
Manual BP measurements were made at ED triage by using a standard mercury sphygmomanometer (Applied Diagnostic Corp, Happauge, New York). The research assistants auscultated the brachial artery by using a Littman Cardiology III stethoscope (3M Littmann Stethoscopes, Rhinebeck, New York). All equipment was calibrated in accordance with the manufacturers’ recommendations. All BP measurements were conducted by personnel trained and certified according to standards outlined by the British Hypertension Society.4 Inter- and intrarater reliability were accurate to 2 mmHg.
Repeated measurements were made thereafter at 10-minute intervals for 2 hours or until participants refused additional measurements. Participants were divided into 3 groups on the basis of their presenting BPs: severely elevated (greater than 160/100), elevated (140–160/90–100), and normal (less than 140/90). The cutoffs for each group were derived from Joint National Committee on Prevention, Detection, Evaluation, and Treatment of High BP (JNC) VII staging.5 JNC VII criteria typically are used to stratify groups of individuals on the basis of stable BP measurements made at multiple office visits. Although no attempt was made to diagnose hypertension in individuals during the course of this study, the JNC VII classifications nonetheless represent the most widely recognized standard for dividing patients into groups that are based on BP. Because the purpose of this study was to observe the fluctuations in BP that occur within the ED setting, patient activity and location were not restricted during enrollment time in the study.
Outcome Measures
Outcome measures involved changes to systolic and diastolic BP as a function of time during an ED visit.
Data Analysis
Standard regression models allow for only 1 measurement per study participant. In this study, repeated measurements of the same participants were central to the study design and required a more sophisticated regression model. Ware6 described such models, which form the theoretical basis for SAS PROC MIXED (SAS Institute, Cary, North Carolina), the program used here to determine the relationship between time and heart rate (HR), systolic BP, or diastolic BP. We utilized a growth curve specification for the means that allowed the inclusions of variance components for each growth factor. This, in effect, provided a growth curve for each individual, which the model then combined to get an overall curve.
A priori power analysis indicated that a sample size of 25 participants with a minimum of 7 readings each would be adequate to detect significant differences (at α = 0.05) of 10 mmHg and a standard deviation of 10 mmHg at a power level of 0.90. Because of the concern that a large proportion of participants might drop out of the study before all measurements were obtained, a target of 50 participants was set.
An alternative analysis was performed that allowed individuals to move among JNC VII groups as their BPs changed over time. This did not result in any material change from the results presented here.
RESULTS
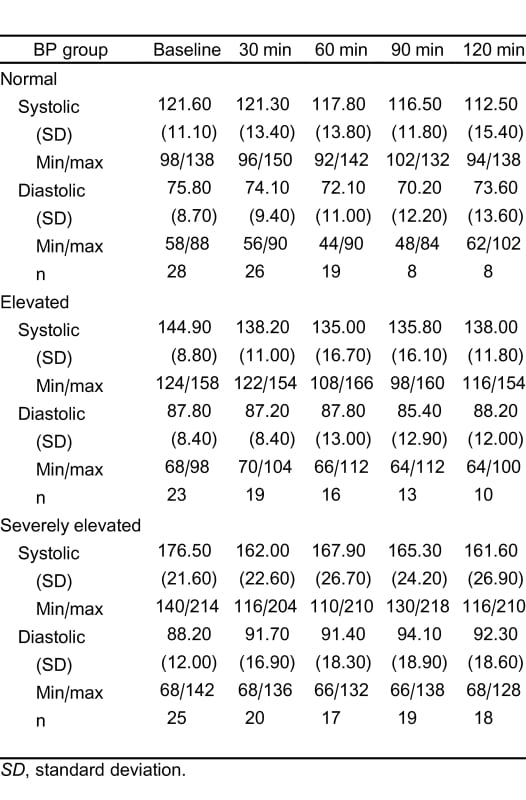
A total of 76 patients were enrolled at triage. Of the 76 study participants, 28 presented as normotensive status; 23, as elevated; and 25, as severely elevated. Of the 76 participants, 26 were missing some measurements. Because we anticipated omitting patients with incomplete data from the analysis, we continued to enroll study participants in order to replace them. However, the statistical procedure was sufficiently robust to accommodate participants with some missing data, and data from these participants were included in the final analysis. Review of the data and comparative analyses suggests that participants with partial data did not differ from those with full data. Descriptive data is outlined in Table 1.
Although HR and BP were expected to decline over time, the exact shape of the curve defining this relationship was not immediately obvious. An iterative process, beginning with simple linear regression and adding higher-order terms to improve overall fit, ultimately resulted in the following regression equation:
DEPVAR = J0 + J1 × T + J2 × T2+ J3 × T3.
for which DEPVAR is the dependent variable of systolic BP or diastolic BP, T is the time interval of the reading (eg, 0, 10 minutes, 20 minutes), and J represents the regression coefficients. Our model allowed each group (normal, elevated, and severely elevated) to have unique growth curves with linear quadratic and cubic trends in BP measurements over time. There was no evidence of statistically significant higher order time trends in the data.
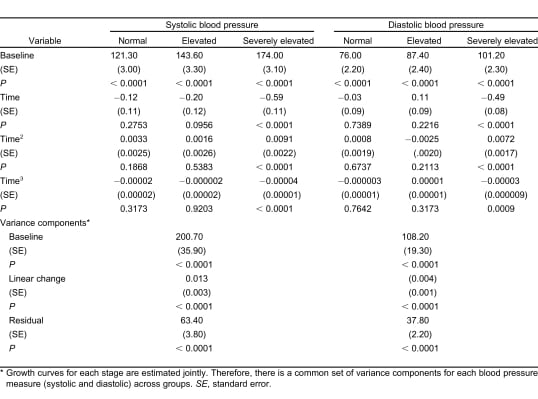
There were significant differences in linear rates of decline in systolic BP by presenting BP group (F2,555 = 5.20, P < 0.006), although all 3 groups had significant linear rates of decline (normal: b = −0.25 per minute, P < 0.0008; elevated: b = −0.34 per minute, P < 0.0001; extremely elevated: b = −0.39 per minute, P < 0.0001). The quadratic mean trend (b = 0.005 per minute, P < 0.0006) and cubic mean trend (b = −0.00002 per minute, P < 0.005) were the same across presenting BP groups. These combined trends implied that there was no significant difference in mean systolic BP across time for the normal group. For the elevated group, mean systolic BP was significantly reduced at all points beyond 60 minutes. The mean difference over the second hour from baseline was 8.2 (standard error [SE] = 2.3, P < 0.0004).
There were significant differences in linear (F2,551 = 12.11, P < 0.0001), quadratic (F2,551 = 6.87, P< 0.002), and cubic (F2,551 = 4.31, P < 0.02) rates of decline in diastolic BP by presenting BP group). The extremely elevated group was the only group to show significant trends over time (linearb = −0.50 per minute, P < 0.0001; quadratic b = 0.0072 per minute, P < 0.0001; cubic b = −0.00003 per minute, P < 0.002). The combined impact of these trends showed that the mean diastolic BP was significantly lower than BP at each time of follow-up (mean decline from baseline in first hour of follow-up = 9.4, SE = 1.5, P < 0.0001; mean decline from baseline in second hour of follow-up = 8.8, SE = 1.5, P < 0.0001). The coefficients are summarized in Table 2.
The regression analysis for systolic and diastolic BP showed significant variance in the linear component of change, which indicated substantial individual variation across participants. Thus, as many participants had a small decrease in BP as had a more significant decrease and, in some cases, a slight increase. Therefore, an individual BP alone is not sufficient for us to classify these individuals according to their presenting BPs.
DISCUSSION
Our data demonstrated a statistically significant decline for only the most elevated BPs (ie, presenting pressure greater than 160/100 mmHg). However, this decline is not sufficient to normalize BP within a 2-hour timeframe. Prior research may have done a disservice to a large number of patients in the ED by not explicitly examining this variability. Understanding this variability and eventually finding the characteristics that predict it may allow the development of guidelines to target BP interventions in the ED.
Patients with so-called normal presenting BPs were included on the study. Our prior data suggest that presenting pressures of these patients may be no more stable over time than those of patients presenting with elevated pressures. Therefore, concern exists that a low-normal BP might, for example, represent hypotension temporarily masked by anxiety and/or pain.
Although there is a small and statistically significant downward trend to the composite curve for systolic pressures, there was considerable individual variability between study participants. More than half of participants experienced fluctuations substantial enough to change the patient’s classification from the initial BP, which supports the JNC VII recommendation of multiple measurements separated in time. ED physicians may not have such luxury, but it is especially important in the ED environment to interpret any isolated BP measurement with caution.
Despite the currently accepted notion that BP decreases and plateaus with time spent in the ED, the results of previous studies on repeat BP measurements in the ED have been divided. Some researchers have found that brief periods of rest in the ED7 or simple placement in the supine position1 significantly lowered the BP of patients with severe hypertension. Other studies have failed to demonstrate statistically significant differences between repeat BP measurements in the ED.8Major emergency medicine texts state that “most patients, even those with an exacerbation of chronically elevated BP, will show a substantial decrease in pressure without intervention during a short observation period in the ED.”9 Further, Rosen’s Emergency Medicine states that “the most common causes of transient hypertension are pain and anxiety. In these patients, end-organ ischemia is highly unlikely, and treatment of the primary process results in prompt resolution of their acute hypertension. For this reason, all patients without evident complications should be allowed to rest 60 minutes and have pressures reassessed. Most patients, even those with poorly treated chronic hypertension, will show an improvement in their BP with watchful waiting.”9
We did not observe the equilibration in BP that was demonstrated in the study by Nielsen et al,1 even in those patients with the most severely elevated BP. However, the overcrowded and chaotic environments of modern urban EDs have all but eliminated the conditions under which such an equilibration in BP could be expected to occur spontaneously.
LIMITATIONS
This study, although powered adequately to detect clinically significant differences between repeated manual measurements (ie, 5 mmHg ± 10 mmHg), was conducted at a single center, and problems identified in our practice environment may not exist in other facilities. A larger-scale, multicenter study would provide more information in this regard.
It has been posited that the frequent BP measurements might have induced anxiety or a white coat hypertensive effect. Some patients tired of the frequency of measurements, and the initial consent and reading might have induced some anxiety. However research assistants noted that the patients often expressed gratitude for participation in the study. The patients perceived the frequent BP readings as some sort of involvement, whereas other patients not on the study often waited without ED personnel addressing them. Nevertheless, we cannot exclude a Hawthorne effect on the BP by virtue of frequent measurements.
Although the research assistants noted participant activities that might affect BP, such activities were not systematically recorded or analyzed. No patient received any medications that might have any effect on BP during the course of the study. However, many patients had intravenous lines placed or blood drawn during the course of the study; none received significant fluid boluses during the study period, though. Repeating this study and coding for variables, such as body position, activity, and location within the ED, may allow for a model that better explains the variability of BP measurements. It is also possible that the 2-hour period over which the study was conducted was insufficient time for BP equilibration. Lengthening the time between measurement intervals and keeping participants in the study for longer time periods might change the outcome of this study.
Patients who ingested stimulants, including caffeine, were excluded from the study. Although this excluded a sizable portion of the ED population, we wished to exclude any patient who had a large stimulant bolus either prior to enrollment or during the course of the study.
The population for this study consisted of a wide array of individuals who might present with a variety of conditions. It is possible that some features of the presenting complaint (eg, pain or chronicity) may have accounted for some of the between-patient variability observed. A larger study may provide a sufficient number of patients, so a proper subgroup analysis could be undertaken to address this question.
Research assistants were trained prior to commencement of the study with excellent interater and intrarater reliability. We did not recheck the assistants over the time of the study to confirm that this was maintained, leading to a possible source of error. However, in no case did the 2 research assistants trade off on a given patient, so there would not be problems with interrater reliability in BP measurement.
The JNC VII criteria were used as a means of grouping patients with similar presenting BPs, though this is not, strictly speaking, the intended purpose of the BP groups. A large-scale cohort study prospectively observing patients initially enrolled in EDs throughout the country would be necessary to determine the long-term health consequences (if any) that can be attributed to presenting BPs in the ED.
CONCLUSION
BP in the ED is not stable over time. This study provides evidence of a downward trend in repeated measurements on those who present to ED triage with severely elevated BPs. Although the magnitude of the decrease in BP is less than previously described, it still is consistent with the recommendation for watchful waiting in those who do not present with a frank hypertensive emergency. This downward trend would add caution to those who would hastily treat hypertensive patients in the ED. It confirms the approach to a patient presenting to ED triage who has very high blood pressure: without evidence of acute end organ damage, do not hurry to treat. However, we cannot overlook the need referral for outpatient management of hypertension in order to treat hypertension, not urgently, but continuously.10
Footnotes
Supervising Section Editor: Jeffrey Sankoff, MD
Submission history: Submitted November 10, 2009; Revision received January 25, 2010; Accepted March 14, 2011
Reprints available through open access at http://escholarship.org/uc/uciem_westjem
DOI: 10.5811/westjem.2011.3.1764
Address for Correspondence: John J. Cienki, MD, MSPH
University of Miami, Jackson Memorial Hospital/Miller School of Medicine, Division of Emergency Medicine, 1611 NW Ave, Miami HOLTZ 1195, FL 33316-1096
E-mail: jcienki@jhsmiami.org
Conflicts of Interest: By the WestJEM article submission agreement, all authors are required to disclose all affiliations, funding sources, and financial or management relationships that could be perceived as potential sources of bias. The authors disclosed none.
REFERENCES
1. Nielsen PE, Krogsgaard A, McNair A, et al. Emergency treatment of severe hypertension evaluated in a randomized study. Acta Med Scand. 1980;;208:473–480. [PubMed]
2. Pitts SR, Adams RP. Emergency department hypertension and regression to the mean. Ann Emerg Med. 1998;;31:214–218. [PubMed]
3. Cienki J, DeLuca L, Daniel N. The validity of emergency department triage BP measurements. Acad Emerg Med. 2004;;11:237–243. [PubMed]
4. O’Brien E, Petrie J, Littler W, et al. The British Hypertension Society protocol for the evaluation of automated and semi-automated BP measuring devices with special reference to ambulatory systems.J Hypertens. 1990;;8:607–619. [PubMed]
5. Chobanian AV, Bakris GL, Black HR, et al. Seventh report of the Joint National Committee on Prevention, Detection, Evaluation, and Treatment of High BP. Hypertension. 2003;;42:1206–1252.[PubMed]
6. Ware J. Linear models for the analysis of several measurements in a longitudinal series. Am Stat.1985;;35:95–101.
7. Lebby T, Paloucek F, Dela Cruz F, et al. BP decrease prior to initiating pharmacological therapy in nonemergent hypertension. Am J Emerg Med. 1990;;8:27–29. [PubMed]
8. Backer HD, Decker L, Ackerson L. Reproducibility of increased BP during an emergency department or urgent care visit. Ann Emerg Med. 2003;;41:507–512. [PubMed]
9. Gray RO, Mathews JJ. Hypertension. In: Marx JA, Hockenberger RS, Walls RM, et al., editors.Rosen’s Emergency Medicine: Concepts and Clinical Practice. 5th ed. Vol. 79. St Louis, MO: Mosby; 2002;. p. 1170.
10. Gallagher EJ. Hypertensive urgencies: treating the mercury? Ann Emerg Med. 2003;;41:530–531. [PubMed]