
| Author | Affiliation |
|---|---|
| Hao Wang, MD, PhD | JPS Health Network, Department of Emergency Medicine, Fort Worth, Texas |
| Runhua Shi, MD, PhD | Louisiana State University Health Science Center, Department of Internal Medicine, Shreveport, Louisiana |
| Simon Mahler, MD | Louisiana State University Health Science Center, Department of Emergency Medicine, Shreveport, Louisiana |
| Joseph Gaspard, MD | Louisiana State University Health Science Center, Department of Emergency Medicine, Shreveport, Louisiana |
| Julie Gorchynski, MD, MSc | Louisiana State University Health Science Center, Department of Emergency Medicine, Shreveport, Louisiana |
| James D’Etienne, MD | JPS Health Network, Department of Emergency Medicine, Fort Worth, Texas |
| Thomas Arnold, MD | Louisiana State University Health Science Center, Department of Emergency Medicine, Shreveport, Louisiana |
ABSTRACT
Introduction:
Vascular pedicle width (VPW), a measurement obtained from a chest radiograph (CR), is thought to be an indicator of circulating blood volume. To date there are only a handful of studies that demonstrate a correlation between high VPW and volume overload, each utilizing different VPW values and CR techniques. Our objective was to determine a mean VPW measurement from erect and supine CRs and to determine whether VPW correlates with volume overload.
Methods:
MEDLINE database, Web of Science, and the Cochrane Central Register of Controlled Trials were searched electronically for relevant articles. References from the original and review publications selected electronically were manually searched for additional relevant articles. Two investigators independently reviewed relevant articles for inclusion criteria and data extraction. Mean VPW measurements from both supine and erect CRs and their correlation with volume overload were calculated.
Results:
Data from 8 studies with a total of 363 subjects were included, resulting in mean VPW measurements of 71 mm (95% confidence interval [CI] 64.9–77.3) and 62 mm (95% CI 49.3–75.1) for supine and erect CRs, respectively. The correlation coefficients for volume overload and VPW were 0.81 (95% CI 0.74–0.86) for both CR techniques and 0.81 (95% CI 0.72–0.87) for supine CR and 0.80 (95% CI 0.69–0.87) for erect CR, respectively.
Conclusion:
There is a clinical and statistical correlation between VPW and volume overload. VPW may be used to evaluate the volume status of a patient regardless of the CR technique used.
INTRODUCTION
Rapid identification of patients with severe volume overload is important in the diagnosis and management of critically ill emergency department (ED) patients. While patients with volume overload typically present with difficulty breathing, clinical diagnosis can often be challenging.1–3Patients with a delayed diagnosis of volume overload may experience significant morbidities, prolonged hospitalization, and increased length of intensive care stay, or possibly even death.4,5 Yet as significant as volume overload is to clinical practice and patient outcomes, no reliable, robust method for quantifying volume status or volume overload exists.
Chest radiographs (CR) are routinely used in the ED to evaluate for cardiopulmonary abnormalities. CRs are quick, easy to obtain, and noninvasive. Several CR characteristics, such as prominent pulmonary vasculature in the lung fields, blunted costophrenic angles, loculated fissure effusions, hazy interstitial markings, and a butterfly edema pattern, are routinely used for the evaluation of volume overload.6–10 However, these radiographic signs are subjective and clinician dependent, and the correlation with volume overload is qualitative at best, as well as quantitatively ill-defined.
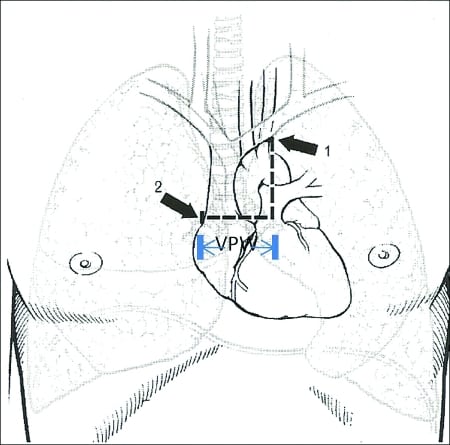
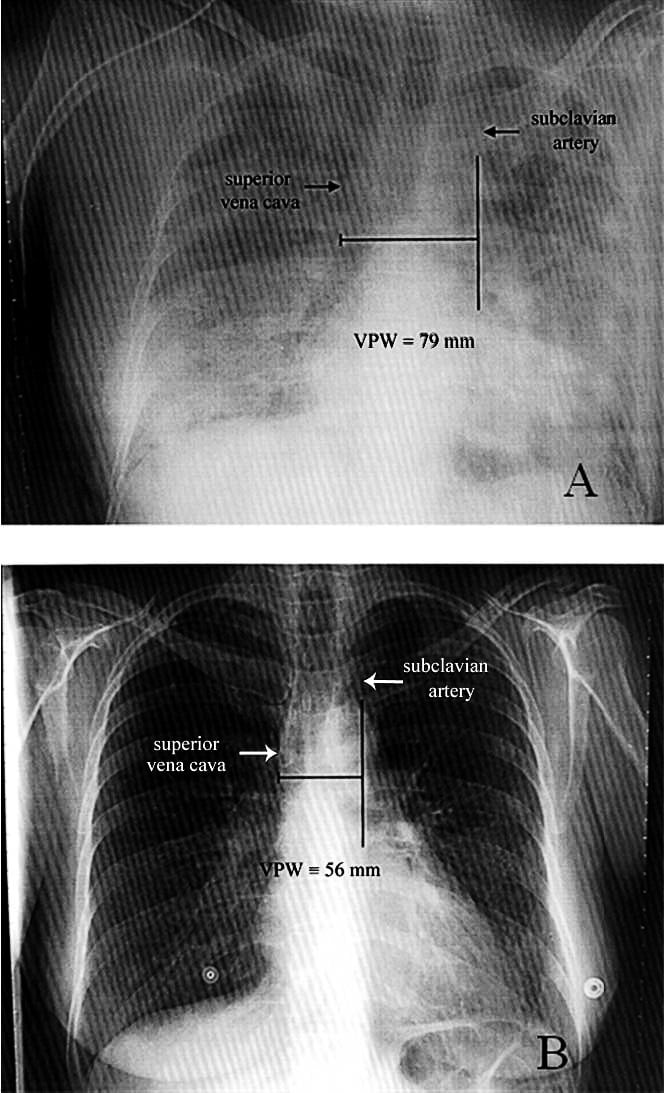
In 1984, Milne and colleagues11 measured the vascular pedicle width (VPW) on CR to estimate the intravascular volume status. VPW is the distance, measured in millimeters, from a perpendicular line at the takeoff point of the left subclavian artery off the aorta to the point at which the superior vena cava crosses the right main bronchus (Figure 1). Numerous studies12–20 report that VPW measurement is significantly larger in patients with volume overload and that increased VPW measurement correlates with volume overload as well. Measuring the VPW is relatively easy, accurate, and objective. (Please see Figure 2 for comparison of VPW measurement in a patient with volume overload vs a patient with normal volume status.)
Studies12–24 published to date have used different VPW values to illustrate the significance of volume overload. Some studies have measured VPW on erect CRs and others have used supine views. The number of subjects in prior studies has been limited. Therefore, a systemic meta-analysis was conducted to determine the different VPW values using different CR techniques and whether they correlate with volume overload.
METHODS
An electronic search of the MEDLINE database (1966–December 2009), Web of Science (1900–December 2009), and the Cochrane Central Register of Controlled Trials (1900–December 2009) for English-language articles that had the keywords, text words, or MESH headings of “vascular pedicle width” or “VPW” in combination with “volume status” or “volume overload” or “pulmonary edema” or “intravascular volume” was performed. A manual search of cited references was reviewed. Two investigators independently reviewed all articles. Discrepancies were resolved by consensus, with a third reviewer available if necessary.
Articles were selected if VPW was measured on CR in patients in either erect or supine positions and if volume overload had been evaluated by invasive and/or noninvasive techniques, including pulmonary artery occlusion pressure (PAOP), global end diastolic volume, intrathoracic blood volume index, left atrial emptying fraction (LAEF), or total blood volume. Studies that did not report a mean value or standard deviation (SD) were excluded. Two reviewers also independently assessed each included study and evaluated the quality of each article using the Jadad score.25
The mean VPW, SD, correlation coefficient, and sample size were obtained from each study. Comprehensive meta-analysis software 2.2 and Stata 11 (College Station, Texas) were used for data analysis.26 The summary effect of mean VPW (weighted mean) was estimated by assigning weight as the inverse of its variance method in the fixed effects of meta-analysis.27 A random effect model, utilizing the DerSimonian and Laird method, estimated the summary effect of mean VPW.28 Similarly, fixed and random effects were estimated for cardiothoracic ratio (CTR) as well as correlation coefficiency. Two subgroups, erect and supine, were analyzed for VPW values. The Q-test, which is a chi-square method, was used for comparison between these 2 groups based on Cochran method.29 AP value less than 0.05 was considered a statistically significant difference between groups.
RESULTS
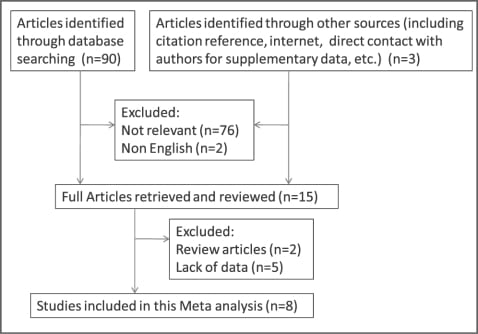
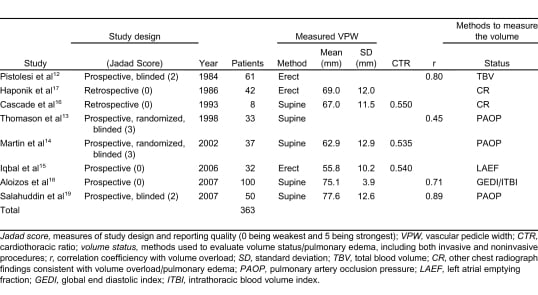
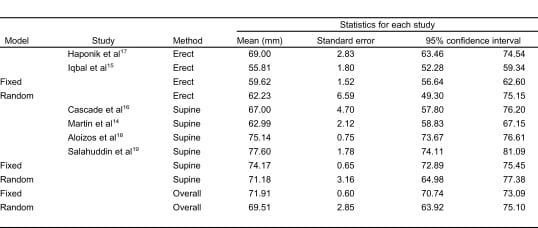
Eight studies (2 retrospective and 6 prospective) with 363 subjects were included in the meta-analysis (Table 1). With the exception of 2 studies that did not mention who measured VPW, in most studies, VPW was measured by radiologists.15,18 Volume overload and/or pulmonary edema were evaluated using either invasive or noninvasive methods, as mentioned above. Only VPWs measured in volume overload and/or pulmonary edema patients are included in this meta-analysis. Seven studies were excluded because they either belonged to review papers or contained a lack of reportable data 6,11,20–24 (refer to Figure 3 for flow diagram of selection).
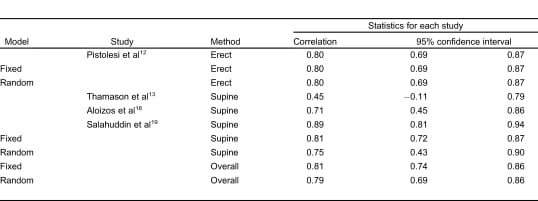
The meta-analysis results of VPW measurement in patients with volume overload are shown in Table 2. VPW measurements from 2 CR groups were compared: those with erect and supine views. The mean VPW value was 62.2 mm (95% confidence interval [CI] 49.3–75.1 mm) in the erect group and 71.1 mm (95% CI 64.9–77.3 mm) in the supine group. VPW measurements between the erect and supine CR groups were statistically significant (Q value = 77.3, P < 0.001). Regardless of CR technique, the larger the VPW value measured, the higher the change in the patient’s volume overload (r = 0.81, Q = 0.06, P = 0.80) (Table 3).
Only 3 studies14–16 investigated the CTR and its correlation with volume status. CTR is the maximum transverse diameter of the heart (determined by CR) divided by the greatest internal diameter of the thoracic cage (from inside of rib to inside of rib). It is used initially to help determine enlargement of the heart. Data analysis from these studies supports prior conclusions that CTR correlates poorly with volume status.
DISCUSSION
The data from this meta-analysis report VPW values from both erect and supine CR techniques that support the correlation between volume overload and increased VPW measurements.11,12,33–35Prior studies were limited by small sample size, varying VPW measurements, and CR technique (supine and erect). VPW was initially described using 72-inch erect periapical radiographs. However, supine CRs are commonly performed in critically ill patients using a portable radiograph machine. Thus, it is critical to address the difference in VPW values based on the position of the patient for CR. VPW measured11 on supine CRs in normal volunteers increased by 17% as a result of gravity. In addition, VPW values can be altered by respiratory effects or by subjects’ previous medical problems, especially cardiovascular diseases.11 For these reasons, the accuracy of VPW measurements on supine CR and its correlation with volume status has been questioned.
Four studies included in this meta-analysis used the supine CR technique for VPW measurements on subjects in the intensive care unit setting. Mean VPW values on supine CRs were significantly larger than in erect CRs (62 mm vs 71 mm, Q = 77.3, P < 0.001). Analysis of statistical heterogeneity is done using the Q statistic, which is a measure of the variability among studies related to the outcome variable. We chose the results from the random effect model on VPW value since the heterogeneity is presented (P < 0.001). In contrast, results of correlation coefficient from fixed-effects model are used because no statistically significant difference was found between studies (Q = 0.06, P > 0.05). Our results indicate that different VPW cut-off values need to be considered when using different CR techniques. However, regardless of the CR techniques used to measure the VPW value, they both correlate with volume overload (0.81 vs 0.80, P > 0.05), indicating the reliability of using VPW to evaluate the volume status.
Various invasive and noninvasive methods were used to measure volume overload, including pulmonary artery catheterization, ultrasound of the IVC, echocardiogram for LAEF, and direct measurement of total circulating blood volume.36–51 Invasive procedures require skillful operators, are time consuming, and result in more severe complications.36–39 Recently there has been an effort to replace invasive procedures with noninvasive alternatives. Subjects undergoing direct measurement of total circulating blood volume receive high radiation exposure, and this method is contraindicated in patients with a dye allergy or renal failure and is not repeatable on a daily basis.40–43 Bedside ultrasound is used to assess the volume status, including the measurement of IVC and LAEF. However, different percentage of IVC collapse during respiration obtained at different locations (such as at the level of the diaphragm, the hepatic vein inlet, or the left renal vein) indicates relatively higher variability.51 Echocardiogram to measure LAEF requires more specific training and is unreliable in inexperienced hands. Overall, to date there is no gold standard by which to determine whether subjects have volume overload and how severe it is.
CRs are commonly used in the ED to evaluate cardiovascular pathology. However, some radiographic signs for cardiovascular pathology are considered subjective, with higher variability among different readers. Using VPW to evaluate volume status is relatively objective. In addition, some studies also investigated the consistency of VPW measurement interpreted by the same radiologist at different time points (second reading approximately 3 months later to reduce recall bias; this is considered intrareader variability) or interpreted by different radiologists (interreader variability). The mean average percent variation on VPW measurement among different readers was only 2%.11 The intrareader correlation coefficient for VPW is 0.82, and the interreader correlation coefficient is 0.84.20 These studies indicate that measuring VPW on CR has relatively high consistency and low variability.
The data from this meta-analysis demonstrate that VPW correlates with volume overload. The higher the VPW value, the greater the correlation with volume overload and/or pulmonary edema. However, it may not be accurate to measure VPW in subjects with recent cardiothoracic surgery or severe rotation on CR or in subjects with mediastinal pathologies. Taken together, VPW measurements may be used as a diagnostic tool to evaluate volume status in selected patients. VPW measurement may be of particular value to emergency physicians, since it represents an easy, quick, and noninvasive method that can be applied in daily practice.
Few studies with limited data have also reported that the “delta” VPW, which is the difference between VPW measurements before and after treatment, highly correlates with intravascular volume status.14,22 Serial VPW measurements and the “delta” VPW may be useful to monitor the volume status change of a patient receiving medical management. However, we are unable to do any meta-analysis on delta VPW as a result of lack of clinical data at this time. To further determine the role of VPW in the evaluation of volume overload requires multicentered, prospective studies involving large numbers of patient and detailed information.
LIMITATIONS
A limited number of studies with small sample populations using different CR techniques and various methods to measure volume overload contribute to a relatively high interstudy variability, lowered power, and statistical effect. Additionally, there was no consistent gold standard to which volume overload was measured, making this study extremely hard to analyze quantitatively when compared to VPW values.
A funnel plot is designed to check the existence of publication bias in meta-analysis. Studies with publication bias usually obtain an asymmetric funnel plot.30 We did funnel plots on both erect and supine mean VPW (data not shown). Our results showed that the supine VPW measurement has less publication bias than did the erect VPW measurement. However, publication bias is only one of the possible explanations for funnel plot asymmetry. Factors that can affect the funnel plot asymmetry include but are not limited to language bias, citation bias, the size of effect differing according to study size, and poor methodological design of small studies, etc.31,32 As a result of the limited data, this meta-analysis included both prospective and retrospective studies. In the erect VPW group, there are only 2 small studies included, which could significantly affect the results and cause an asymmetric funnel plot.
Studies that reported only cut-off VPW values chosen from receiver operating characteristic curves are not included in this meta-analysis as a result of lack of VPW mean and SD values.11,20–24 This could result in eschewed data and poor meta-analysis due to incomplete enrollment of all studies. In addition, although bigger VPW values correlated with higher PAOP, wider inferior vena cava (IVC) diameter, higher LAEF, and worsening total circulating blood volume, because of the limited numbers of subjects enrolled, no large validation studies were performed individually.33–51
CONCLUSION
VPW value measured in supine and erect positions may be useful for evaluating patient volume status, as it appears to vary in a similar fashion with other prevailing measures of volume overload, none of which provides a gold standard for defining volume overload. In addition, a different cut-off VPW value needs to be considered related to the different CR techniques.
Footnotes
Supervising Section Editor: Beau Briese, MD, MA
Submission history: Submitted July 1, 2010; Revision received January 19, 2011; Accepted March 28, 2011
Reprints available through open access at http://escholarship.org/uc/uciem_westjem
DOI: 10.5811/westjem.2011.3.2023
Address for Correspondence: Hao Wang, MD, PhD
JPS Health Network, Department of Emergency Medicine, 1500 S Main St, Fort Worth, TX 76104
E-mail: hwang01@jpshealth.org
Conflicts of Interest: By the WestJEM article submission agreement, all authors are required to disclose all affiliations, funding sources, and financial or management relationships that could be perceived as potential sources of bias. The authors disclosed none.
REFERENCES
1. Yeow ME, Santanilla JI. Noninvasive positive pressure ventilation in the emergency department.Emerg Med Clin North Am. 2008;;26:835–847. [PubMed]
2. Collins SP, Mielniczuk LM, Whittingham HA, et al. The use of noninvasive ventilation in emergency department patients with acute cardiogenic pulmonary edema: a systematic review. Ann Emerg Med. 2006;;48:260–269. [PubMed]
3. Rogers RL, Feller ED, Gottlieb SS. Acute congestive heart failure in the emergency department.Cardiol Clin. 2006;;24:115–123. [PubMed]
4. Gray AJ, Goodacre S, Newby DE, et al. 3CPO Study Investigators. A multicentre randomised controlled trial of the use of continuous positive airway pressure and non-invasive positive pressure ventilation in the early treatment of patients presenting to the emergency department with severe acute cardiogenic pulmonary oedema: the 3CPO trial. Health Technol Assess. 2009;;13:1–106.
5. Di Marco F, Tresoldi S, Maggiolini S, et al. Risk factors for treatment failure in patients with severe acute cardiogenic pulmonary oedema. Anaesth Intensive Care. 2008;;36:351–359. [PubMed]
6. Milne EN, Pistolesi M, Miniati M, et al. The radiologic distinction of cardiogenic and noncardiogenic edema. AJR Am J Roentgenol. 1985;;144:879–894. [PubMed]
7. Grover M, Slutsky RA, Higgins CB, et al. Extravascular lung water in patients with congestive heart failure. Difference between patients with acute and chronic myocardial disease. Radiology.1983;;147:659–662. [PubMed]
8. Milne EN. A physiological approach to reading critical care unit films. J Thorac Imaging.1986;;1:60–90. [PubMed]
9. Aberle DR, Wiener-Kronish JP, Webb WR, et al. Hydrostatic versus increased permeability pulmonary edema: diagnosis based on radiographic criteria in critically ill patients. Radiology.1988;;168:73–79. [PubMed]
10. Morgan PW, Goodman LR. Pulmonary edema and adult respiratory distress syndrome. Radiol Clin North Am. 1991;;29:943–963. [PubMed]
11. Milne ENC, Pistolesi M, Miniati M, et al. The vascular pedicle of the heart and the vena azygos. Part I. Radiology. 1984;;152:1–8. [PubMed]
12. Pistolesi M, Milne ENC, Miniati M, et al. The vascular pedicle of the heart and the vena azygos. Part II. Radiology. 1984;;152:9–17. [PubMed]
13. Thomason JW, Ely EW, Chiles C, et al. Freimanis RI, Haponik EF. Appraising pulmonary edema using supine chest roentgenograms in ventilated patients. Am J Respir Crit Care Med. 1998;;157((5 Pt 1)):1600–1608. [PubMed]
14. Martin GS, Ely EW, Carroll FE, et al. Findings on the portable chest radiograph correlate with fluid balance in critically ill patients. Chest. 2002;;122:2087–2095. [PubMed]
15. Iqbal M, Ahmed R, Al Balas H, et al. Left atrial emptying fraction correlation with vascular pedicle width in patients with normal systolic function. J Coll Physicians Surg Pak. 2006;;16:320–323. [PubMed]
16. Cascade PN, Alexander GD, Mackie DS. Negative-pressure pulmonary edema after endotracheal intubation. Radiology. 1993;;186:671–675. [PubMed]
17. Haponik EF, Adelman M, Munster AM, et al. Increased vascular pedicle width preceding burn-related pulmonary edema. Chest. 1986;;90:649–655. [PubMed]
18. Aloizos S, Liapis G, Maragiannis D, et al. Comparison of vascular pedicle width and PiCCO-derived haemodynamic measurements in patients in a general intensive care unit. Crit Care. 2007;;11((suppl 2)):291.
19. Salahuddin N, Aslam M, Chishti I, et al. Determination of intravascular volume status in critically ill patients using portable chest x-rays: measurement of the vascular pedicle width. Ind J Crit Care Med. 2007;;11:192–197.
20. Ely EW, Smith AC, Chiles C, et al. Radiologic determination of intravascular volume status using portable, digital chest radiography: a prospective investigation in 100 patients. Crit Care Med.2001;;29:1502–1512. [PubMed]
21. Don C, Burns KD, Levine DZ. Body fluid volume status in hemodialysis patients: the value of the chest radiograph. Can Assoc Radiol J. 1990;;41:123–126. [PubMed]
22. Gao N, Kwan BC, Chow KM, et al. Longitudinal changes of cardiothoracic ratio and vascular pedicle width as predictors of volume status during one year in Chinese peritoneal dialysis patients.Kidney Blood Press Res. 2009;;32:45–50. [PubMed]
23. Studler U, Kretzschmar M, Christ M, et al. Accuracy of chest radiographs in the emergency diagnosis of heart failure. Eur Radiol. 2008;;18:1644–1652. [PubMed]
24. Jadad AR, Moore RA, Carroll D, et al. Assessing the quality of reports of randomized clinical trials: is blinding necessary? Control Clin Trial. 1996;;17:1–12.
25. Jung JI, Choi JE, Hahn ST, et al. Radiologic features of all-trans-retinoic acid syndrome. AJR Am J Roentgenol. 2002;;178:475–480. [PubMed]
26. Biostat. Comprehensive Meta Analysis. Englewood, NJ: Biostat; 2003.
27. Borenstein M, Hedges LV, Higgins J, et al. Introduction to Meta-Analysis. West Sussex, United Kingdom: John Wiley & Sons Inc; 2009.
28. DerSimonian R, Laird N. Meta-analysis in clinical trials. Control Clin Trials. 1986;;7:177–188.[PubMed]
29. Cochran WG. The combination of estimates from different experiments. Biometrics.1954;;10:101–129.
30. Egger M, Davey Smith G, Schneider M, et al. Bias in meta analysis detected by a simple graphic test. BMJ. 1997;;315:629–634. [PMC free article] [PubMed]
31. Lau J, Ioannidis JP, Terrin N, et al. The case of the misleading funnel plot. BMJ. 2006;;333:597–600. [PMC free article] [PubMed]
32. Tong JL, Liu JL. Misleading funnel plot for detection of bias in meta analysis. J Clin Epidemiol.2000;;53:477–484. [PubMed]
33. Miller RR, Ely EW. Radiographic measures of intravascular volume status: the role of vascular pedicle width. Curr Opin Crit Care. 2006;;12:255–262. [PubMed]
34. Ely EW, Haponik EF. Using the chest radiograph to determine intravascular volume status: the role of vascular pedicle width. Chest. 2002;;121:942–950. [PubMed]
35. Milne ENC. Correlation of physiologic findings with chest roentgenology. Radiol Clin North Am.1973;;11:17–47. [PubMed]
36. Yamauchi H, Biuk-Aghai EN, Yu M, et al. Circulating blood volume measurements correlate poorly with pulmonary artery catheter measurements. Hawaii Med J. 2008;;67:8–11. [PubMed]
37. Marik PE. The assessment of intravascular volume: a comedy of errors. Crit Care Med.2001;;29:1–4. [PubMed]
38. Al-Kharrat T, Zarich S, Amoateng-Adjepon Y. Analysis of observer variability in measurement of pulmonary artery occlusion pressure. Am J Resp Crit Care Med. 1999;;160:415–420. [PubMed]
39. Mutoh T, Kazumata K, Ajiki M, et al. Goal-directed fluid management by bedside transpulmonary hemodynamic monitoring after subarachnoid hemorrhage. Stroke. 2007;;38:3218–3224. [PubMed]
40. Takanishi DM, Jr, Biuk-Aghai EN, Yu M, et al. The availability of circulating blood volume values alters fluid management in critically ill surgical patients. Am J Surg. 2009;;197:232–237. [PubMed]
41. Katz SD. Blood volume assessment in the diagnosis and treatment of chronic heart failure. Am J Med Sci. 2007;;334:47–52. [PubMed]
42. Hoeft A, Schorn B, Weyland A, et al. Bedside assessment of intravascular volume status in patients undergoing coronary bypass surgery. Anesthesiology. 1994;;81:76–86. [PubMed]
43. Inoue T, Okabayashi K, Ohtani M, et al. Circulating blood volume in burn resuscitation.Hiroshima J Med Sci. 2002;;51:7–13. [PubMed]
44. Murphy EH, Arko FR, Trimmer CK, et al. Volume associated dynamic geometry and spatial orientation of the inferior vena cava. J Vasc Surg. 2009;;50:835–842. [PubMed]
45. Stawicki SP, Braslow BM, Panebianco NL, et al. Intensivist use of hand-carried ultrasonography to measure IVC collapsibility in estimating intravascular volume status: correlations with CVP. J Am Coll Surg. 2009;;209:55–61. [PubMed]
46. Brennan JM, Ronan A, Goonewardena S, et al. Handcarried ultrasound measurement of the inferior vena cava for assessment of intravascular volume status in the outpatient hemodialysis clinic. Clin J Am Soc Nephrol. 2006;;1:749–753. [PubMed]
47. Metry G, Wegenius G, Wikström B, et al. Lung density for assessment of hydration status in hemodialysis patients using the computed tomographic densitometry technique. Kidney Int.1997;;52:1635–1644. [PubMed]
48. Katzarski KS, Nisell J, Randmaa I, et al. A critical evaluation of ultrasound measurement of inferior vena cava diameter in assessing dry weight in normotensive and hypertensive hemodialysis patients. Am J Kidney Dis. 1997;;30:459–465. [PubMed]
49. Gottdiener JS, Kitzman DW, Aurigemma GP, et al. Left atrial volume, geometry, and function in systolic and diastolic heart failure of persons > or =65 years of age (the cardiovascular health study)Am J Cardiol. 2006;;97:83–89. [PubMed]
50. Yilmaz M, Erol MK, Cetinkaya R, et al. Effect of haemodialysis on left atrial mechanical function in patients with chronic renal failure. Acta Cardiol. 2002;;57:257–260. [PubMed]
51. Wallace DJ, Allison M, Stone MB. Inferior vena cava percentage collapse during respiration is affected by the sampling location: an ultrasound study in healthy volunteers. Acad Emerg Med.2010;;17:96–99. [PubMed]