
| Author | Affiliation |
|---|---|
| Edmund S.H. Kwok, MD, MHA, MSc | University of Ottawa, Department of Emergency Medicine, Ottawa, Ontario, Canada; Ottawa Hospital Research Institute, Ottawa, Ontario, Canada |
| Glenda Clapham, BA | University of Ottawa, Department of Emergency Medicine, Ottawa, Ontario, Canada |
| Samantha Calder-Sprackman, MD | University of Ottawa, Department of Emergency Medicine, Ottawa, Ontario, Canada; Ottawa Hospital Research Institute, Ottawa, Ontario, Canada |
Introduction
Methods
Results
Discussion
Limitations
Conclusion
ABSTRACT
Introduction
Public health response to the coronavirus 2019 (COVID-19) pandemic has emphasized social distancing and stay-at-home policies. Reports of decreased emergency department (ED) visits in non-epicenters of the outbreak have raised concerns that patients with non-COVID-19 emergencies are delaying or avoiding seeking care. We evaluated the impact of the pandemic on ED visits at an academic tertiary care center.
Methods
We conducted an observational health records review between January 1–April 22, 2020, comparing characteristics of all ED visits between pre- and post-pandemic declaration by the World Health Organization. Measures included triage acuity, presenting complaints, final diagnoses, disposition, and mortality. We further examined three time-sensitive final diagnoses: stroke; sepsis; and acute coronary syndrome (ACS).
Results
In this analysis, we included 44,497 ED visits. Average daily ED visits declined from 458.1 to 289.0 patients/day (−36.9%). For the highest acuity triaged patients there was a drop of 1.1 patients/day (−24.9%). Daily ED visits related to respiratory complaints increased post-pandemic (+14.1%) while ED visits for many other complaints decreased, with the greatest decline in musculoskeletal (−52.5%) and trauma (−53.6%). On average there was a drop of 1.0 patient/day diagnosed with stroke (−17.6%); a drop of 1.6 patients/day diagnosed with ACS (−49.9%); and no change in patients diagnosed with sepsis (pre = 2.8 patients/day; post = 2.9 patients/day).
Conclusion
Significant decline in ED visits was observed immediately following formal declaration of the COVID-19 pandemic, with potential for delayed/missed presentations of time-sensitive emergencies. Future research is needed to better examine long-term clinical outcomes of the decline in ED visits during pandemics.
INTRODUCTION
On March 22, 2020, the World Health Organization (WHO) designated the outbreak of a novel coronavirus (SARS-CoV-2) first reported in January 2020 as an international pandemic causing coronavirus disease 2019 (COVID-19).1-3 COVID-19 was thought to spread from person-to-person by respiratory droplets and contaminated surfaces or fomites, with asymptomatic transmission suspected.4-6 In an effort to “flatten the curve” public health response to COVID-19 encouraged social distancing, self-isolation, and stay-at-home policies, employing media campaigns that highlighted the experiences in Lombardy, Italy, and New York City, NY, where hospitals were overwhelmed by COVID-19.7
Shortly after the WHO’s pandemic declaration, anecdotal reports of emergency department (ED) visits plummeting occurred in many cities that were not overwhelmed by COVID-19 outbreaks. At our own tertiary care hospital in Canada’s capital, Ottawa, we observed daily ED visits drop to as low as ~50% compared to the same time period the prior year. At our center, confirmed COVID-19 admissions were limited (as of April 22, 2020, Ottawa had eight COVID-19 patients in intensive care, and 22 COVID-19 patients on inpatient wards8) and had not overwhelmed acute hospital capacity. The sudden drop in ED visits caused concern that patients with non-COVID-19 emergencies were delaying or avoiding seeking appropriate ED care during this pandemic.
We sought to rapidly review the immediate impact of the COVID-19 pandemic on ED visits at a tertiary care hospital not overwhelmed with COVID-19 admissions. We aimed to characterize and compare trends of pre- vs post-COVID-19 ED populations in terms of the Canadian Triage Acuity Score (CTAS) level, presenting complaints, discharge/admission diagnoses, and patient flow metrics. In addition, we sought to examine the effect of the pandemic on ED visits and mortality rates of three time-sensitive diagnoses: stroke; sepsis; and acute coronary syndrome (ACS).
METHODS
Design
We conducted a retrospective observational electronic health records (EHR) review.
Setting
The Ottawa Hospital (TOH) is a 1202-bed academic tertiary care hospital with the ED receiving >174,000 visits per year. It is the main regional referral center for specialized services including trauma, stroke, neurosurgical, thoracic, oncological, and vascular emergencies. Adjacent to TOH is the regional cardiac center, the Ottawa Heart Institute, which receives prehospital Code STEMI (ST-elevation myocardial infarct) cases bypassing TOH EDs. It was not included in this study.
Patient Population and Time Period
We included all patients presenting to TOH ED between January 1, 2019–April 22, 2020. We excluded all patients who were “direct-to-service,” which included patients already assessed at another hospital/outpatient clinic being transferred directly for admission to a specialized service at TOH. We used the date March 11, 2020, when the WHO declared COVID-19 to be an official pandemic, to define pre- and post-pandemic periods.
Measures
We collected ED visit characteristics including patient demographics, presenting complaints, final diagnoses, and disposition. Mortality rates were observed for the entirety of patients’ ED or in-patient stays. We also collected data on patients’ CTAS, which is a triage tool used internationally to allow EDs and their staffs to prioritize patient care requirements upon arrival to the ED. Levels of CTAS range from 1 (most acute) to 5 (least acute).9
For presenting complaints and final diagnoses, two authors independently reviewed all primary chief complaints listed for each ED visit, as well as final discharge/admission diagnoses, and assigned them into the most appropriate categories based on symptom- or specialty-related headings. Any discrepancies were resolved with discussion between the reviewers, with arbitration by the third author if necessary. We used a similar process to critically review all discharge/admission diagnoses for three time-sensitive emergencies: stroke; sepsis; and ACS.
Population Health Research Capsule
What do we already know about this issue?
Responses to the coronavirus disease 2019 (COVID-19) pandemic have emphasized social distancing and stay-at-home policies with subsequent reports of decreased emergency department (ED) visits.
What was the research question?
We evaluated the impact of the pandemic on ED visits at a center not overwhelmed with COVID-19 admissions.
What was the major finding of the study?
Decline in ED visits including time-sensitive emergencies was observed after declaration of a pandemic.
How does this improve population health?
Public health responses to pandemics affect ED visit behaviors. Further research is needed to examine long-term clinical outcomes of the decline in ED visits.
Data Collection
The Ottawa Hospital transitioned to Epic EHR (Epic Systems Corporation, Verona, WI) in June 2019. A quality improvement coordinator with Epic-reporting expertise pulled the required data elements from the EHR using integrated reporting functionalities and entered the data into a Microsoft Excel database (Microsoft Corporation, Redmond, WA) for further analysis. We retrieved historical patient volume data from TOH’s previous performance-measurement data warehouse.
Data Analysis
We present patient demographics, CTAS acuity, presenting complaints, final diagnoses, process measures, time metrics, and mortality using descriptive statistics. For comparison between pre- and post-pandemic periods, we examined the total number of ED visits within each time period, as well as the number of ED visits per day. We plotted relevant results temporally to provide visual trends over time, with annotation to provide context around specific milestones. We assumed normal distributions and performed statistical analysis using Student’s two-sided t-test to compare pre- vs post-pandemic periods, and chi-squared test for comparison of proportions, with P-value of <0.05 considered to be significant.
Ethical Considerations
We obtained research ethics approval for this project by the Ottawa Hospital Research Institute Research Ethics Board, dated Apr 24, 2020, protocol ID# 20200262-01H.
RESULTS
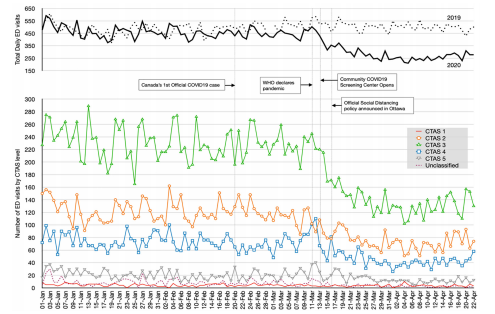
A total of 44,497 ED visits met our inclusion/exclusion criteria during the study period (32,068 in pre-pandemic; 12,429 in post-pandemic) (Table 1). The mean age was 49.9 years old with 46.5% being male patients. Overall, average daily ED visits declined from 458.1 patients/day in the pre-pandemic period, to 289.0 patients/day in the post-pandemic period (−36.9%). There was a significant decrease in the proportion of patients with incomplete ED visits (ie, leaving without being seen, etc), from 8.6% in the pre-pandemic period to only 3.5% in the post-pandemic period.
| All Patients | Total # of ED visits | Average # of ED visits per day | |||||
|---|---|---|---|---|---|---|---|
|
|
|
||||||
| Pre-pandemic | Post-pandemic | P-value | Pre-pandemic | Post-pandemic | P-value | ||
| Total ED Visits (N) | 44,497 | 32,068 | 12,429 | 458.1 | 289.0 | ||
| Mean Age (yrs) | 49.9 | 49.8 | 50.2 | <0.05 | |||
| Gender, n(%) | |||||||
| Male | 20,678(46.5) | 14,701(45.8) | 59,77(48.1) | <0.05 | 210.0 | 139.0 | <0.05 |
| Female | 23,761(53.5) | 17,326(54.0) | 64,35(51.8) | <0.05 | 247.5 | 149.7 | <0.05 |
| No gender documented | 58(0.0) | 41(0.0) | 17(0.0) | 1 | 0.6 | 0.4 | 0.22 |
| CTAS acuity level, n(%) | |||||||
| 1 | 450(1.0) | 308(1.0) | 142(1.1) | 0.35 | 4.4 | 3.3 | <0.05 |
| 2 | 11,767(26.4) | 8,513(26.5) | 3,254(26.2) | 0.52 | 121.6 | 75.7 | <0.05 |
| 3 | 22,325(50.2) | 16,112(50.2) | 6,213(50.0) | 0.71 | 230.2 | 144.5 | <0.05 |
| 4 | 7,153(16.1) | 5,103(15.9) | 2,050(16.5) | 0.12 | 72.9 | 47.7 | <0.05 |
| 5 | 2,064(4.6) | 1,445(4.5) | 619(5.0) | <0.05 | 20.6 | 14.4 | <0.05 |
| No acuity documented | 738(1.7) | 587(1.8) | 151(1.2) | <0.05 | 8.4 | 3.5 | <0.05 |
| Chief Presenting Complaint, n(%) | |||||||
| Abdominal/Gastrointestinal | 6,735(15.1) | 4,972(15.5) | 1,763(14.2) | <0.05 | 71.0 | 41.0 | <0.05 |
| Cardiac | 5,315(11.9) | 3,842(12.0) | 1,473(11.9) | 0.77 | 54.9 | 34.3 | <0.05 |
| Infectious | 1,034(2.3) | 725(2.3) | 309(2.5) | 0.21 | 10.4 | 7.2 | <0.05 |
| Mental Health | 2,651(6.0) | 1,865(5.8) | 786(6.3) | <0.05 | 26.6 | 18.3 | <0.05 |
| Musculoskeletal | 4,403(9.9) | 3,408(10.6) | 995(8.0) | <0.05 | 48.7 | 23.1 | <0.05 |
| Neurological | 3,820(8.6) | 2,772(8.6) | 1,048(8.4) | 0.50 | 39.6 | 24.4 | <0.05 |
| Obstetrical/Gynecological | 885(2.0) | 650(2.0) | 235(1.9) | 0.50 | 9.3 | 5.5 | <0.05 |
| Other | 5,530(12.4) | 4,045(12.6) | 1,485(11.9) | <0.05 | 57.8 | 34.5 | <0.05 |
| Respiratory | 5,593(12.6) | 3,288(10.3) | 2,305(18.5) | <0.05 | 47.0 | 53.6 | <0.05 |
| Trauma/Environmental | 5,402(12.1) | 4,204(13.1) | 1,198(9.6) | <0.05 | 60.1 | 27.9 | <0.05 |
| Urological | 1,153(2.6) | 853(2.7) | 300(2.4) | 0.08 | 12.2 | 7.0 | <0.05 |
| Vascular | 67(0.2) | 45(0.1) | 22(0.2) | <0.05 | 0.6 | 0.5 | 0.43 |
| General Weakness/Medical | 1,852(4.2) | 1,359(4.2) | 4,93(4.0) | 0.34 | 19.4 | 11.5 | <0.05 |
| Undefined | 57(0.1) | 40(0.1) | 17(0.1) | 1 | 0.6 | 0.4 | 0.18 |
| Final ED Discharge / Admission Diagnosis, n(%) | |||||||
| Abdominal/Gastrointestinal | 5,367(12.1) | 3,894(12.1) | 1,473(11.9) | 0.56 | 55.6 | 34.3 | <0.05 |
| Cardiac | 4,294(9.7) | 3,047(9.5) | 1,248(10.0) | 0.11 | 43.5 | 29.0 | <0.05 |
| General Medical | 1,563(3.5) | 1,112(3.5) | 451(3.6) | 0.61 | 15.9 | 10.5 | <0.05 |
| Hematological | 434(1.0) | 337(1.1) | 97(0.8) | <0.05 | 4.8 | 2.3 | <0.05 |
| Infectious | 6,732(15.1) | 4244(13.2) | 2,488(20.0) | <0.05 | 60.6 | 57.9 | <0.05 |
| Mental Health | 2,168(4.9) | 1,489(4.6) | 679(5.5) | <0.05 | 21.3 | 15.8 | <0.05 |
| Musculoskeletal | 8,337(18.7) | 6,465(20.2) | 1,872(15.1) | <0.05 | 92.4 | 43.5 | <0.05 |
| Neurological | 3,413(7.7) | 2,502(7.8) | 911(7.3) | 0.08 | 35.7 | 21.2 | <0.05 |
| Obstetrical/Gynecological | 1,086(2.4) | 778(2.4) | 308(2.5) | 0.54 | 11.1 | 7.2 | <0.05 |
| Oncological | 362(0.8) | 264(0.8) | 98(0.8) | 1 | 3.8 | 2.3 | <0.05 |
| Other | 3,225(7.2) | 2,249(7.0) | 976(7.9) | <0.05 | 32.1 | 22.7 | <0.05 |
| Respiratory | 2,109(4.7) | 1,357(4.2) | 752(6.1) | <0.05 | 19.4 | 17.5 | 0.07 |
| Toxicological | 615(1.4) | 404(1.3) | 211(1.7) | <0.05 | 5.8 | 4.9 | 0.10 |
| Urological | 1,199(2.7) | 874(2.7) | 325(2.6) | 0.56 | 12.5 | 7.6 | <0.05 |
| Vascular | 183(0.4) | 113(0.4) | 70(0.6) | <0.05 | 1.6 | 1.6 | 0.96 |
| Undefined | 3,410 (7.7) | 2,939(9.2) | 471(3.8) | <0.05 | 42.0 | 11.0 | <0.05 |
| ED Disposition, n(%) | |||||||
| Admission to hospital | 7,186(16.1) | 4,910(15.3) | 2,276(18.3) | <0.05 | 70.1 | 52.9 | <0.05 |
| Discharge from ED | 34,118(76.7) | 24,398(76.1) | 9,720(78.2) | <0.05 | 348.5 | 226.0 | <0.05 |
| Incomplete (LBT, LWBS, LAMA, eloped, etc) | 3,193(7.2) | 2,760(8.6) | 433(3.5) | <0.05 | 39.4 | 10.0 | <0.05 |
| Time Metrics, hr min (mean) | |||||||
| Physician initial assessment | 2:31 | 3:10 | 1:10 | <0.05 | |||
| ED length of stay for pts discharged from the ED | 5:40 | 6:18 | 4:06 | <0.05 | |||
| ED length of stay for pts admitted from the ED | 19:04 | 22:44 | 11:09 | <0.05 | |||
| Inpatient hospital length of stay | 207:49 | ||||||
ED, emergency department; LBT, left before triage; LWBS, left without being seen; LAMA, left against medical advice; pts, paients; hr, hours; min, minutes, CTAS, Canadian Triage Acuity Scale.
Relative CTAS levels distribution remained stable throughout the study period, with the exception of an increase in the proportion of CTAS 5 patients (pre: 4.5%, post: 5.0%). For the most severe and critical CTAS 1 acuity patients, on average there was a significant drop of 1.1 patients/day (−24.9%) in the post-pandemic period. For the second most critical CTAS 2 acuity patients, on average there was a significant drop of 45.9 patients/day (−37.7%). There was a sharp drop in overall ED visits immediately following the WHO declaration of a pandemic, followed by a second acute sustained drop in ED visits immediately after the city’s local announcement of social distancing policies (Figure 1).
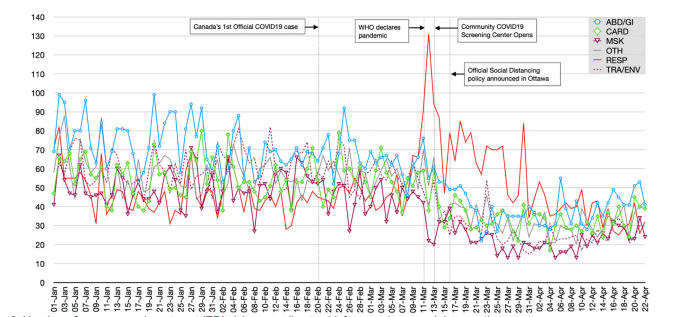
The distribution of chief complaints presenting to the ED remained similar between the pre-/post-pandemic periods except for a number of categories (Table 1). The only categories that increased in proportion relative to all presenting complaints were respiratory (pre: 10.3%, post: 18.5%), mental health (pre: 5.8%, post: 6.3%), and vascular (pre: 0.1%, post: 0.2%). The top five presenting complaint categories with the greatest absolute numbers of decline in average daily ED visits were the following: 1) trauma/environmental with a drop of 32.2 patients/day (−53.6%); 2) abdominal pain/gastrointestinal (GI) with a drop of 30.0 patients/day (−42.3%); 3) musculoskeletal with a drop of 25.5 patients/day (−52.5%); 4) other with a drop of 23.3 patients/day (−40.2%); and 5) cardiac with a drop of 20.6 patients/day (−37.6%).
There was a volume decline in all presenting complaint categories except for respiratory complaints, which rose acutely following the WHO declaration of the COVID-19 pandemic (Figure 2). At its peak on March 12, 2020, there were 131 ED visits related to respiratory complaints (27.6% of all ED visits) that day. There was a subsequent drop in patients presenting with respiratory complaints two days later, coinciding with the opening of Ottawa’s first community COVID-19 screening center. By the end of March, all complaints had sustained decline in volume compared to pre-pandemic levels.
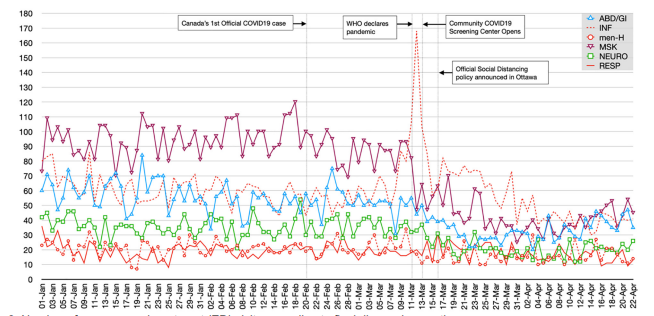
The distribution of final diagnoses also changed following the WHO pandemic declaration. Diagnoses related to respiratory complaints increased from 4.2% to 6.1% of all diagnoses; infectious increased from 13.2% to 20.0%; and mental health increased from 4.6% to 5.5%. The top five final diagnosis categories with the greatest absolute numbers of decline in average daily ED visits were the following: 1) musculoskeletal with a drop of 48.8 patients/day (−52.9%); 2) abdominal pain/GI with a drop of 21.4 patients/day (−38.4%); 3) neurological with a drop of 14.6 patients/day (−40.7%); 4) cardiac with a drop of 14.5 patients/day (−33.3%); and 5) other with a drop of 9.4 patients/day (−29.4%).
Patients diagnosed with infection-related issues spiked immediately after WHO’s declaration of the COVID-19 pandemic, peaking at 168 ED visits (35.4%) on March 12, 2020 (Figure 3). The number of patients diagnosed with mental health and respiratory-related issues appeared to be stable over time. Diagnoses related to musculoskeletal, abdominal/GI, and neurological issues had sustained declines in the post-pandemic study period.
There was a significant increase in overall mortality rate for all ED visits in the post-pandemic period (pre: 1.1%, post: 1.6%), but no difference in mortality within the three subgroups of stroke, ACS, and sepsis (Table 2). There was a significant drop in average daily ED visits for stroke (5.8 patients/day in pre-pandemic; 4.8 patients/day in post-pandemic) and ACS (3.3 patients/day in pre-pandemic; 1.7 patients/day in post-pandemic), but no significant change in average daily number of ED patient diagnoses with sepsis (2.8 patients/day in pre-pandemic; 2.9 patients/day in post-pandemic).
| All Patientsn(%) | Total # of ED visits n(%) | Average # of ED visits per day | |||||
|---|---|---|---|---|---|---|---|
|
|
|
||||||
| Pre-pandemic | Post-pandemic | P-value | Pre-pandemic | Post-pandemic | P-value | ||
| All Diagnoses | 44,497(100) | 32,068(100) | 12,429(100) | 458.1 | 289.0 | <0.05 | |
| Overall Mortality | 550(1.2) | 354(1.1) | 196(1.6) | <0.05 | 5.1 | 4.6 | 0.28 |
| in ED | 54(0.1) | 37(0.1) | 17(0.1) | 1 | 0.5 | 0.4 | 0.32 |
| in Hospital | 496(1.1) | 317(1.0) | 179(1.4) | <0.05 | 4.5 | 4.2 | 0.40 |
| Stroke | 613(100) | 407(100) | 206(100) | 5.8 | 4.8 | <0.05 | |
| Overall Mortality | 59(9.6) | 38(9.3) | 21(10.2) | 0.72 | 0.5 | 0.5 | 0.69 |
| in ED | 5(0.8) | 4(1.0) | 1(0.5) | 0.52 | 0.1 | 0.0 | 0.73 |
| in Hospital | 54(8.8) | 34(8.4) | 20(9.7) | 0.28 | 0.5 | 0.5 | 0.64 |
| ACS | 306(100) | 234(100) | 72(100) | 3.3 | 1.7 | <0.05 | |
| Overall Mortality | 39(22.5) | 26(11.1) | 13(18.1) | 0.12 | 0.4 | 0.3 | 0.50 |
| in ED | 26(8.5) | 17(7.3) | 9(12.5) | 0.17 | 0.2 | 0.2 | 0.71 |
| in Hospital | 13(4.2) | 9(3.8) | 4(5.6) | 0.51 | 0.1 | 0.1 | 0.57 |
| Sepsis | 316(100) | 193(100) | 123(100) | 2.8 | 2.9 | 0.76 | |
| Overall Mortality | 36(11.4) | 22(11.4) | 14(11.4) | 1 | 0.3 | 0.3 | 0.92 |
| in ED | 3(0.9) | 2(1.0) | 1(0.8) | 0.86 | 0.0 | 0.0 | 0.87 |
| in Hospital | 33(10.4) | 20(10.4) | 13(10.6) | 0.95 | 0.3 | 0.3 | 0.87 |
*“in ED,” mortalities within the emergency department; “in Hospital,” after admission into hospital.
ACS, acute coronary syndrome.
Patient flow metrics significantly improved in the post-pandemic period. Physician initial assessment, defined as time from patient arrival to the ED to the time when first seen by a physician, improved by one hour (hr) and 50 minutes (min) (pre: 3hr 00 min, post: 1hr 10 min). Average ED length of stay for both discharged and admitted patients also significantly improved by 2 hr 12 min, and 11 hr 35 min, respectively. Finally, average total hospital length of stay for admitted patients decreased by 21 hr 39 min (pre: 214 hr 35 min, post: 192 hr 54 min).
DISCUSSION
Following WHO’s declaration of COVID-19 as an official pandemic, we found a significant drop in overall visits to our ED. Patients presenting to the ED with respiratory and infectious issues sharply increased, while visits related to many other complaints decreased. Musculoskeletal- and trauma-related complaints appear to be the most impacted; this may in part have been due to social distancing and stay-at-home public health messaging resulting in fewer outdoor activities and vehicles on the road. It is important to note the drop in absolute numbers of patients who presented to the ED with potentially life-threatening CTAS 1 and 2 acuities (−47 patients/day; a 37.3% decline), strokes (−1.0 patient/day; a 17.6% decline), and myocardial infarction (MI) (−1.6 patients/day; a 49.9% decline). This a concerning proportion of patients with time-sensitive emergencies who were not presenting to the ED immediately following the pandemic declaration, given that there are no known physiological reasons for the prevalence of these conditions to be lower.
Interestingly, the number of patients diagnosed with sepsis appears to have remained stable, which may reflect the fact that septic patients often present to the ED via prehospital emergency medical services (EMS), and thus may be less affected by an individual’s fear of coming to the ED.10,11 Among patient groups whose volume of ED visits did not appear to be affected by the pandemic were those presenting with mental health-related issues. Anecdotally, physicians in our group reported seeing escalating cases of anxiety-related cases due to the COVID-19 pandemic; this may have been further augmented by closure of regular mental health community supports. Finally, we noticed significant improvements in all ED crowding and flow metrics. This is likely a result of the drop in hospital occupancy and improved internal operations after non-essential healthcare services were ceased during the pandemic period.
A decline in the number of non-COVID-19 patients presenting for emergency care has been anecdotally observed elsewhere, with numerous news media articles citing concerns of unintended consequences in North America.12,13 A regional hospital in Germany reported total ED visits to their center dropped by 23% within four weeks of admitting their first COVD-19 patient.14 Although the article did not report details on acuity levels, presenting complaints, or clinical outcomes, it did note a respective 53% and 30% decline in the hospital’s cardiology- and neurology-related ED populations. The authors postulated that these unintended consequences may have been a result of individuals’ extreme reactions to dread risks, defined as “low-probability events in which many people are killed at the same time,” such as the COVID-19 pandemic. Wong et al described a similar drop in overall ED visits in a community hospital in California, and interviews with patients confirmed fear as the overarching theme affecting decisions to avoid ED visits.15 There are few other studies examining the ED population as a whole, although more reports are being published with respect to how the COVID-19 pandemic may be affecting specific diagnoses such as acute MIs and strokes.16,17
Our findings also support the risk-avoidance behavior of ED patients with non-COVID-19 related issues in the setting of this pandemic. However, we did not power the study to robustly examine mortality rates for all subgroups of patients (due to limited time frame), and it is difficult to fully understand meaningful clinical impact. We did note an increased overall mortality rate in our study population, but this may simply be a reflection of the drop in non-emergent ED visits in the post-pandemic period rather than a true increase in severity of disease. Of note, our national statistics agency StatsCan found no increase in “excess deaths” between January 1–March 31, 2020 when compared to the same time period in the previous year.18 It is very difficult to accurately attribute any potential delayed/avoided ED visit directly to patients’ fears and behaviors in response to the pandemic. Future studies are needed to help identify this subgroup of patients who delayed ED presentation as a result of the pandemic, and to further examine relevant clinical consequences.
LIMITATIONS
There are a number of important limitations to our study. Firstly, this was a single-center study in North America and may not reflect nuances around ED visit behaviors of patients in other healthcare systems. Although our center is the regional referral center for specialized emergencies including stroke code bypass, STEMI cases identified in the field by EMS are redirected to a separate cardiac center and thus were not included in this study. As a result, our findings may underestimate the potential impact on ED visits related to cardiac and ACS presentations noted in our findings. Secondly, our findings reflect a center with relatively low COVID-19 burden in terms of admissions and critical care resources, and thus should be interpreted in relation to similar centers that were not epicenters of the COVID-19 pandemic. Thirdly, the pre-/post-design was limited by our institution’s recent switch from paper charts to full Epic EHR; thus, we were unable to directly compare data from the same time period from previous year(s) without extensive manual chart review. However, we do not believe there are any seasonal variation factors between January-March vs March-April that would significantly invalidate our data. Finally, given the nature of a timely rapid review our study period was limited to just over a month past the WHO declaration of pandemic status. Future research with more detailed individual chart reviews are needed to assess delayed findings and clinical significance.
CONCLUSION
Significant decline in ED visits was observed immediately following declaration of global pandemic status, with potential for delayed/missed presentations of time-sensitive emergencies. We believe it is important for public health communication strategies to take our findings into account, as messaging regarding staying at home may have created potential extreme reactions to dread risks. Future research is needed to examine long-term and impactful clinical outcomes related to significant decline in ED visits during pandemics.
Footnotes
Section Editor: Gary Johnson, MD
Full text available through open access at http://escholarship.org/uc/uciem_westjem
Address for Correspondence: Edmund S.H. Kwok, MD, MHA, MSc, The Ottawa Hospital, Department of Emergency Medicine, 1053 Carling Avenue, E-Main, Room EM-206, Box 227, Ottawa, Ontario, Canada K1Y 4E9. Email: ekwok@toh.ca. 7 / 2021; 22:851 – 859
Submission history: Revision received August 27, 2020; Submitted March 15, 2021; Accepted February 26, 2021
Conflicts of Interest: By the WestJEM article submission agreement, all authors are required to disclose all affiliations, funding sources and financial or management relationships that could be perceived as potential sources of bias. No author has professional or financial relationships with any companies that are relevant to this study. There are no conflicts of interest or sources of funding to declare.
REFERENCES
1. Statement on the second meeting of the International Health Regulations (2005) Emergency Committee regarding the outbreak of novel coronavirus (2019-nCoV). 2020. Available at: https://www.who.int/news-room/detail/30-01-2020-statement-on-the-second-meeting-of-the-international-health-regulations-(2005)-emergency-committee-regarding-the-outbreak-of-novel-coronavirus-(2019-ncov). Accessed Apr 20, 2020.
2. Naming the coronavirus disease (COVID-2019) and the virus that causes it. Available at: https://www.who.int/emergencies/diseases/novel-coronavirus-2019/technical-guidance/naming-the-coronavirus-disease-(covid-2019)-and-the-virus-that-causes-it. Accessed Apr 20, 2020.
3. WHO Director-General’s opening remarks at the media briefing on COVID-19 – 11 March 2020. 2020. Available at: https://www.who.int/dg/speeches/detail/who-director-general-s-opening-remarks-at-the-media-briefing-on-covid-19-11-march-2020. Accessed March 20, 2020.
4. Q&A on coronaviruses. 2020. Available at: https://www.who.int/news-room/q-a-detail/q-a-coronaviruses. Accessed Apr 20, 2020.
5. 2019 Novel Coronavirus (2019-nCoV) transmission. 2020. Available at: https://www.cdc.gov/coronavirus/2019-ncov/about/transmission.html. Accessed April 20, 2020.
6. Bai Y, Yao L, Wei T, et al. Presumed asymptomatic carrier transmission of COVID-19. JAMA. 2020;323(14):1406-7.
7. Elliott JK. Flatten the curve: how one chart became a rallying cry against coronavirus. Global News Canada. 2020. Available at: https://globalnews.ca/news/6665558/coronavirus-flatten-the-curve/. Accessed May 10, 2020.
8. Ottawa COVID Projections. Available at: https://613covid.ca. Accessed April 22, 2020.
9. Bullard M, Musgrave E, Warren D, et al. Revisions to the Canadian Emergency Department Triage and Acuity Scale (CTAS) Guidelines 2016. CJEM. 2017;19(S2):S18-27.
10. Groenewoudt M, Roest AA, Leijten FM, Stassen PM. Septic patients arriving with emergency medical services: a seriously ill population. Eur J Emerg Med. 2014;21(5):330-5.
11. Wang HEW, Jones AR, Donnelly JP. Revised national estimates of emergency department visits for sepsis in the United States. Crit Care Med. 2017;45(9):1443-9.
12. Krumholz HW. Where have all the heart attacks gone?. New York Times. 2020. Available at: https://www.nytimes.com/2020/04/06/well/live/coronavirus-doctors-hospitals-emergency-care-heart-attack-stroke.html. Accessed May 9, 2020.
13. Mitra G. Emergency department visits are down – and this is not a good thing. CBC News. 2020. Available at: https://www.cbc.ca/news/canada/british-columbia/emergency-department-visits-are-down-and-this-is-not-a-good-thing-1.5537073. Accessed May 9, 2020.
14. Deerberg-Wittram J, Knothe C. Do not stay at home: We are ready for you. NEJM Catalyst. 2020. Available at: https://catalyst.nejm.org/doi/full/10.1056/CAT.20.0146. Accessed May 20, 2020.
15. Wong LE, Hawkins JE, Langness S, et al. Where are all the patients? Addressing COVID-19 fear to encourage sick patients to seek emergency care. NEJM Catalyst. 2020. Available at: https://catalyst.nejm.org/doi/full/10.1056/CAT.20.0193. Accessed May 20, 2020.
16. Solomon MD, McNulty EJ, Rana JS, et al. The COVID-19 pandemic and the incidence of acute myocardial infarction. N Engl J Med. 2020;383(7):691-3.
17. Siegler JE, Heslin ME, Thau L, et al. Falling stroke rates during COVID-19 pandemic at a comprehensive stroke center: [Cover title]: Falling stroke rates during COVID-19. J Stroke Cerebrovasc Dis. 2020;29(8):104953.
18. Provisional death counts and excess mortality, January to March 2019 and January to March 2020. 2020. Available at: https://www150.statcan.gc.ca/n1/daily-quotidien/200513/dq200513d-eng.htm. Accessed May 15, 2020.