
| Author | Affiliation |
|---|---|
| Janet L. Gamble, PhD | United States Environmental Protection Agency, Office of Research and Development, National Center for Environmental Assessment, Washington, DC |
| Jeremy J. Hess, MD, MPH | Emory University School of Medicine, Department of Emergency Medicine and Department of Environmental Health, Emory Rollins School of Public Health, Atlanta, Georgia |
ABSTRACT
Introduction:
To investigate relationships between ambient temperatures and violent crimes to determine whether those relationships are consistent across different crime categories and whether they are best described as increasing linear functions, or as curvilinear functions that decrease beyond some temperature threshold. A secondary objective was to consider the implications of the observed relationships for injuries and deaths from violent crimes in the context of a warming climate. To address these questions, we examined the relationship between daily ambient temperatures and daily incidents of violent crime in Dallas, Texas from 1993–1999.
Methods:
We analyzed the relationships between daily fluctuations in ambient temperature, other meteorological and temporal variables, and rates of daily violent crime using time series piece-wise regression and plots of daily data. Violent crimes, including aggravated assault, homicide, and sexual assault, were analyzed.
Results:
We found that daily mean ambient temperature is related in a curvilinear fashion to daily rates of violent crime with a positive and increasing relationship between temperature and aggravated crime that moderates beyond temperatures of 80°F and then turns negative beyond 90°F.
Conclusion:
While some have characterized the relationship between temperature and violent crime as a continually increasing linear function, leaving open the possibility that aggravated crime will increase in a warmer climate, we conclude that the relationship in Dallas is not linear, but moderates and turns negative at high ambient temperatures. We posit that higher temperatures may encourage people to seek shelter in cooler indoor spaces, and that street crime and other crimes of opportunity are subsequently decreased. This finding suggests that the higher ambient temperatures expected with climate change may result in marginal shifts in violent crime in the short term, but are not likely to be accompanied by markedly higher rates of violent crime and associated increased incidence of injury and death. Additional studies are indicated, across cities at varying latitudes that experience a range of daily ambient temperatures.
INTRODUCTION
Violent crime is a leading cause of morbidity and mortality in the United States and among the leading causes of death in young people. In 2009, violent crime incidence was 429.4 per 100,000 population (1.32 million total).1 Aggravated assaults comprise 61.2% of violent crimes reported to law enforcement; the remainder includes robbery (31.0%), forcible rape (6.7%), and murder (1.2%).1 Approximately 21% of annual aggravated assaults result in physical injury requiring emergency treatment. Of injured victims, 49% are under the age of 19 and 75% are under the age of 35. In 2008, 542,280 violent crime victims required medical care, 56% of which was provided at a doctor’s office, hospital, emergency department or urgent care clinic.2 In 1996, the Justice Department estimated that annual losses from homicides alone totaled $700 million in medical costs, $32.7 billion in other tangible costs, and $60 billion in quality of life losses (equivalent to $1.1 billion, $51.2 billion, and $94 billion respectively in 2011 inflation-adjusted dollars).3
The complex origins of violent crime have been widely documented. According to the Federal Bureau of Investigation (FBI), weather is one of many factors affecting its incidence. Others include:
- individual characteristics, e.g., psychological and physiological status and behavioral indicators
- population density, degree of urbanization, and age distribution
- population stability with respect to mobility and transience
- socio-economic conditions
- family cohesiveness and divorce rates
- effectiveness of law enforcement agencies
- citizens’ attitudes toward crime and crime reporting.4
Among the factors that affect the incidence of violent crime, weather is of particular interest due to the observed association between crime and temperature. With climate change, regional mean temperatures in the U.S. are expected to rise between 3.6 and 7.2°F by 2100.5 Such increases may have implications for the incidence of violent crime and associated morbidity and mortality. The likely impacts depend on the nature of the observed relationship between temperature and violent crime and how that might change in a warming climate. Laboratory studies provide evidence of a significant relationship between extreme heat, irritability, and aggressiveness.6 The effects of weather on aggression have been analyzed using the incidence of violent crime as a proxy. Such studies report important temporal correlations with violence. For instance, aggravated assault is more common on weekends and holidays and varies with years, months, seasons, and day length.7–9 Significant associations between violent crime and weather, especially temperature, are also reported.6–17
The nature of the relationship between temperature and violent crime is contested. Anderson6 describes potential functional forms, including a linear function or an inverted-U shaped curvilinear function. The functional form of the relationship is important as it may convey the likely impacts of a warming climate on violent crime. A positive linear relationship suggests increased violence with increasing temperatures, while an inverted U-shaped function suggests moderation or a decrease in violent crime at high temperatures.
Two theories provide conceptual underpinnings for the linear hypothesis. A General Affective Aggression Model hypothesizes that a person’s affect, arousal, and cognitive state are mediated by a number of factors and that the interaction between temperature and violence is a positive linear function.18 The Routine Activity Theory also supports a linear relationship, hypothesizing that crime occurs when there is a motivated offender, a suitable target, and no one to intervene. 9,19 Routine Activity Theory suggests that in warm weather, people congregate in public places with increased social interaction leading to increased violence.
The linear relationship is supported by studies of daily assaults in Chicago and Houston, in two analyses of nation-wide crime databases, in an analysis of non-violent crime in Des Moines and Indianapolis, in a daily time series study of assaults in Charlotte, and in an analysis of aggravated crimes in Cleveland.6,10,13–14,16,20 Harries and Stadler15 also observe a linear relationship for low income populations in Dallas.
Contrary to the linear hypothesis, other studies support a curvilinear, inverted-U shaped relationship. The Negative Affect Escape Model posits that a negative affect and associated violence increase as temperatures increase to an inflection point beyond which violence decreases as a person’s “flight” motivation (i.e., aversion to heat) overrides aggressive motives.12 Similarly, the Social Escape or Avoidance Theory hypothesizes a curvilinear relationship in which people will try to avoid conditions that are consistent with an aggressive affect.7 This theory suggests that on very hot days, people will interact less, decreasing violent crime.
The curvilinear hypothesis was postulated by Baron11 and later confirmed by Baron and Bell.12 From human experiments, they found that high temperatures (above 80°F) inhibit aggression. More recent work by Bell21 found that some of the studies that reject the curvilinear function have no or inadequate data from periods in which temperatures are high enough to suppress aggression. Cohn and Rotton’s7–9analyses of assaults and domestic violence in Minneapolis and assaults in Dallas also supported the inverted-U relationship.
The nature of the relationship is not only of intrinsic importance, but is central to the question of how violent crime-related morbidity and mortality might change in a warming climate. If there is a positive linear relationship, substantial increases may result. Anderson22 finds a causal relationship characterized as an increasing linear function and predicts an increase of approximately 12,000 aggravated assaults and murders in the U.S. annually (a 1.3% increase based on 2001 statistics) for every 1°F increase in mean temperature.23 This could impact healthcare use, direct healthcare costs, and other indirect costs associated with disability, lost productivity, and decrements to quality of life. Insight into the relationship might provide opportunities for improved prediction, which could support prevention and preparedness activities. The objective of this investigation was to clarify the nature of the relationship for violent crime in Dallas and consider implications for climate change.
METHODS
To examine the relationship between temperature and violent crime, we collected daily crime data for aggravated assault, homicide, and rape and attempted rape in Dallas for 1993 to 1999, and daily meteorological data for the same period. We developed baseline regression models for each crime category that maximize and controlled for the explanatory capacity of non-weather, temporal factors. Once the “best-fitting” baseline model was specified, we added weather variables to estimate observed associations.
Crime Date
Daily crime data by offense and ZIP code were reported by the City of Dallas Police Department from January 15, 1993 through December 31, 1999. The study period is limited to those data made available by the Dallas Police Department. Service calls were coded according to the FBI’s Uniform Crime Reporting categories.24 Three crime categories were examined: aggravated assault, homicide, and rape or attempted rape.
Meteorological Data
Meteorological data were based on measurements from Dallas-Fort Worth International Airport, archived by the National Climatic Data Center. Meteorological measures included daily mean, minimum, and maximum temperatures, daily mean relative humidity and dewpoint, and daily precipitation. The effects of a variety of weather variables are examined, including a temperature-humidity index (THI). The THI or apparent temperature was derived from measures of temperature (T) and relative humidity (RH) when T≥80°F and RH≥40.25
Statistical Considerations
Statistical methods used to analyze associations between temperature and violent crime addressed three features of the daily time series: data distribution; potential for serial correlation; and need to control for associations between crime categories and time-varying factors other than weather.26 Models for small numbers of daily counts (such as assaults and murders) had to account for non-Gaussian errors. Although ordinary least squares (OLS) regression provides unbiased estimates, OLS underestimates standard errors for models with small counts, thereby overestimating the coefficient estimates’ significance.27–29 To address this issue, we converted daily crime counts to daily rates per 100,000 (using U.S. Census annualized population estimates for Dallas), then applied OLS regression. We found no significant first-order serial correlation in Durban-Watson tests of regression residuals.26
Modeling
For each crime category, a baseline regression model was fit that maximizes the explanatory capacity (based on adjusted R2) of non-weather, time-varying factors. The time series itself controls potential confounders that are unlikely to vary substantially from day to day (e.g., population, socioeconomic status, etc.). The non-weather covariates selected for the baseline model were similar, if not identical, to variables used in other studies. To control for temporal variation in the dependent variable, we entered dummy variables for years, day of week, holidays, and first day of the month in the model, along with linear and quadratic trends, and measures of daylight and seasons (as these variables may serve as proxies to control for variation in outdoor activity and social interaction).
Once the best-fitting baseline model was specified, we introduced weather variables. Mean ambient temperature was specified as a continuous term; as a 2-day moving average; as 1, 2, and 3-day lagged effects; and by indicators for 10-degree increments to allow for non-linearity in the response surface. We evaluated a piece-wise regression of the effects of mean temperature, using two slope segments with inflection points at 80°F, 85°F, and 90°F. We also evaluated the effects of maximum temperature, RH, and THI.
RESULTS
General Crime and Weather Data
Aggravated assault is the most common violent crime in Dallas. During the study period, an average of 112 daily assault calls were logged (283,916 calls from 1993–1999), plus 0.68 daily calls for murder (1731 total), and 2.46 daily calls for rape and attempted rape (5294 total). Aggravated assaults, murders, and rapes declined significantly from 1993–1999. Daily aggravated assault rates decreased from 11.49 per 100,000 in 1993 to 8.79 in 1999. The daily murder rate per 100,000 was 0.087 in 1993 and fell by half to 0.043 in 1999. The daily rape and attempted rape rate per 100,000 was 0.26 in 1993 and decreased to 0.19 by 1999.
Annual mean temperatures rise during the study period, from 66.6°F in 1993 to 68.9°F in 1999. Overall, daily mean temperatures range from 19°F to 97°F. Annual maximum temperatures also rise during the study period, from 76.4°F to 79.4°F. Daily maximum temperatures range from 23°F to 110°F. Daily precipitation averages 0.10 inches during the study period with a range from no precipitation to as high as 3.9 inches in 1 day. Daily daylight varies from 10.21 to 14.04 hours. As expected, daylight and temperature are highly correlated (r=0.774).
Daily Aggravated Assaults
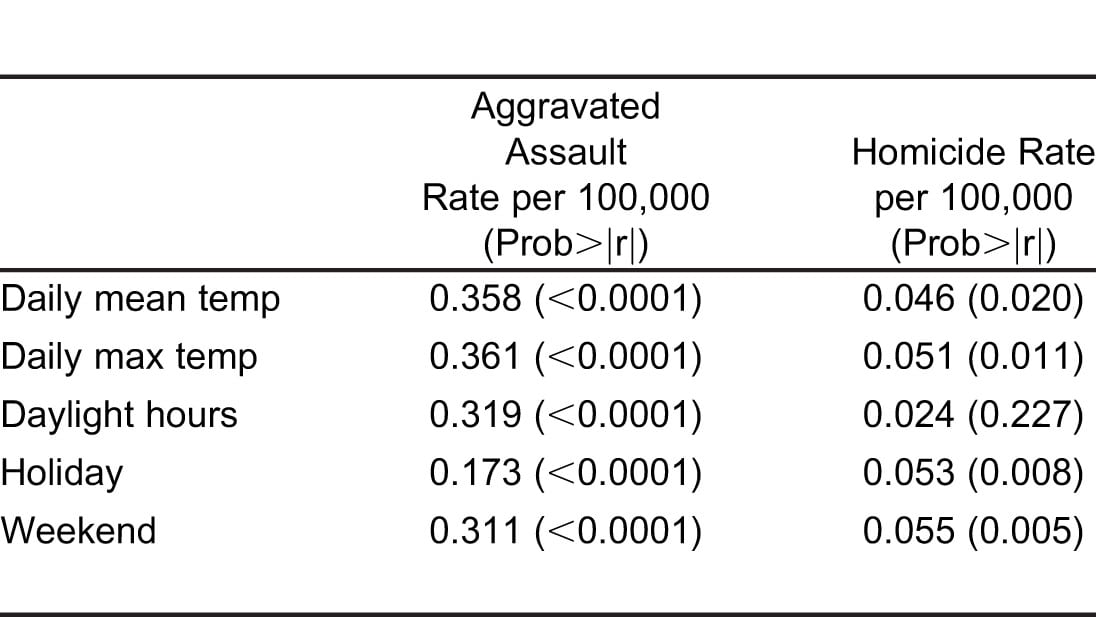
Aggravated assaults account for an average of 111.7 daily calls from 1993–1999. Assaults are most frequent in summer (120.0 per day) and least frequent in winter (100.4) (Table 1). Significantly more assaults occur on the weekend (t=17.09) and on holidays (t=9.22). The first-order correlation of mean temperature and daily assaults is significantly positive (r=0.38, p<0.001) (Table 2). A plot of mean temperature (divided into eight 10-degree increments from <30°F to >90°F) and daily counts of aggravated assaults support a curvilinear hypothesis (Figure 1) with an increasing relationship that moderates beyond 80°F and turns negative beyond 90°F.

![Table 1. Mean daily counts of aggravated crime categories and mean temperatures (standard deviation) [range] by time-varying factors for Dallas, Texas, 1993–1999.](http://westjem.com/wp-content/uploads/2013/01/t1-11746.jpg)
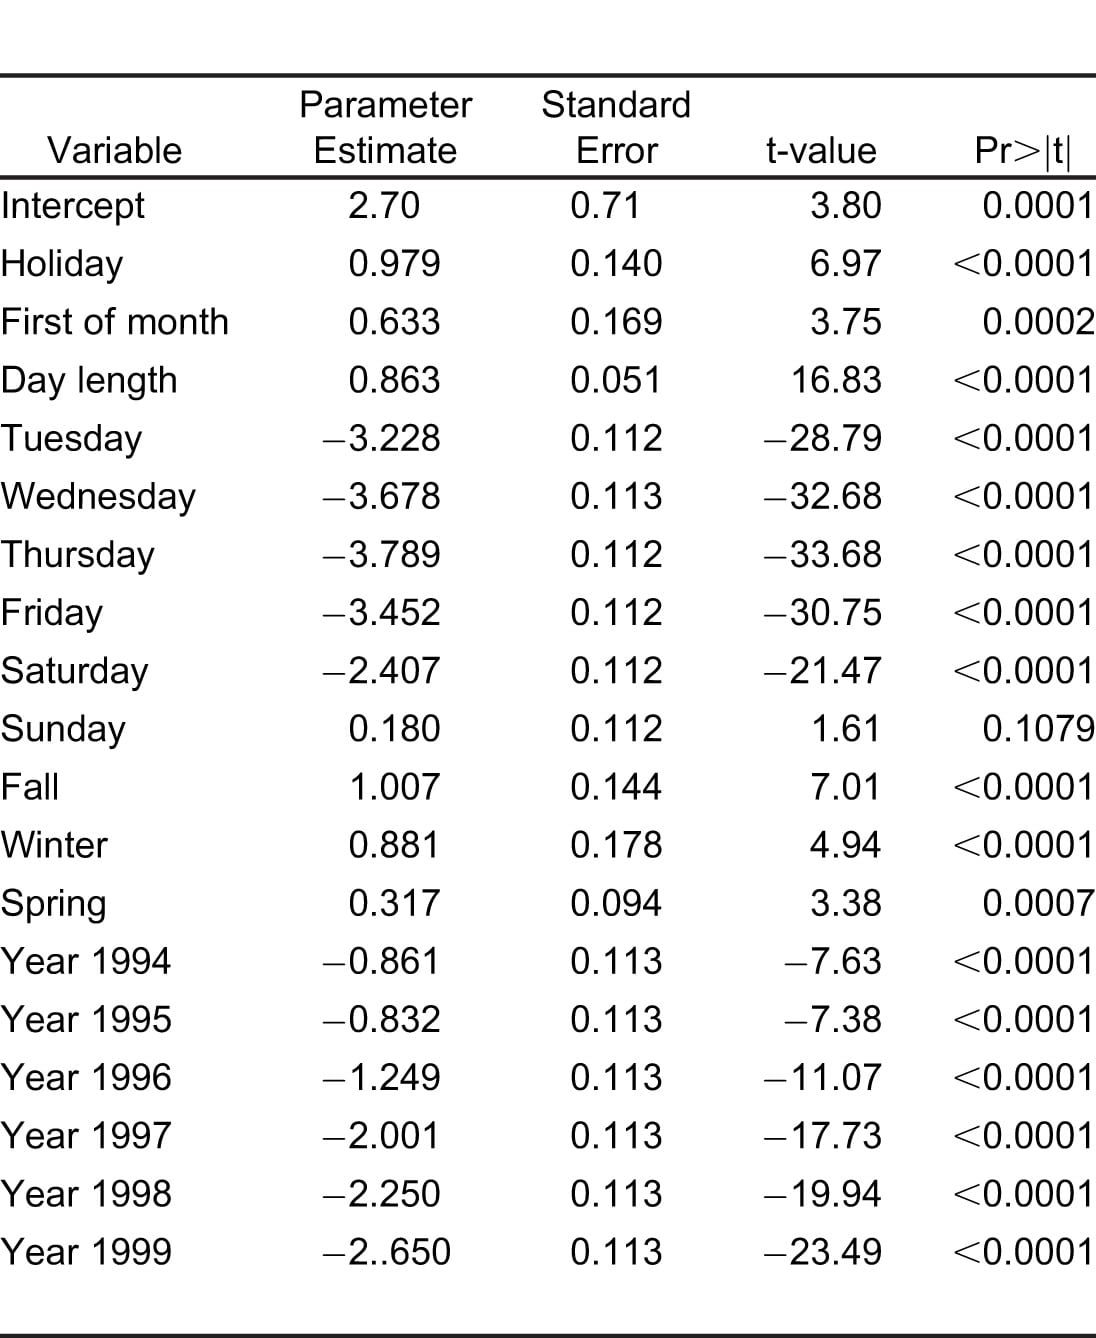
The best-fitting non-weather or baseline model for the daily aggravated assault rate used 19 degrees of freedom and explains 64% of the variation in assaults, based on adjusted R2 (Table 3). Once the baseline model was specified, we assessed the effects of weather covariates (Table 4). Mean ambient temperature had the greatest explanatory capacity, explaining an additional 6.5% of the variation in the daily aggravated assault rate. RH was not significant nor was THI, when in the presence of mean temperature.

A piecewise linear regression, with 2 slope segments, defined with a mean temperature inflection point at 90°F, estimates a positive slope segment at temperatures less than 90°F as β=0.0744 (p<0.001) while at 90°F and higher the slope becomes negative: β=−0.14151 (p<0.001). These estimates supported a curvilinear relationship consistent with the inverted-U which was also evident in the plot of temperature and aggravated assault (Figure 1). Effect estimates for inflection points at 80°F and 85°F were not significant, a finding that supports the 90°F threshold.
Daily Homicides
Daily homicides average less than 1 per day and vary by season, with a maximum of 0.72 in summer and a minimum of 0.65 in spring. Homicide counts also vary across years, from 0.92 in 1993 to 0.50 in 1999. Murders occur relatively more often on weekends (t=2.73) and holidays (t=2.70). The first-order correlation between temperature and homicide was small (r=0.05) and not statistically significant. The plot of temperature and homicides did suggest a non-linear function. But, unlike the robust explanatory capacity of the baseline model for aggravated assaults, the baseline model for homicides explained only 6.7% of the variation in the daily homicide rate, with day of week and day length exhibiting the greatest explanatory capacity. When added to the baseline model, mean temperature explained only 0.1% of the variation in the dependent variable, and though the parameter estimate was statistically significant (t=3.03), the effect was quite small: a 0.00056 increase in the homicide rate for every 1°F increase in mean temperature. Piece-wise regression with mean temperature and an inflection point at 90°F yielded a result similar to that for aggravated assaults. The slope estimate through 89°F was positive and significant (β=0.00056). At 90°F and higher, the coefficient estimate was negative and significant (β=−0.00769).
Daily Rapes and Attempted Rapes
In Dallas, rape and attempted rape correlate with both temporal factors and temperature. The daily rate per 100,000 decreased from 0.26 in 1993 to 0.18 in 1999. Rape also varies by day of the week, occurs more often on weekends (t=4.26), and is significantly higher on holidays (t=3.92). The first-order correlation between temperature and rape was 0.12, which while significant (p<0.01), was several orders of magnitude smaller than that observed for temperature and assaults. The plot of temperature and rape was similar to that for temperature and assaults. Yet, the non-weather baseline model accounted for only 10% of the variation in the daily sexual assault rate. When added to the baseline model, mean temperature was significant and positive. A 1°F increase in mean temperature accounted for an increase of 0.0013 in the mean daily rate of sexual assault (Table 4). As before, piece-wise regression suggested a decrease of the response function beyond 90°F.
Summary
Temporal trends, including weather, contributed to the variation in violent crimes with the magnitudes of the observed associations varying by crime category. The relationship with temperature was strongest for aggravated assault and was consistent with an inverted-U shaped curve with an inflection point at 90°F. We observed similar relationships for sexual assaults and homicides, but the regression models for those variables have limited explanatory capacity.
DISCUSSION
In Dallas from 1993–1999, increases in daily temperature in the low to moderate range were associated with increased aggravated assault, homicide, and rape. A temperature threshold appeared to exist (at approximately 90°F) where the positive relationship between mean temperature and violent crimes became negative. This finding was supported both by data plots and by piece-wise regression and was consistent with the curvilinear hypothesis. While we were unable to draw conclusions about the functional form in other locales, the literature suggests key clues that allowed us to speculate. First, the curvilinear hypothesis was supported in studies that adequately control for temporal factors, while the linear hypothesis was favored in studies that do not.7–10,14–16,20–21 Second, studies in northern latitudes found linear temperature-violence relationships, apparently owing to the limited upward range of daily temperatures.17,30 Given these findings, it is reasonable to conclude that the true relationship is likely non-linear, but that daily temperatures in northern locales rarely reach and sustain the threshold at which the incidence of violent crime would decline.
An important question is whether the threshold for a moderating or negative effect is relatively fixed across locales or more locally determined and whether the range of thresholds is bounded by physiologic or behavioral acclimatization. If the threshold is fixed (suggesting a largely physiological determination), then climate change may initially result in a net increase in crime incidence as temperatures climb the response curve, but then ultimately a net decrease as temperatures pass the threshold. Such a point is likely relatively far off; there would have to be substantial temperature increases for the total area under the curve to decrease. Alternatively, if the threshold is not fixed but determined in part by acclimatization, there may be little observed effect, as the curve will shift to the right as the temperature climbs with the area under the curve remaining unchanged (Figure 2). We concluded that the potential exists for different functional forms and different thresholds across different locales.

There is clearly a statistically significant relationship between temperature and violent crime. Over the next several decades, during which any physiologic or behavioral adaptations will be constrained, climate change may result in increased violent crime. If this is the case, there may be viable public health and public safety adaptations that could reduce violent crime and the associated direct and indirect costs to human health and welfare. Understanding the nature of the temperature-crime relationship may allow for improved prevention and preparedness. Public safety measures may include increasing police presence, instructing first responders to expect upturns in violent crime and associated medical emergencies, and advising local hospitals and healthcare providers to expect spikes in admissions. Neighborhood-level analyses of violent crime using Geographic Information Systems can visualize spatial variations in violence within a community to target interventions and can be overlaid with thermal imaging to assess correlations with neighborhood microclimates. Other simple but effective adaptations might include neighborhood cooling centers, extended hours at public swimming pools and opening fire hydrants to create a community “oasis.” Finally, media outlets can be used to communicate the risks associated with extreme heat and telephone hotlines can be set up to provide answers to frequently asked questions and to direct needed resources.31
LIMITATIONS
There were threats to both internal and external validity in our analyses. The internal threats related to limitations in the exposure data and the difficulty in interpreting individual estimates in multivariate models. First, airport temperatures were only approximate measures of individual exposures. Individuals who engage in violence may not be exposed to the ambient air. What is more, a daily measure for mean temperature aggregates across a range of temperatures that may be as wide as 30–40°F. Such aggregate measures may mask important aspects of the statistical relationship.21 Rotton and Cohn8 examined shorter time periods (every 3 hours) and found non-linear effect estimates in Dallas. Bushman et al32 re-examined Minneapolis data using time of day of the report and the temperature at that time. Their findings supported a positive linear relationship. Certainly, when available, more frequent data are preferred. Second, interpreting parameter estimates for individual variables is tricky. A complex mix of factors contribute to aggressive behaviors.4 Accurate interpretation of effect estimates from multivariate models is difficult when explanatory variables are highly correlated, measurement error is present, and important covariates are not measured or controlled.
External limitations related to generalizing from one locale. Caution should be used in extending results to other cities, particularly those in other latitudes or those with markedly different demographic profiles. This caution extends to interpreting the implications in a changing climate. Ultimately, we need to analyze data from cities at different latitudes under different climate regimes.
CONCLUSION
While the incidence of violent crime depends on many factors, weather, particularly temperature, appears to significantly influence aggravated crime. In Dallas, this relationship is nonlinear and most consistent with an inverted-U shaped curve with a threshold at approximately 90°F. These findings have implications for the incidence of morbidity and mortality associated with violent crime as the climate warms, depending on whether the curvilinear hypothesis prevails in other locales, whether the temperature threshold is fixed, and whether the curve will shift as people acclimate. Additional research across various locales and time periods is likely to allow us to draw more confident conclusions. Our findings suggest that investigations should include multi-city studies that distinguish locales by their climate regimes and incorporate robust controls for the effects of temporal variables, of other key demographic and socioeconomic factors, of acclimatization, and of potential adaptation. Regardless of the implications of a warming climate, the associations between temperature and violent crime offer opportunities for enhanced prevention and preparedness.
Footnotes
Supervising Section Editor: Abigail Hankin, MD
Submission history: Submitted January 12, 2012; Revision received March 13, 2012; Accepted March 14, 2012
Reprints available through open access at http://www. http://escholarship.org/uc/uciem_westjem
DOI: 10.5811/westjem.2012.3.11746
Address of Correspondence: Janet L. Gamble, PhD,
U.S. Environmental Protection Agency, 1200 Pennsylvania Ave., Mailcode 8601P, Washington, DC, 20460.
Email: gamble.janet@epa.gov.
Conflicts of Interest: By the WestJEM article submission agreement, all authors are required to disclose all affiliations, funding sources, and financial or management relationships that could be perceived as potential sources of bias. The authors declare that they have no conflict of interest with respect to this article. The views expressed in this paper are those of the authors and do not necessarily reflect the views or policies of the U.S. Environmental Protection Agency.
REFERENCES
1. Uniform Crime Reports. Crime in the United States 2010. U.S. Department of Justice, Federal Bureau of Investigation. 2011 Available at: http://www.fbi.gov/about-us/cjis/ucr/crime-in-the-u.s/2010/crime-in-the-u.s.-2010. Accessed December 2.
2. National crime victimization survey. U.S. Department of Justice, Office of Justice Programs, Bureau of Justice Statistics. 20082011 Available at: http://bjs.ojp.usdoj.gov/index.cfm?ty =pbdetail&iid=2218 Accessed December 2.
3. Victim costs and consequences: A new look. U.S. Department of Justice, Office of Justice Programs, National Institute of Justice. 2011 Available at: https://www.ncjrs.gov/ pdffiles/victcost.pdf. Accessed December 2.
4. Crime in the United States. U.S. Department of Justice, Federal Bureau of Investigation; 2004. 2011. Crime factors. Available at: http://ww2.fbi.gov/ucr/cius_04/summary/crime_factors/. Accessed November 7.
5. Intergovernmental Panel on Climate Change (IPCC) Climate change 2007: The scientific basis. New York: Cambridge University Press; 2007.
6. Anderson CA. Temperature and aggression: Ubiquitous effects of heat on occurrence of human violence. Psychol Bull. 1989;106:74–96. [PubMed]
7. Cohn EG, Rotton J. Assault as a function of time and temperature: A moderator variable time-series analysis. J Pers Soc Psychol. 1997;72:1322–34.
8. Rotton J, Cohn EG. Violence is a curvilinear function of temperature in Dallas: A replication. J Pers Soc Psycho. 2000;l78:1074–81.
9. Rotton J, Cohn EG. Temperature, routine activities, and domestic violence: A reanalysis. Violence and Victims. 2001;16:203–15. [PubMed]
10. Anderson CA, Anderson DC. Ambient temperature and violent crime: Test of the linear and curvilinear hypotheses. J Pers Soc Psychol. 1984;46:91–7. [PubMed]
11. Baron RA. Aggression as a function of ambient temperature and prior anger arousal. J Pers Soc Psychol. 1972;21:183–9. [PubMed]
12. Baron RA, Bell PA. Aggression and heat: The influence of ambient temperature, negative affect, and a cooling drink on physical aggression. J Pers Soc Psychol. 1976;33:245–55. [PubMed]
13. Butke P, Sheridan SC. An analysis of the relationship between weather and aggressive crime in Cleveland, Ohio. Weather, Climate, and Society. 2010;2:127–139.
14. Cotton JL. Ambient temperature and violent crime. J Appl Soc Psychol. 1986;16:786–801.
15. Harries KD, Stadler SJ. Heat and violence: New findings from Dallas field data, 1980–1981. J Appl Soc Psychol. 1988;18:129–38.
16. Lab SP, Hirschel JD. Climatological conditions and crime: the forecast is… Justice Q. 1988;5:281–99.
17. Rotton J, Frey J. Air pollution, weather, and violent crimes: concomitant time-series analysis of archival data. J Pers Soc Psychol. 1985;49:1207–20. [PubMed]
18. Anderson CA, Deuser WE, DeNeve K. Hot temperatures, hostile affect, hostile cognition, and arousal: Tests of a general model of affective aggression. Pers Soc Psychol Bull. 1995;21:434–48.
19. Cohen LE, Felson M. Social change and crime rate trends: A routine activity theory approach. Amer Sociol Rev. 1979;44:588–608.
20. Anderson CA. Temperature and aggression: Effects on quarterly, yearly, and city rates of violent and nonviolent crime. J Pers Soc Psychol. 1987;52:1161–73. [PubMed]
21. Bell PA. In defense of the negative affect escape model of heat and aggression. Psychol Bull.1992;111:342–6.
22. Anderson CA. Heat and violence. Curr Dir Psychol Sci. 2001;10:33–8.
23. Crime in the United States, 2001. U.S. Department of Justice, Federal Bureau of Investigation. 2011Available at: http://www.fbi.gov/about-us/cjis/ucr/crime-in-the-u.s/2001/toc01.pdf. Accessed December 2.
24. Uniform crime reporting handbook. U.S. Department of Justice, Federal Bureau of Investigation.20042011 Available at http://www.fbi.gov/about-us/cjis/ucr/additional-ucr-publications/ucr_handbook.pdf. Accessed December 2.
25. Steadman RG. The assessment of sultriness, Part 1: A temperature-humidity index based on human physiology and clothing science. Journal of Applied Meteorology. 1979
26. Gujarati DN. Basic econometrics, 3rd ed. New York: McGraw-Hill, Inc;; 1995.
27. Diggle PJ, Liang K-Y, Zeger SL. Analysis of longitudinal data. Oxford, UK: Oxford University Press;; 1994.
28. Kleinbaum DG, Kupper LL, Muller KE. Applied regression analysis and other multivariable methods, 2nd ed. Boston, MA: PLUS-KENT Publishing Co;; 1988.
29. McCullagh P, Nelder JA. Generalized linear models. London: Chapman and Hall;; 1983.
30. Anderson CA, Anderson KB, Dorr N, et al. Temperature and aggression. Adv Exp Soc Psychol.2000;32:63–133.
31. Excessive heat events guidebook. U.S. Environmental Protection Agency. 2012 Available at:http://www.epa.gov/heatisland/about/pdf/EHEguide_final.pdf. Accessed February 13.
32. Bushman BJ, Anderson CA, Wang MC. Is the curve relating temperature to aggression linear or curvilinear? Assaults and temperature in Minneapolis reexamined. J Pers Soc Psychol. 2005;89:62–6.[PubMed]