
| Author | Affiliation |
|---|---|
| John Sutter, BS | Arizona Department of Health Services, Bureau of EMS and Trauma System, Phoenix, Arizona; University of Arizona College of Medicine – Phoenix, Phoenix, Arizona |
| Micah Panczyk, MS | Arizona Department of Health Services, Bureau of EMS and Trauma System, Phoenix, Arizona |
| Daniel W. Spaite, MD | University of Arizona, Department of Emergency Medicine, Arizona Emergency Medicine Research Center, Phoenix, Arizona |
| Jose Maria E. Ferrer, MD | American Heart Association |
| Jason Roosa, MD, MS | Lutheran Medical Center, Wheat Ridge, Colorado |
| Christian Dameff, MD | Arizona Department of Health Services, Bureau of EMS and Trauma System, Phoenix, Arizona |
| Blake Langlais, | Arizona Department of Health Services, Bureau of EMS and Trauma System, Phoenix, Arizona |
| Ryan A. Murphy, MD | University of Arizona College of Medicine – Phoenix, Phoenix, Arizona |
| Bentley J. Bobrow, MD | Arizona Department of Health Services, Bureau of EMS and Trauma System, Phoenix, Arizona; University of Arizona, Department of Emergency Medicine, Arizona Emergency Medicine Research Center, Phoenix, Arizona |
Introduction
Methods
Results
Discussion
Limitations
Conclusion
ABSTRACT
Introduction
Out-of-hospital cardiac arrest (OHCA) is a leading cause of death. The 2010 American Heart Association Emergency Cardiovascular Care (ECC) Guidelines recognize emergency dispatch as an integral component of emergency medical service response to OHCA and call for all dispatchers to be trained to provide telephone cardiopulmonary resuscitation (T-CPR) pre-arrival instructions. To begin to measure and improve this critical intervention, this study describes a nationwide survey of public safety answering points (PSAPs) focusing on the current practices and resources available to provide T-CPR to callers with the overall goal of improving survival from OHCA.
Methods
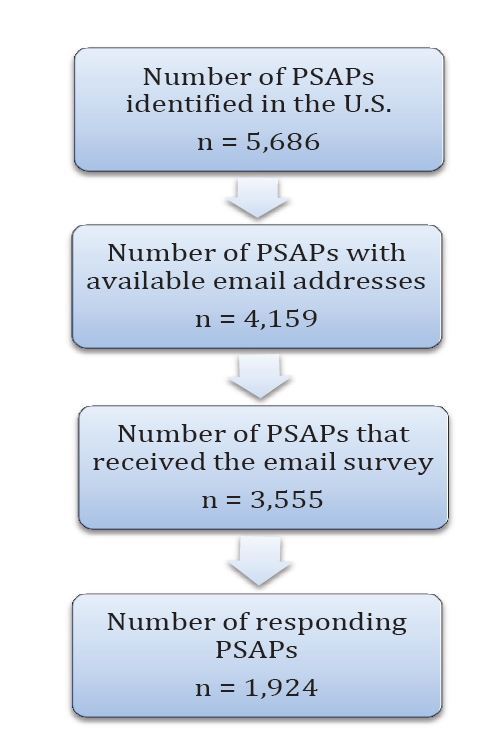
We conducted this survey in 2010, identifying 5,686 PSAPs; 3,555 had valid e-mail addresses and were contacted. Each received a preliminary e-mail announcing the survey, an e-mail with a link to the survey, and up to three follow-up e-mails for non-responders. The survey contained 23 primary questions with sub-questions depending on the response selected.
Results
Of the 5,686 identified PSAPs in the United States, 3,555 (63%) received the survey, with 1,924/3,555 (54%) responding. Nearly all were public agencies (n=1,888, 98%). Eight hundred seventy-eight (46%) responding agencies reported that they provide no instructions for medical emergencies, and 273 (14%) reported that they are unable to transfer callers to another facility to provide T-CPR. Of the 1,924 respondents, 975 (51%) reported that they provide pre-arrival instructions for OHCA: 67 (3%) provide compression-only CPR instructions, 699 (36%) reported traditional CPR instructions (chest compressions with rescue breathing), 166 (9%) reported some other instructions incorporating ventilations and compressions, and 92 (5%) did not specify the type of instructions provided. A validation follow up showed no substantial difference in the provision of instructions for OHCA by non-responders to the survey.
Conclusion
This is the first large-scale, nationwide assessment of the practices of PSAPs in the United States regarding T-CPR for OHCA. These data showing that nearly half of the nation’s PSAPs do not provide T-CPR for OHCA, and very few PSAPs provide compression-only instructions, suggest that there is significant potential to improve the implementation of this critical link in the chain of survival for OHCA.
INTRODUCTION
Out-of-hospital cardiac arrest (OHCA) is a leading cause of death in the United States with a survival rate of less than 8%.1,2 The American Heart Association (AHA) has promulgated the “Chain of Survival” as a framework for the successful resuscitation of victims of OHCA.3 The timing and quality of care provided in the first link of the “Chain” (immediate recognition and early bystander cardiopulmonary resuscitation [CPR]) is strongly associated with improved survival from cardiac arrest, yet bystander CPR is performed in less than one-half of all OHCAs.3-6 Telephone-CPR (T-CPR) is the delivery of compression and/or ventilation instructions to callers of suspected OHCA cases. T-CPR has been recognized as an integral component of an emergency medical system response to OHCA and holds enormous potential to increase bystander response and thus survival from cardiac arrest.7 Guidelines call for all dispatchers to be appropriately trained to provide T-CPR instructions and have an ongoing quality improvement mechanism to assure that all unresponsive adults who are not breathing normally receive appropriate T-CPR instructions as early as possible.8,9
A Public Safety Answering Point (PSAP) is a call center responsible for answering calls to an emergency telephone number for police, firefighting, and ambulance services. The purpose of this study is to describe current practices and resources available at the 9-1-1 call centers to provide T-CPR instructions to callers of OHCA events in the U.S.
METHODS
A survey of public safety answering points (PSAPs) in the U.S. and Canada was commissioned by the Emergency Cardiac Care Committee of the AHA to determine the availability of T-CPR instructions for medical emergencies. It was estimated that there are approximately 7,000 PSAP call centers that receive 9-1-1 emergency calls for law enforcement, fire, or medical emergencies in the United States, and this report focuses on the U.S. component of the survey.
We conducted an initial pilot survey of 391 PSAPs in five states (Colorado, Georgia, Iowa, Maryland, and Oregon). These were selected from a group of 11 states for which a complete list of PSAP e-mail addresses was readily available in order to determine feasibility of the online survey instrument and to study how the survey questions functioned. We contacted these PSAPs by e-mail with a message announcing the survey, a message linking to the survey itself, and up to three reminder e-mails for non-responders. The response rates, responder comments, and times to complete the online survey were collected and used to modify questions in the final survey. Modifications were limited to changes in the response options available for five of the 23 survey questions and rephrasing of one question for clarity. The pilot survey and the modifications that were made to the national survey are available as supplementary material (Supplement 1, Pilot Survey and Modifications to National Survey).
The final survey was conducted in the spring of 2010 and included all 50 states and the District of Columbia. We used a sequential strategy to identify PSAPs including contacting state officials, searching sheriff and police department websites, and then calling individual agencies. We identified 5,686 PSAPs; 4,159 (73%) had available e-mail addresses, and 3,555 (85%) of these e-mails were deliverable (Figure 1). Agencies were contacted in the same manner as in the pilot survey described above: a preliminary e-mail announcing the survey with a statement of endorsement from the lead state EMS official (when available) and options for completing the survey via mail or fax, an e-mail with a link to the survey, and up to three follow-up e-mails for non-responders. Messages were separated by two business days. We obtained institutional review board approval by SCL Health, Denver, CO, for this study.
Validation
After the completion of the survey, we conducted a follow-up study by telephone to compare responding and non-responding agencies. A random sample of 51 non-responding agencies located within the five states with the lowest response rate (Illinois, Nebraska, New Jersey, South Dakota, Minnesota, with a 20%–26% response rate) and a random sample of 50 non-responding agencies located in the middle five responding states (New Mexico, New York, South Carolina, Kansas, and Virginia, with a 40%–44% response rate) were contacted. These agencies were asked to answer a truncated five-question version of the survey over the phone. We then compared responses from these non-responding agencies to those of responding agencies.
Statistical Methods
Proportions were compared using normal approximations of the binomial distribution and Fisher’s exact method. We used one- and two-sided hypotheses at the 0.05 significance level. Means are reported with standard deviations (SD) and medians with interquartile ranges (Q1–Q3). Descriptive statistics are also reported. Analyses were performed in SAS Software 9.4 (SAS Institute, Cary NC) and R 3.1.3.10
RESULTS
Response Rate
Of the 5,686 identified PSAPs in the U.S., 3,555 (63%) received the e-mail survey. Of these, 1,924/3,555 (54%) responded to the survey (Figure 1). This response rate represents 34% (1,924/5,686) of the total number of identified PSAPs, 46% (1,924/4,159) of PSAPs with available e-mail addresses. Responding agencies represented all 50 states and the District of Columbia. Responses to selected question items reflecting the characteristics of PSAPs and their provision of T-CPR instructions are discussed at length below.
PSAP Characteristics
The vast majority of PSAPs were public agencies (n=1,888, 98%) versus privately owned (n=20, 1%). In large part, surveys were completed by management personnel at the individual PSAPs (n=1,658, 86%). Additionally, surveys were completed by law enforcement officers (n=115, 6%), dispatch personnel (n=91, 5%), and others including 9-1-1 coordinators (n=57, 3%). Table 1a and 1b shows the breakdown of PSAPs by administrative type. PSAPs were staffed by a median number of 10 dispatchers with an interquartile range (IQR) of 6 to 16. PSAPs reported handling a median of 12,000 9-1-1 calls annually with a median of 30% of calls resulting in EMS dispatch. Among respondents, 1,199 (62%) facilities identified as primary PSAPs (9-1-1 calls arrive directly), 51 (3%) identified as secondary PSAPs (9-1-1 calls are routed from a primary PSAP), and 659 (34%) identified as both (Table 1a and 1b).
| N | %* | |
|---|---|---|
| Type | ||
| City police department | 563 | 29 |
| County sheriff office | 381 | 20 |
| State/province law enforcement | 23 | 1 |
| County or public agency serving one or more counties | 361 | 19 |
| Fire department | 42 | 2 |
| City and county agency | 200 | 10 |
| Fire and law enforcement | 261 | 14 |
| Joint law enforcement | 18 | 1 |
| Special commission | 14 | 1 |
| Other | 14 | 1 |
| Not indicated | 47 | 2 |
| PSAPs functioning as primary or secondary answering points | ||
| Primary | 1,199 | 62 |
| Secondary | 51 | 3 |
| Both | 659 | 34 |
| Not indicated | 15 | 1 |
| Ambulance/EMS dispatch | ||
| Number of PSAPs that directly dispatch ambulance/EMS | 1,478 | 77 |
| Quality improvement measures | ||
| Number of PSAPs that monitor 10% or more of live calls** | 448 | 23 |
| Number of PSAPs that review 10% or more of recorded calls** | 892 | 46 |
| Number of agencies that review EMS run sheets | 135 | 7 |
| Number of agencies that review data from hospital records of patients transported by EMS | 42 | 2 |
| Number of agencies that review the time required for a caller to reach a dispatcher trained to deliver instructions | 214 | 11 |
| Number of agencies where EMD calls are reviewed by a supervisor, oversight committee, or peer review team | 529 | 27 |
| Number of agencies that complete a systematic quality review/report on a regular basis | 392 | 20 |
| Number of agencies with no formalized evaluation of dispatcher performance and call center services | 265 | 14 |
| Other measurement of dispatch service outcomes | 85 | 4 |
EMS, emergency medical services; PSAP, public safety answering point; EMD, emergency medical dispatch *Percentages are reported as a proportion of the total number of survey respondents (n=1,924). **Facilities were asked to report the percentage of calls that are monitored/reviewed in 10% increments ranging from 0% to 100%.
| Median (Q1–Q3) | Average | Standard deviation | |
|---|---|---|---|
| PSAP descriptions | |||
| Number of dispatchers (n=1,875) | 10 (6–16) | 16.37 | 21.55 |
| Number of annual 9-1-1 calls received (n=1,290) | 12,000 (4,000–42,000) | 53,000 | 150,015 |
| Number of calls resulting in EMS dispatch (n=1,675) | 30% (20%–50%) | 37.61% | 22.18% |
| Ambulance/EMS dispatch | |||
| Time (seconds) to dispatch of Ambulance/EMS (n=1,120) | 49 (30–60) | 54.84 | 41.93 |
| Time (seconds) to redirecting call to secondary PSAP if not directly dispatching EMS (n=322) | 10 (5–30) | 21.68 | 25.90 |
| Dispatcher training | |||
| Percentage of dispatchers providing instructions who are trained but not certified (n=1,021) | 0% (0%–0%) | 7.76% | 23.43% |
| Percentage of dispatchers providing instructions who are EMD certified (n=1,021) | 100% (100%–100%) | 87.65% | 29.47% |
| Quality improvement measures | |||
| Percentage of live calls monitored by supervisory/training staff (n=448) | 20% (10%–50%) | 32.95% | 28.41% |
| Percentage of recorded calls reviewed by supervisory/training staff (n=892) | 20% (10%–50%) | 33.71% | 28.05% |
PSAP, public safety answering point; EMS, emergency medical services; EMD, emergency medical dispatch
Pre-arrival Instructions
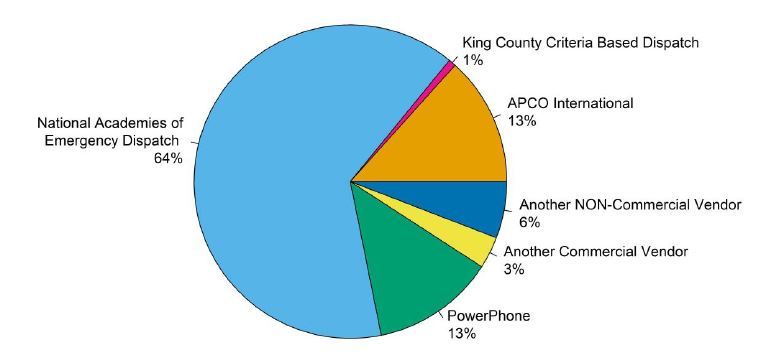
Of 1,924 respondents, 1,021 (53%) PSAPs reportedly provide instructions for medical emergencies. On average, 87.65% (SD 29.47%) of the call-takers who provide T-CPR instructions are certified as emergency medical dispatch dispatchers (for example, national academy of emergency dispatch [NAED] or association of public-safety communications officials [APCO] certified or another certification), and a further 7.76% (SD 23.43%) are trained, but not certified. A structured script is used by 83% of agencies providing T-CPR instructions, while 14% use only written guidelines, and 3% do not use guidelines or a script (Table 2). Of those agencies using a script or guidelines, the type of script or guidelines used for T-CPR instructions varies between PSAPs as shown in Figure 2.
| Script/guideline use | n | % | Type of script/aid | n | % |
|---|---|---|---|---|---|
| Structured script | 834 | 83 | A manual system (e.g. printed cards) | 507 | 61 |
| Written guidelines | 138 | 14 | A computer-based system | 318 | 39 |
| No script or guidelines | 30 | 3 | |||
| Total | 1,002 | 100 | Total | 825 | 100 |
Reportedly, 881 of 1,924 (46%) responding agencies provide no T-CPR or medical instructions for medical emergencies, and 273 (14%) report that they are unable to transfer callers with medical emergencies to another facility to provide T-CPR instructions (Figure 3).
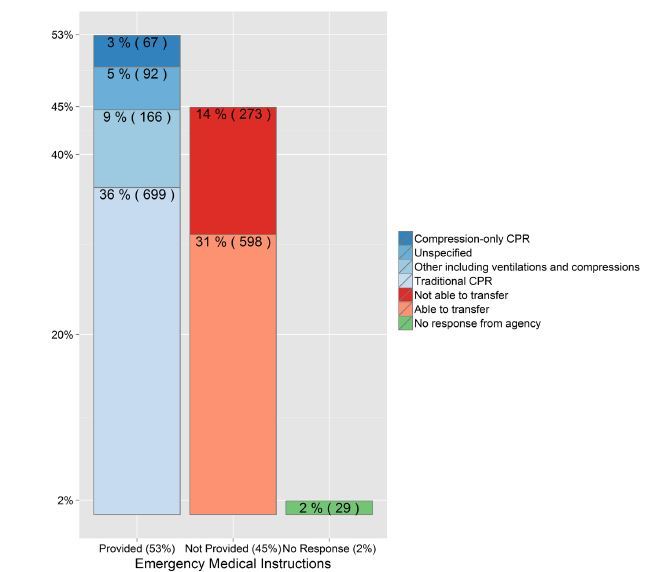
Of the 1,924 respondents, compression-only CPR instructions are reportedly provided by 3% of agencies (67/1,924), 36% (699/1,924) reported traditional CPR instructions (including chest compressions and rescue breathing), 9% (166/1,924) reported some other instructions incorporating ventilations and compressions, and 5% (92/1,924) did not specify the type of instructions (Figure 3).
Validation
In the follow-up validation study comparing responding and non-responding agencies, the proportion of agencies that do not directly provide telephone instructions for medical emergencies did not differ significantly between responding and non-responding agencies in both the low-return subgroup (50/142 vs. 14/51, p=0.3126) and the mid-return subgroup (88/199 vs. 22/50, p=0.9775).
The proportion of agencies that use scripts or aids for the delivery of telephone instructions did not significantly differ between responding and non-responding agencies in the mid-return subgroup (89/109 vs. 24/28, p=0.7832). However, the use of scripts or aids among responding agencies is more prevalent than among non-responding agencies in the low-return subgroup (69/89 vs. 14/37, p<0.01). See supplemental material for an additional summary of the validation study (Supplement 2, Validation Study Summary).
DISCUSSION
Bystander CPR for witnessed OHCA is believed to strongly influence survival to hospital discharge.11-13 Despite this, the rate of bystander CPR remains very low across the U.S. and likely remains a central cause of dismal survival rates in these communities.14,15 A recent AHA Scientific Advisory Statement has published specific recommendations for the provision of T-CPR instructions, including compression-only instructions for adults who suffer a sudden collapse and are not breathing normally, with the intention of improving the frequency and quality of bystander CPR being performed globally.7 The statement had four central recommendations: 1) 9-1-1 callers should be formally and systematically questioned to determine whether the patient may have had a cardiac arrest, and if so, CPR pre-arrival instructions should be immediately provided; 2) CPR pre-arrival instructions should be provided in a confident and assertive manner and should include straightforward chest compression–only instructions to achieve early bystander hands-only CPR for the adult who suddenly collapses; 3) individual dispatcher and organizational-level performance can be measured by using a modest set of metrics; 4) these metrics should be incorporated into an integrated quality assurance program.7
A detailed understanding of the current T-CPR practices of PSAPs is an essential step towards understanding the direction forward for implementing these recommendations. To our knowledge, this survey represents the first nationwide assessment of the practices of PSAPs in the U.S. regarding T-CPR instructions for cardiac arrest. Previous, smaller surveys of PSAPs with regards to T-CPR instructions were either limited to 154 dispatch centers participating in the Resuscitation Outcomes Consortium (ROC) Network16 and 25 EMS agencies participating in the Cardiac Arrest Registry to Enhance Survival (CARES),17 and provide only limited detail regarding nationwide T-CPR practices. For these studies, survey response rates of 154/154 (100%) and 21/25 (84%) were observed, respectively.
Survival rates for OHCA can vary by as much as 500% regionally in the U.S.14 A key aspect of EMS interventions associated with improved survival rates has been an increase in the rate of T-CPR.18-20 These survey data show that while there are many 9-1-1 centers currently providing T-CPR instructions, a substantial proportion of centers that responded to this national survey do not; this may account for a significant portion of this variability. Previous studies have shown that communities with the highest survival rates over the past several decades have consistently focused on implementing, measuring, and benchmarking this key intervention in their systems.19-22 The results of this survey suggest that there is significant potential to improve the T-CPR process through increased systematic implementation of CPR instructions, training, and quality improvement.
In addition to the need for T-CPR expansion, a closer look at the results shows significant room for improvement in the instructions provided to callers for adult OHCA. Only 3% of the responding agencies are providing instructions for compression-only CPR, which is guideline therapy for adult, out-of-hospital sudden cardiac arrest.7,8,23,24
LIMITATIONS
As a voluntary survey of PSAPs, this study is intrinsically limited. The answers provided by agencies are assumed to be accurate representations of their practice. Our validation follow up with non-responding agencies suggests that non-responders did not differ substantially with regards to the provision of T-CPR instructions for OHCA; however, we recognize that responding agencies are likely those most involved in this topic. Consequent to the methodology used to request survey participation, this study is limited to participation from PSAPs for which e-mail addresses were procured. Although survey responses may not reflect actual practice, we would expect that 9-1-1 centers not having a structured T-CPR program to be challenged to deliver consistent guideline-based instructions.
CONCLUSION
This large survey of PSAPs in the United States suggests that there is great variability in the implementation and measurement of the critical intervention of telephone-cardiopulmonary resuscitation instructions. There appears to be a significant opportunity to standardize and improve the delivery of telephone-CPR instructions.
Footnotes
Section Editor: Michael Kurz, MD
Full text available through open access at http://escholarship.org/uc/uciem_westjem
Address for Correspondence: John Sutter, BS, University of Arizona College of Medicine, Department of Health Services, Phoenix, Arizona, 435 N 5th St, Phoenix, AZ 85004. Email: johnsutter@email.arizona.edu. 9 / 2015; 16:736 – 742
Submission history: Revision received March 19, 2015; Submitted June 5, 2015; Accepted June 28, 2015
Conflicts of Interest: By the WestJEM article submission agreement, all authors are required to disclose all affiliations, funding sources and financial or management relationships that could be perceived as potential sources of bias. The survey presented in this study was funded by the American Heart Association. The University of Arizona is part of the HeartRescue Project which receives funding from Medtronic philanthropy to implement and measure cardiac resuscitation systems of care.
REFERENCES
1. Go AS, Mozaffarian D, Roger VL, et al. Heart disease and stroke statistics–2014 update: A report from the American Heart Association. Circulation. 2014;129(3):e28-e292.
2. Berdowski J, Berg RA, Tijssen JG, et al. Global incidences of out-of-hospital cardiac arrest and survival rates: Systematic review of 67 prospective studies. Resuscitation. 2010;81(11):1479-87.
3. Travers AH, Rea TD, Bobrow BJ, et al. Part 4: CPR overview: 2010 american heart association guidelines for cardiopulmonary resuscitation and emergency cardiovascular care. Circulation. 2010;122(18 Suppl 3):S676-84.
4. Herlitz J, Svensson L, Holmberg S, et al. Efficacy of bystander CPR: Intervention by lay people and by health care professionals. Resuscitation. 2005;66(3):291-5.
5. McNally B, Robb R, Mehta M, et al. Out-of-hospital cardiac arrest surveillance – Cardiac Arrest Registry to Enhance Survival (CARES), United States, October 1, 2005-December 31, 2010. MMWR Surveill Summ. 2011;60(8):1-19.
6. Vaillancourt C, Stiell IG, Wells GA. Understanding and improving low bystander CPR rates: A systematic review of the literature. CJEM. 2008;10(1):51-65.
7. Lerner EB, Rea TD, Bobrow BJ, et al. Emergency medical service dispatch cardiopulmonary resuscitation prearrival instructions to improve survival from out-of-hospital cardiac arrest: A scientific statement from the American Heart Association. Circulation. 2012;125(4):648-55.
8. Berg RA, Hemphill R, Abella BS, et al. Part 5: Adult basic life support: 2010 American Heart Association guidelines for cardiopulmonary resuscitation and emergency cardiovascular care. Circulation. 2010;122(18 Suppl 3):S685-705.
9. Field JM, Hazinski MF, Sayre MR, et al. Part 1: Executive summary: 2010 american heart association guidelines for cardiopulmonary resuscitation and emergency cardiovascular care. Circulation. 2010;122(18 Suppl 3):S640-56.
10. R: A language and environment for statistical computing. R Foundation for Statistical Computing. 2015.
11. Rea TD, Eisenberg MS, Culley LL, et al. Dispatcher-assisted cardiopulmonary resuscitation and survival in cardiac arrest. Circulation. 2001;104(21):2513-6.
12. Sasson C, Rogers MA, Dahl J, et al. Predictors of survival from out-of-hospital cardiac arrest: A systematic review and meta-analysis. Circ Cardiovasc Qual Outcomes. 2010;3(1):63-81.
13. Stiell IG, Wells GA, Field B, et al. Advanced cardiac life support in out-of-hospital cardiac arrest. N Engl J Med. 2004;351(7):647-56.
14. Nichol G, Thomas E, Callaway CW, et al. Regional variation in out-of-hospital cardiac arrest incidence and outcome. JAMA. 2008;300(12):1423-31.
15. Lerner EB, Sayre MR, Brice JH, et al. Cardiac arrest patients rarely receive chest compressions before ambulance arrival despite the availability of pre-arrival CPR instructions. Resuscitation. 2008;77(1):51-6.
16. Davis DP, Garberson LA, Andrusiek DL, et al. A descriptive analysis of emergency medical service systems participating in the resuscitation outcomes consortium (ROC) network. Prehospital Emergency Care. 2007;11(4):369-82.
17. Govindarajan P, Lin L, Landman A, et al. Practice variability among the EMS systems participating in cardiac arrest registry to enhance survival (CARES). Resuscitation. 2012;83(1):76-80.
18. Akahane M, Ogawa T, Tanabe S, et al. Impact of telephone dispatcher assistance on the outcomes of pediatric out-of-hospital cardiac arrest. Crit Care Med. 2012;40(5):1410-6.
19. Song KJ, Shin SD, Park CB, et al. Dispatcher-assisted bystander cardiopulmonary resuscitation in a metropolitan city: A before–after population-based study. Resuscitation. 2014;85(1):34-41.
20. Tanaka Y, Taniguchi J, Wato Y, et al. The continuous quality improvement project for telephone-assisted instruction of cardiopulmonary resuscitation increased the incidence of bystander CPR and improved the outcomes of out-of-hospital cardiac arrests. Resuscitation. 2012;83(10):1235-41.
21. Lewis M, Stubbs BA, Eisenberg MS. Dispatcher-assisted cardiopulmonary resuscitation: Time to identify cardiac arrest and deliver chest compression instructions. Circulation. 2013;128(14):1522-30.
22. Rea TD, Crouthamel M, Eisenberg MS, et al. Temporal patterns in long-term survival after resuscitation from out-of-hospital cardiac arrest. Circulation. 2003;108(10):1196-201.
23. Bobrow BJ, Clark LL, Ewy GA, et al. Minimally interrupted cardiac resuscitation by emergency medical services for out-of-hospital cardiac arrest. JAMA. 2008;299(10):1158-65.
24. Bobrow BJ, Spaite DW, Berg RA, et al. Chest compression–only CPR by lay rescuers and survival from out-of-hospital cardiac arrest. JAMA. 2010;304(13):1447-54.