
| Author | Affiliation |
|---|---|
| Larissa S. May, MD, MS | The George Washington University, Department of Emergency Medicine, Washington, D.C |
| Beth Ann Griffin, PhD | RAND Corporation, Center for Domestic and International Health Security, Arlington VA |
| Nicole Maier Bauers, MS | The George Washington University School of Public Health, Washington, D.C |
| Arvind Jain, MS | RAND Corporation, Center for Domestic and International Health Security, Arlington VA |
| Marsha Mitchum, MS, MPH | The George Washington University School of Medicine, Washington, D.C |
| Neal Sikka, MD | The George Washington University, Department of Emergency Medicine, Washington, D.C |
| Marianne Carim, MD | The George Washington University School of Medicine, Washington, D.C |
| Michael A. Stoto, PhD | Georgetown University School of Nursing and Health Studies |
ABSTRACT
Introduction:
The purpose of syndromic surveillance is early detection of a disease outbreak. Such systems rely on the earliest data, usually chief complaint. The growing use of electronic medical records (EMR) raises the possibility that other data, such as emergency department (ED) diagnosis, may provide more specific information without significant delay, and might be more effective in detecting outbreaks if mechanisms are in place to monitor and report these data. The purpose of this study is to characterize the added value of the primary ICD-9 diagnosis assigned at the time of ED disposition compared to the chief complaint for patients with influenza-like illness (ILI).
Methods:
The study was a retrospective analysis of the EMR of a single urban, academic ED with an annual census of over 60, 000 patients per year from June 2005 through May 2006. We evaluate the objective in two ways. First, we characterize the proportion of patients whose ED diagnosis is inconsistent with their chief complaint and the variation by complaint. Second, by comparing time series and applying syndromic detection algorithms, we determine which complaints and diagnoses are the best indicators for the start of the influenza season when compared to the Centers for Disease Control regional data for Influenza-Like Illness for the 2005 to 2006 influenza season using three syndromic surveillance algorithms: univariate cumulative sum (CUSUM), exponentially weighted CUSUM, and multivariate CUSUM.
Results:
In the first analysis, 29% of patients had a different diagnosis at the time of disposition than suggested by their chief complaint. In the second analysis, complaints and diagnoses consistent with pneumonia, viral illness and upper respiratory infection were together found to be good indicators of the start of the influenza season based on temporal comparison with regional data. In all examples, the diagnosis data outperformed the chief-complaint data.
Conclusion:
Both analyses suggest the ED diagnosis contains useful information for detection of ILI. Where an EMR is available, the short time lag between complaint and diagnosis may be a price worth paying for additional information despite the brief potential delay in detection, especially considering that detection usually occurs over days rather than hours.
INTRODUCTION
Many emerging infectious diseases, as well as influenza, originally present as nonspecific “flu-like illness.” As a result, a sudden unexpected increase in the number of individuals with nonspecific complaints, such as headache, fever, or vomiting, could be the first sign of an outbreak. While emergency departments (EDs) present an excellent opportunity to observe emerging outbreaks and other disease entities, it is beyond the ability of any single physician in one ED on one shift to be able to do this effectively; therefore, systems are necessary for detection. Syndromic surveillance provides earlier detection of an event by collecting and analyzing non-traditional health indicators or pre-diagnostic data to detect aberrant patterns compared to expected rates of these groupings.1Since the primary purpose of many syndromic surveillance systems is the earliest possible detection of a bioterrorist attack or natural disease outbreak, many rely on the earliest available data. To do otherwise, it would seem, would limit the timeliness of the detection system. Following this logic, many ED systems analyze patient chief complaints, which are potentially available for analysis as soon as the ED patient is triaged. However, other data, such as ED discharge diagnosis, may provide more accurate or specific patient diagnoses. If the delay in making the more accurate data available is not too great, they could potentially be more effective in detecting disease outbreaks. The growing use of electronic medical record (EMR) systems in EDs makes this a possibility worth investigating.
Prior studies have found that a combination of complaint and diagnostic codes demonstrated the best accuracy and sensitivity for detection of the flu season.2 Similarly, a retrospective analysis of over 500,000 patients found that for most syndromes, the chief-complaint classification system alone could identify only about half of patients with relevant syndromic presentations.3 Other studies have found good agreement between different syndrome coding schemes; however, agreement between individual syndromes varied substantially.4 Nonetheless, a study of the National Capitol Region’s ED Syndromic Surveillance System found overall good agreement between chief complaint and diagnosis data, which was highest for respiratory and gastrointestinal syndromes.5
Purpose of this investigation
The purpose of this study is to characterize the added value of the primary ICD-9 diagnosis assigned at the time of ED disposition (“ED diagnosis”) compared to the chief complaint assigned at the time of presentation (“chief complaint”) for ED patients with influenza-like illness (ILI). We address this question in two ways. First, presuming that the ED diagnosis is more accurate, we determine the proportion of patients whose apparent diagnosis differs in the two data systems, how this proportion varies according to chief complaint, and the most common types of changes that occur. Second, by comparing time series and applying standard syndromic detection algorithms, we determine whether chief complaint, ED diagnosis, or both are the best indicators for the start of the influenza season.
Importance
ED diagnosis may contain more accurate and thus useful information than chief complaint for detection of outbreaks of ILI. Using an ED EMR in which diagnoses are assigned within several hours of patient presentation could mitigate concerns about the timeliness issue while providing more specific information.
METHODS
Study Protocol
Relationship Between Chief Complaint and Diagnosis
We conducted a retrospective search of the ED EMR data from June 2005 to May 2006 and analyzed data to ascertain the relationship between chief complaint and final diagnosis for the following categories: respiratory, gastrointestinal and viral illness. The study was conducted at a single urban, academic emergency department with a four-year emergency medicine residency and approved by the local Institutional Review Board.
The ED is staffed by board-certified emergency physicians, physician assistants, EM residents and rotating residents (mainly PGY-1s) from other departments (surgery, internal medicine, and OBGYN). Pediatric patients under age 18 constituted less than 10% of all cases for each category we evaluated. During the time our data was generated, chief complaints and diagnoses were selected to be similar to the Centers for Disease Control (CDC) clinical criteria for ILI, which included fever, headache, dry cough, sore throat, rhinorrhea, and myalgias.6 Nausea, vomiting and diarrhea can occur with ILI and were included in our analysis, although these are mainly symptoms in children. Because of the small proportion of pediatric patients, we did not include otitis media or otalgia in our categorization, even though it can be a presenting symptom in children. The complaint and diagnostic codes were then sorted into groups based on constellations of clinical complaints; i.e. upper respiratory infection, asthma exacerbation, viral illness, malaise and myalgias, fever, and pneumonia. In addition, we chose to evaluate the complaint of nausea/vomiting and diarrhea for evaluation of gastrointestinal outbreaks. We excluded abdominal pain due to the large proportion of non-infectious and surgical causes of abdominal pain in adults. Diagnoses were similarly selected based on their association with ILI and categorized into diagnosis groups suggestive of a possible infectious etiology (i.e. bronchitis, pneumonia, upper respiratory infection, acute sinusitis, pharyngitis, fever, and myalgias)
The EMR in use at our institution (IBEX by Picis, Inc.) allows free text of the chief complaint, as well as entry from a pull-down menu by the triage nurse. In our EMR, some chief complaints are entered as symptoms and others entered as an interpretation by the triage nurse; for example, cough and fever, as compared to “pneumonia symptoms.” Most chief complaints were entered from a pull-down menu as opposed to free text entry. In most cases, entering of the complaint as free text was the same as the pull-down (i.e. diarrhea or headache); in other cases the free text complaint was different but conveyed the same information; for example, “pneumonia symptoms” instead of pneumonia. One hundred percent of sore throat, fever, viral illness, headache, and myalgia were entered from the pull-down menu or were the same as the pull-down terms. For nausea/vomiting/diarrhea the entries were slightly more diverse, but 100% fell into one of the following categories: food poisoning, gastritis, n/v (nausea/vomiting), n/v/d (nausea/vomiting/diarrhea), and diarrhea. Thus, exclusion of the free text complaints would not have affected the results. Final diagnosis is entered by the physician (either by the attending physician, an EM resident or a junior resident under supervision) from a pre-determined set of ICD-9 codes used for billing purposes. It is typically entered at the time of patient disposition and is based on the clinical information available at the time of entry. Thus, in some cases the chief complaint and final diagnosis are the same if the clinician did not have additional information on the diagnosis at the time of disposition (for example, chest pain instead of pericarditis). In general, diagnoses are entered by EM providers (attendings, residents, and physician assistants) rather than first-year rotating residents; therefore, we feel these diagnoses are in general reflective of more mature clinical judgment.
Patients were cross-tabulated according to chief complaint and final diagnosis in three categories – respiratory, gastro-intestinal, and viral chief complaints – and the most common patterns were noted.
Data Analysis
Comparison between the specific chief complaints and diagnoses and CDC data for the 2005–2006 influenza season:
We also analyzed the chief complaint and diagnosis data for time trends between June 1, 2005 and May 24, 2006 for asthma, nausea/vomiting/diarrhea, pneumonia, sinusitis/ upper respiratory infection (URI) and viral illness, and we compared these trends to the CDC data for the 2005–2006 influenza season for the South Atlantic region in order to track the level of agreement between the ED data and the CDC data for this particular influenza season.7
Detection of outbreak of influenza in the 2005–2006 influenza season using syndromic surveillance systems based on complaint vs. diagnosis data:
To understand what may be gained from using diagnosis data as opposed to chief-complaint data in syndromic surveillance systems, we applied statistical detection algorithms to daily counts of both chief complaint and diagnosis data. For each condition, we standardized the daily counts by dividing the daily count by the mean number of cases in the non-influenza season, where the non-influenza season was defined to be May through November of each calendar year. Since only five dates had missing data, four of which occurred in the non-flu season, daily counts on these dates were set equal to zero for each condition. Dates with missing data were days that no complaint or diagnosis category used in the analysis had been assigned to any patients and impacted the viral-illness category only.
We used three statistical algorithms to determine the beginning of the influenza outbreak in the 2005–2006 influenza season: the univariate cumulative sum (CUSUM), the exponentially weighted moving average CUSUM, and the multivariate CUSUM. The univariate CUSUM algorithm monitors the daily statistic Si, which is defined by the recursive formula
In this formula Xi denotes the observed daily count on day i, μ denotes the overall mean daily count estimated from the data, and k is an off-set parameter set by the user.8,9 The algorithm alarms or flags whenever Si exceeds a value h, where h is computed empirically to guarantee a user-defined false positive rate in the non-flu season.
The CUSUM based on deviations from an exponentially weighted moving average, which we refer to throughout as EXPO, adds one additional step to the CUSUM algorithm described above.10 First, the EXPO algorithm predicts the daily counts, Xi, using an exponentially weighted moving average. Specifically, it defines
where 0 ≤ λ ≤ 1 is a user-specified parameter. The algorithm then monitors the differences between the actual and predicted counts using the statistic Si, which is defined by the following recursive formula
As with CUSUM, the EXPO algorithm flags whenever Si exceeds a value h, where h is computed empirically to guarantee a fixed, user-specified false positive rate in the non-flu season.
Finally, we utilized the multivariate CUSUM algorithm, which we refer to as MV CUSUM. The MV CUSUM was developed for monitoring multiple streams of data on a daily basis (e.g., streams of data from more than one hospital or streams of data representing multiple conditions within a hospital).11 It follows the same logic as the standard CUSUM, except that now daily counts are represented by a vector Xi. We define
and Si = 0 if Ci ≤ k where
and Σ−1 is the estimated variance-covariance matrix for the p streams of data being analyzed using only daily counts from the non-flu season. The MV CUSUM algorithm flags whenever Si exceeds a value h, where h is computed empirically to guarantee a fixed false positive rate (user-specified) in the non-flu season. For each algorithm, we set the detection threshold, h, to ensure that the false positive rate is 1 percent outside of the influenza season.
Before applying the three algorithms to the data, simulation studies were used to fine-tune the key parameters of each algorithm, namely k for the CUSUM, k and λ for the EXPO, and k for the MV CUSUM (see Stoto MA, Griffin BA, Jain A, Davies-Cole JO, et al. for details).12 Syndromic surveillance systems based on a single stream of chief complaint or diagnosis data and based on multiple streams of chief complaint and diagnosis data were fine-tuned separately. We used the values of the key parameters that were determined to work best for a given system in the analysis below, which examines the ability of the system to detect the beginning of the influenza outbreak in the influenza season. We regard an influenza outbreak to be the period characterized by a sudden increase in the number of people with influenza-like complaints. This is distinct from the influenza season, which is generally defined to be the period during which influenza outbreaks are more likely to occur in the calendar year, generally taken to be between December and April.
RESULTS
Relationship between chief complaint and diagnosis:
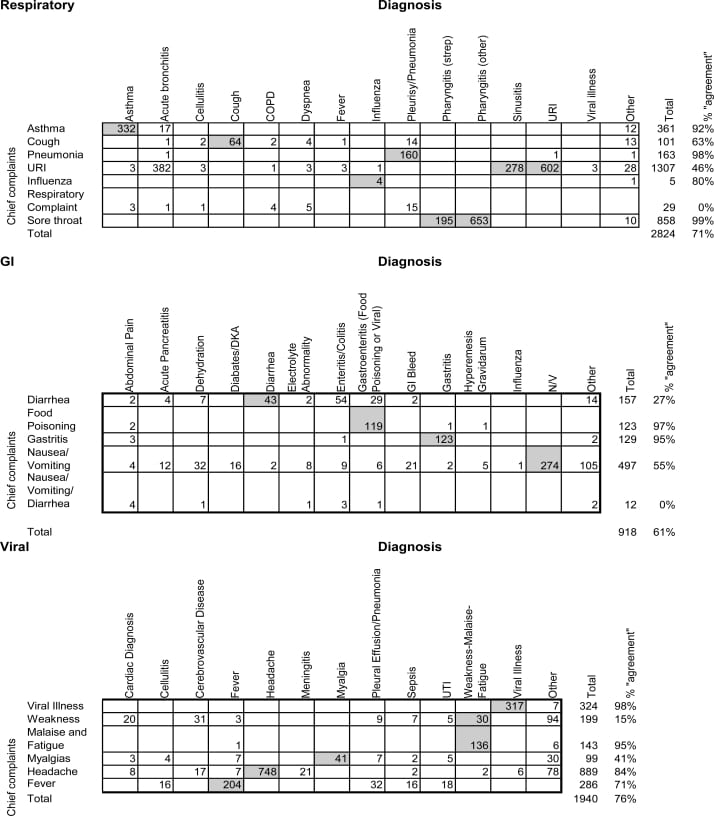
In our analysis we included 5,682 ED encounters that fit the complaint or diagnostic categories from June 2005 to May 2006, out of 56,747 ED visits. Twenty-nine percent of patients presenting to the ED had a different diagnosis at the time of disposition than their chief complaint, as interpreted by the triage nurse.
Some chief complaints were more likely to be inconsistent with the final ED diagnosis. These differences can be viewed as a positive trait, in that they provide additional information for syndromic surveillance that may be worth the additional several-hour wait for the ED diagnosis. Specifically, the percent of disagreement was higher for gastrointestinal complaints (39%) than for respiratory or viral complaints (29% and 24%, respectively). Diagnoses that were consistent or the same as the chief complaint were labeled as “agreement.” In particular, the chief complaints of weakness (15% “agreement”), body aches (41% “agreement”), upper respiratory infection (46% “agreement”), and “nausea and vomiting” (55% “agreement”) were not informative about the diagnosis, while pneumonia symptoms (98% “agreement”), asthma (92% “agreement”) and sore throat (99% “agreement”) showed consistency between chief complaint and ED diagnosis. See Table 1for detailed results. Highlighted values represent those diagnoses consistent with the corresponding chief complaint.
Comparison between the specific chief complaints and diagnoses and CDC data for the 2005–2006 influenza season:
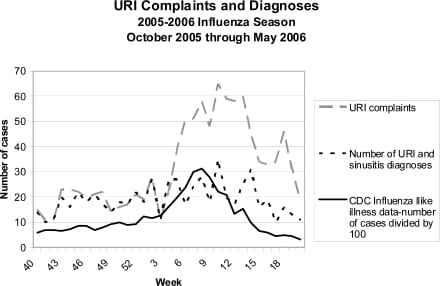
The weekly counts of ILI-related chief complaints and diagnoses from June 1st, 2005 through May 24, 2006 were analyzed for trends compared to the CDC data for ILI, as reported by laboratory and outpatient sentinel physician surveillance for the South Atlantic region. By convention, the weeks of the flu season are numbered starting on week 40 of the Fall and continuing through week 20 in the following year. The grouping for the complaint of URI includes chief complaints of URI symptoms as well as “flu.” We grouped the diagnosis category for URI to include the upper respiratory categories of URI as well as acute sinusitis, as clinically acute sinusitis commonly occurs during upper respiratory infections. As seen in Figure 1, the peak for URI complaints and diagnoses occurs at week 10 with 35 cases daily, whereas the CDC ILI data shows peak at week 7. Complaints of sinusitis and URI rise at week 4 and peak at week 10. The trends for URI complaints and the CDC influenza data show similar trends. For our data, URI diagnoses were at their highest in week 10, at the same time as the peak for influenza A diagnoses for the region. Weeks 13 to 14 represented the second wave of URI diagnoses for our data, correlating to another upswing in percentage of ILI across the South Atlantic region. The lowest points of reported ILI throughout the region also correspond exactly to the downward trends of URI diagnoses in Washington D.C., of particular note weeks 3, 17, and 20. It is interesting to note that URI complaint data appears to rise earlier in the influenza season than the URI diagnosis data and may be an earlier indicator for the beginning of the influenza season. Furthermore, because there is only 46% agreement overall for URI complaint and diagnosis, patients presenting with URI symptoms may be assigned an alternative diagnosis (such as viral illness or bronchitis, for example).
In a similar comparison (results not shown) of viral illness complaints and diagnosis compared to ILI data for the South Atlantic region for the 2005–2006 season as reported to the CDC, we found that the complaint and diagnosis graphs correspond well. We selected the category of viral illness from the triage nurse-entered chief complaint of viral illness and the final discharge diagnosis of viral illness. The diagnosis of viral illness peaked at week 10 (March 4–10) with 15 patients, and the most prominent bimodal crests for viral illness occur during week 52 to week 2 of the influenza season, and weeks 8–11.
Figure 2 shows pneumonia complaints and diagnosis compared to ILI data for the South Atlantic region for the 2005–2006 season, as reported to the CDC. There was a low level of background “pneumonia symptoms” chief complaint as interpreted by the triage nurse, which poorly follow the trends for ILI. However, pneumonia diagnoses for our data peak at week 6 with 25 patients, followed by week 18 with 23 patients; week 8 with 22 patients, and week 10 with 20 patients. These trends are consistent with ILI curves for the South Atlantic region.
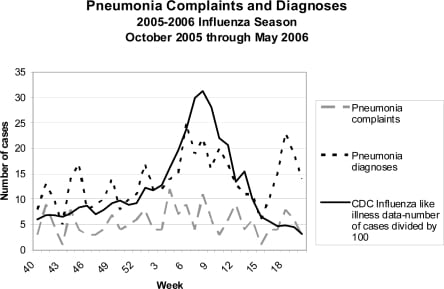
The highest peak of the regional influenza corresponds to the highest peak of the number of pneumonia cases diagnosed for the South Atlantic region. Regional data and our ED diagnosis data for pneumonia also follow similar trends on week 1, where the percentage of ILI reports peaks for the South Atlantic region and our data peaks for the number of cases of pneumonia that were clinically diagnosed in the ED.
Fever and asthma exacerbation (not shown here) showed poor correlation with the CDC ILI trends. Asthma exacerbations peaked in the spring and fall, which did not correspond with the influenza season, but may be related to other factors such as seasonal allergies and environmental changes, including ozone and pollen counts.
Detection of outbreak of influenza in the 2005–2006 influenza season using syndromic surveillance systems based on complaint vs. diagnosis data:
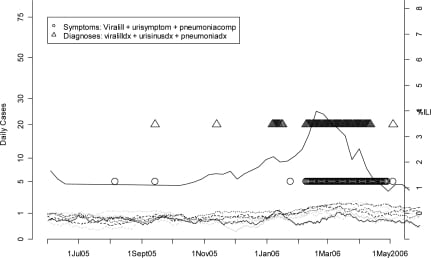
Finally, Figures 3 and and44 display the dates upon which fine-tuned versions of the CUSUM, EXPO, and MV CUSUM algorithms flagged unusually high occurrences of a given chief complaint or diagnosis category, or group of categories, on a particular day from June 1, 2005 until May 30, 2006. The goal of these analyses is to determine which individual streams of data (Figure 3) and which groups of data streams (Figure 4) consistently and in a timely fashion flag the beginning of the influenza outbreak in the 2005–2006 influenza season. In these figures, smoothed values for the standardized number of cases are shown for each chief complaint and diagnosis group. The flagging of the detection algorithms is represented by symbols (lowercase letters for CUSUM, uppercase letters for EXPO, and Δ for MV CUSUM) plotted according to the day they flagged on the horizontal axis and along different fixed values on the vertical axis to help distinguish more clearly between the data streams being compared. Thus, for example, in Figure 3, pneumonia complaints (marked by the lower and upper case p’s in gray) were at unusually high occurrences at the end of August and beginning of September as indicated by both the CUSUM and EXPO algorithms. In Figure 4, both the circles and triangles denote unusually high occurrences of the diagnosis and complaint data, respectively, where high occurrences are measured jointly across three categories of data: viral illness, URI, and pneumonia.
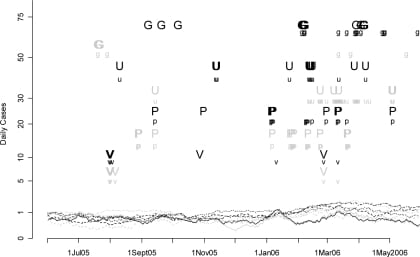
Figure 3 displays the performance of the CUSUM and EXPO algorithms for flagging the beginning of the influenza outbreak when only applied to one stream of data (e.g. either one chief complaint or diagnosis group). Taken individually, only URI complaints (gray lower and upper case u’s) appears to flag the beginning of an influenza outbreak in the winter of 2006 with any consistency, indicating that an influenza outbreak in the winter of 2006 began in the beginning of March. Pneumonia compliant cases (gray lower and upper case p’s) also appear to flag with some consistency during the winter of 2006, indicating the possibility that an influenza outbreak began in mid-January. Pneumonia diagnosis cases (black lower and upper case p’s) follow a similar trend to URI and pneumonia complaint but do so with more sporadic flags. It is interesting to note that URI complaint data flags the detection of an influenza outbreak more consistently than URI diagnosis data (black lower and upper case u’s). This difference of information between the chief complaint and the diagnosis may vary depending on the time of the year; therefore, the chief complaint remains useful even in the case where one has the additional information provided by the diagnosis. The performance between pneumonia complaint and pneumonia diagnosis data is much less clear with complaints flagging more consistently earlier on in the influenza season and diagnosis data flagging more consistently at the end.
Figure 4 displays the results from applying the MV CUSUM to two different possible surveillance systems, which could be comprised using the ER data: one that only uses the complaint data of viral illness, URI symptoms, and pneumonia complaints and one that uses confirmed diagnosis data from viral illness, URI, and pneumonia. Each system flags an influenza outbreak in 2006. The system based on diagnosis data flags the start of an influenza outbreak about one month earlier than the system based solely on the chief complaint data. Figure 4 also plots the CDC regional data for ILI for the 2005 to 2006 influenza season, showing how well the three syndromic surveillance algorithms, univariate CUSUM, exponentially weighted CUSUM and multivariate CUSUM, did at flagging the beginning of the flu season in the winter of 2006.
DISCUSSION
Certain chief complaints are more accurate than others in predicting final ED diagnosis. Because 29% of the patients studied had a different final ED diagnosis compared to chief complaint, for those categories in which there is significant variation, ED diagnosis is presumably more specific, and may be worth using in syndromic surveillance systems if one can accept the small delay of several hours in action for greater information. It is important to note that this delay may be more significant for traditional paper record systems, thus emphasizing the advantage of the EMR for syndromic surveillance of ILI.
For respiratory syndromes, prior studies have found good sensitivity of chief complaint and diagnosis. Using an EMR, it has been found that diagnosis is superior to chief complaint alone for respiratory illness in the pediatric population, and longitudinal studies have found that respiratory syncytial virus and influenza testing corresponded well with respiratory syndrome counts.13, 14 A study by the University of Pittsburgh Realtime Outbreak Disease Surveillance Laboratory (RODS) concluded that using ICD-9 coded chief complaints for acute respiratory illness yielded moderate sensitivity (44%) but very high specificity (97%) – this study found no difference for the ICD-9 coded diagnoses.15 For our data this pattern is apparent for pneumonia, asthma and URI complaints; however, other complaint indicators such as weakness, myalgias, and gastrointestinal complaints are less accurate. Other studies have found better agreement between surveillance forms and ED diagnosis data when compared to chief complaint data.16
In our data set, certain clinical complaint and diagnostic categories retrospectively show the rise and peak of the influenza season, such as pneumonia, URI and viral illness; whereas others, such as fever, do not appear to correspond as well to the influenza season. Fine-tuned statistical detection algorithms applied to single complaint and diagnosis categories, even those found to be accurate for the start of the ILI season, performed rather poorly at detecting the onset of an influenza outbreak in real-time modeling. Except for URI complaints, none of the chief complaint and diagnosis categories consistently flagged the influenza outbreak that occurred in the winter of 2006 when examined in isolation. It is particularly interesting to note that URI chief complaint data flag the influenza outbreak more consistently than URI diagnosis data. However, when three of the most predictive complaint and diagnosis categories were modeled using multivariate flags, they indicate the outbreak of influenza more consistently and clearly. Use of such multivariate syndromic surveillance systems plays an important role in improving syndromic surveillance systems currently in use. Moreover, our results suggest that syndromic surveillance systems based on more than one stream of diagnosis data might allow for more timely detection of influenza outbreaks than systems based on more than one stream of chief complaint data with the system based on diagnosis data flagging the start of an influenza outbreak about one month earlier than the system based solely on the chief complaint data.
Although the influenza season for 2005–2006 had a less intense peak and occurred over a longer period of time compared to the three prior seasons,7 we feel this does not impact the validity of our analysis, since we were interested in detecting the onset rather than the peak of the influenza season. Furthermore, our analysis demonstrates that even in this atypical year, we were able to detect the onset of the influenza season using the chief complaint and diagnostic categories. The diagnosis added information that was valuable for earlier detection, which might be especially true in an atypical season where the onset of the outbreak may not be “obvious” to clinicians.
System stability may depend on coding, such as the shift from ICD-9 to ICD-10 billing codes.17 Use of the EMR at our institution mitigates this, as diagnoses are selected from a drop-down menu where available ICD codes have already been assigned. One limitation is the inability to select for an “unusual” ICD-9 diagnosis that has not already been pre-loaded into the system. The EMR may yield syndromic data that may be more sensitive and specific in detecting outbreaks than the patient-centered chief complaint data more commonly used. It provides the opportunity for collaboration between ED healthcare providers and health officials and any needed response to aberrant signals.18,19 The goal of syndromic surveillance is a sensitive system that minimizes costly false alarms.20 The use of an EMR system may mitigate concerns regarding timeliness, as delays of only hours are expected between reporting of chief complaint and discharge diagnosis. Electronic systems that allow for immediate clinician assignment of diagnoses such as ours may enhance specificity. This type of information technology may facilitate earlier detection, communication between entities, and the use of database systems for epidemiologic intelligence.1
The use of individual hospital syndromic surveillance has many potential benefits. It may lead to earlier local detection of influenza-like illness without the delay of traditional sentinel surveillance and subsequent institution of control measures, such as flu vaccination campaigns for hospital employees and patients, earlier use of isolation precautions in the ED for patients with suspected ILI or who have upper respiratory complaints, and earlier collaboration with health department officials.
LIMITATIONS
Our data is based on a retrospective review of a single institution’s EMR system for one year of data. This analysis should be replicated on more years of data, as well as in other hospitals, to confirm the potential benefit careful monitoring of diagnosis data might have for syndromic surveillance systems. The complaint and diagnostic criteria used for analysis have not been validated in other syndromic surveillance systems and were derived by the investigators based on the CDC clinical criteria for ILI for the 2005–2006 season. If the CDC definition for ILI changes, it is possible that the categories we used would need to be revised. Nonetheless, we do not expect the symptoms of influenza to change significantly from year to year, and would still include fever, upper respiratory symptoms, myalgias, etc. We do not have laboratory confirmation of influenza cases to validate our criteria. Additionally, the CDC data used for comparison in our study is for a broad geographic area, the South Atlantic region. Comparing a single urban hospital’s ED data to this broad regional data may not be an accurate comparison if the data for the District of Columbia was significantly different than the CDC regional data. Although it may be worth the wait for ICD-9 diagnoses, this depends on early electronic coding of the diagnosis, which does not occur in all hospital systems.
A strength of the paper is that even though the diagnosis of influenza was not laboratory confirmed, we were still able to demonstrate the beginning of the influenza season by our data using fine-tuned statistical detection algorithms. In this urban center, testing is not currently part of triage protocols, as it is at some other hospitals. Thus, reliance on chief complaint or diagnosis codes may provide earlier indication of the start of the influenza season in this case.
CONCLUSION
Both analyses suggest the ED diagnosis may contain more specific and useful information for detection of outbreaks of ILI than chief complaint. This is not to say that the ED diagnosis is more accurate, more useful, or even different than the chief complaint for all patients. However, where an EMR is available, the short delay between chief complaint and diagnosis may be a price worth paying for the additional information for patients whose ED diagnosis is more accurate than their chief complaint, so both are desirable.
Footnotes
Supervising Section Editor: Scott E. Rudkin, MD, MBA
Submission history: Submitted August 28, 2009; Revision Received July 22, 2009; Accepted July 22, 2009
Full text available through open access at http://escholarship.org/uc/uciem_westjem
Address for Correspondence: Larissa May, MD, MS, Department of Emergency Medicine, The George Washington University, 2150 Pennsylvania Ave, NW, Suite 2B, Washington, DC, 20037
Email: larissa.may@gmail.com
Conflicts of Interest: By the WestJEM article submission agreement, all authors are required to disclose all affiliations, funding sources, and financial or management relationships that could be perceived as potential sources of bias. The authors disclosed none.
REFERENCES
1. Stoto MA, Schonlau M, Mariano L. Syndromic surveillance: Is it worth the effort? Chance.2004;17(1):19–24.
2. Reis BY, Mandl KD. Syndromic surveillance: The effects of syndrome grouping on model accuracy and outbreak detection. Ann Emerg Med. 2004;44(3):235–41. [PubMed]
3. Chapman WW, Dowling JN, Wagner MM. Classification of emergency department chief complaints into 7 syndromes: A retrospective analysis of 527,228 patients. Ann Emerg Med. 2005;46(5):445–55. [PubMed]
4. Mikosz CA, Silva J, Black S, et al. Centers for Disease Control and Prevention (CDC) Comparison of two major emergency department-based free-text chief-complaint coding systems. MMWR Morb Mortal Wkly Rep. 2004;53(Suppl):101–5. [PubMed]
5. Begier EM, Sockwell D, Branch LM, et al. The national capitol region’s emergency department syndromic surveillance system: Do chief complaint and discharge diagnosis yield different results?Emerg Infect Dis. 2003;9(3):393–6. [PMC free article] [PubMed]
6. Fiore AE, Shay DK, Haber P, et al. Centers for Disease Control and Prevention (CDC). Prevention and Control of Influenza. Recommendations of the Advisory Committee on Immunization Practices, 2007. MMWR Morb Mortal Wkly Rep. 2007;53(RR-6):1–54.
7. Centers for Disease Control. CDC Influenza Season Summary. 2005–2006. Available at:http://www.cdc.gov/flu/weekly/weeklyarchives2005-2006/05-06summary.htm. Accessed February 18, 2007.
8. Woodall WH. The use of control charts in health-care and public-health surveillance. J Qual Technol. 2006;38(2):89–1049.
9. Lasko TA, Bhagwat JG, Zou KH, et al. The use of receiver operating characteristic curves in biomedical informatics. J Biomed Inform. 2005;38(5):404–15. [PubMed]
10. Montgomery DC. Introduction to Statistical Quality Control. 4th ed. New York, NY: John Wiley & Sons; 2001.
11. Stoto MA, Fricker RD, Jain AK, et al. Evaluating statistical methods for syndromic surveillance. In: Olwell D, Wilson AG, Wilson G, editors. Statistical Methods in Counter-Terrorism. New York, NY: Springer; 2006. pp. 141–72.
12. Stoto MA, Jain A, Griffin BA, et al. Fine-tuning and evaluation of detection algorithms for syndromic surveillance. National Syndromic Surveillance Conference, October 2006, Baltimore, MD. Advances in Disease Surveillance. 2007;2:213.
13. Beitel AJ, Olson KL, Reis BY, et al. Use of emergency department chief complaint and diagnostic codes for identifying respiratory illness in a pediatric population. Pediatr Emerg Care.2004;20(6):355–60. [PubMed]
14. Bourgeois FT, Olson KL, Brownstein JS, McAdam AJ, Mandl KD. Validation of syndromic surveillance for respiratory infections. Ann Emerg Med. 2006;47(3):265.e1. [PubMed]
15. Espino JU, Wagner MM. Accuracy of ICD-9-coded chief complaints and diagnoses for the detection of acute respiratory illness. Proc AMIA Symp. 2001:164–8. [PMC free article] [PubMed]
16. Fleischauer AT, Silk BJ, Schumacher M, et al. The validity of chief complaint and discharge diagnosis in emergency department-based syndromic surveillance. Acad Emerg Med.2004;11(12):1262–7. [PubMed]
17. Buehler JW, Hopkins RS, Overhage JM, et al. CDC Working Group Framework for evaluating public health surveillance systems for early detection of outbreaks: Recommendations from the CDC working group. MMWR Recomm Rep. 2004;53(RR-5):1–11. [PubMed]
18. Cochrane DG. Perspective of an emergency physician group as a data provider for syndromic surveillance. MMWR Morb Mortal Wkly Rep. 2004;53(Suppl):209–14. [PubMed]
19. Buehler JW. Centers for Disease Control and Prevention (CDC). Review of the 2003 national syndromic surveillance conference–lessons learned and questions to be answered. MMWR Morb Mortal Wkly Rep. 2004;53(Suppl):18–22. [PubMed]
20. Stoto MA. Syndromic surveillance in public health practice. Prepared for the IOM Forum on Microbial Threats Workshop on Infectious Disease Surveillance and Detection. 2007.