| Author | Affiliation |
|---|---|
| Sana Muazzam MSc | Century Circle, Atlanta, Georgia |
| Monica H. Swahn PhD, MPH | Institute of Public Health, Georgia State University, Atlanta, Georgia |
| Hasanat Alamgir PhD | School of Public Health, University of Texas, Texas |
| Muazzam Nasrullah MD, MPH | Rollins School of Public Health, Emory University, Atlanta, GeorgiaInjury Control Research Center, West Virginia University, Morgantown, West Virginia |
ABSTRACT
Introduction:
Poisoning, specifically unintentional poisoning, is a major public health problem in the United States (U.S.). Published literature that presents epidemiology of all forms of poisoning mortalities (i.e., unintentional, suicide, homicide) together is limited. This report presents data and summarizes the evidence on poisoning mortality by demographic and geographic characteristics to describe the burden of poisoning mortality and the differences among sub-populations in the U.S. for a 5-year period.
Methods:
Using mortality data from the Center for Disease Control and Prevention’s Web-based Injury Statistics Query and Reporting System, we presented the age-specific and age-adjusted unintentional and intentional (suicide, homicide) poisoning mortality rates by sex, age, race, and state of residence for the most recent years (2003–2007) of available data. Annual percentage changes in deaths and rates were calculated, and linear regression using natural log were used for time-trend analysis.
Results:
There were 121,367 (rate=8.18 per 100,000) unintentional poisoning deaths. Overall, the unintentional poisoning mortality rate increased by 46.9%, from 6.7 per 100,000 in 2003 to 9.8 per100.000 in 2007, with the highest mortality rate among those aged 40–59 (rate=15.36), males (rate=11.02) and whites (rate=8.68). New Mexico (rate=18.2) had the highest rate. Unintentional poisoning mortality rate increased significantly among both sexes, and all racial groups except blacks (p<0.05 time-related trend for rate). Among a total of 29,469 (rate=1.97) suicidal poisoning deaths, the rate increased by 9.9%, from 1.9 per 100,000 in 2003 to 2.1 per 100,000 in 2007, with the highest rate among those aged 40–59 (rate=3.92), males (rate=2.20) and whites (rate=2.24). Nevada (rate=3.9) had the highest rate. Mortality rate increased significantly among females and whites only (p<0.05 time-related trend for rate). There were 463 (rate=0.03) homicidal poisoning deaths and the rate remained the same during 2003–2007. The highest rates were among aged 0–19 (rate=0.05), males (rate=0.04) and blacks (rate=0.06).
Conclusion:
Prevention efforts for poisoning mortalities, especially unintentional poisoning, should be developed, implemented and strengthened. Differences exist in poisoning mortality by age, sex, location, and these findings underscore the urgency of addressing this public health burden as this epidemic continues to grow in the U.S.
INTRODUCTION
Poisoning is a major public health problem worldwide and a leading cause of injury death in the United States (U.S.).1,2 Moreover, mortality due to unintentional drug poisoning increased by 62% from 1999 to 2004 in the U.S.3 The largest increase in unintentional poisoning mortality was observed among adults aged 20–29 years and 45–54 years, women, white, or populations living mostly in rural states.4 Accordingly, there appears to be important differences in the population groups that are more vulnerable to poisoning mortality.
Opioid pain medications like methadone, hydrocodone or oxycodone resulted in 93% of unintentional poisoning deaths in 2007, making these substances the most common hazard for poisoning mortality.2 There are growing concerns regarding overdoses of prescription drugs and the increase in the number of hospitalizations due to intentional or unintentional misuse of these drugs in the U.S.5 Similarly, suicide mortality due to poisoning by drugs or alcohol resulted in 75% of all poisoning deaths in the U.S with one third of these suicides resulting from a combination of alcohol and prescription drugs.6
Homicidal poisoning, though rarely described in the literature, is also an important public health concern in the U.S.7 Men, infants, and blacks were reported to be at higher risk for homicidal poisoning.7 Drugs were the most commonly used means of homicidal poisoning, and the prevalence was higher in California, Washington, and Texas during the 1990s. 7,8
There is a scarcity of published reports that together present all three forms of poisoning mortality (i.e., unintentional, suicide, homicide). This report presents descriptive epidemiology of poisoning mortality data for the most recent years available (2003–2007). Findings from this study could be used to inform and formulate prevention strategies targeting sub-groups of the population that may be at higher risk of poisoning deaths.
METHODS
Data Source and Management
We obtained data from the Center for Disease Control and Prevention (CDC) Web-based Injury Statistics Query and Reporting System (WISQARS).9 The WISQARS provides mortality data on residents of the U.S., which was obtained from death certificates provided by the National Vital Statistics System. The details of WISQARS have been explained elsewhere.10–12 We analyzed the linear trends in unintentional and intentional poisoning mortalities during 2003–2007 using deaths and age-adjusted death rates by gender, age groups, race and state, while we plotted the data by race only. The small number of cases (n<20) for certain population categories may produce unreliable rates.13 Percent change in population categories with deaths ≤ 9 were not presented in the tables.4
In terms of classifying poisoning deaths as unintentional, or intentional, we used the following criteria: We identified decedents with unintentional poisoning mortalities using ICD-10 codes (International Classification of Diseases, Version 10) X40-X49 which classifies overdoses of illegal drugs and legal drugs taken for nonmedical reasons, and poisoning from legal drugs taken in error or at the wrong dose, and poisoning from other substances (e.g., alcohol, pesticides, or carbon monoxide). Similarly, we identified intentional poisoning mortalities, including suicide and homicide, using the following ICD-10 codes: X60-X69 involving suicide by exposure to pesticides, gases and vapors, unspecified chemicals and noxious substances, alcohol, other drugs acting on the autonomic nervous, narcotics, other sedatives and hypnotics and antidepressants; X85-X90 involving assault by drugs, corrosive substances, pesticides, gas and vapors, unspecified chemical and noxious substance, and Y35.2, which includes legal intervention involving gas. We considered all ICD-10 codes for unintentional and intentional poisoning mortalities as given in CDC’s WISQARS.
We categorized the age of selected individuals (0–79+ years) into four subgroups (0–19, 20–39, 40–59 and 60–79+years). Races were categorized as whites, blacks, American Indians/ Alaska Natives, Asian/ Pacific Islanders.
Data Analysis
We used Microsoft Excel and SPSS software (version 15, SPSS Inc. Chicago, USA) for data analyses, and we selected alpha of p<0.05 for determining statistical significance. We used the annual percentage change in rates to measure the linear trend calculated as (the rate in the ending year – the rate in the beginning year) / (the rate in the beginning year) X 100. The same formula was used to measure the linear trend for deaths. We computed comparisons of proportions between groups (sex and race) using a Chi-square test. To normalize the distribution curve, we rescaled the deaths and rates to natural logged deaths and rates respectively. We used linear regression for time trend analysis for 2003–2007, and to examine its significance.
RESULTS
Unintentional Poisoning
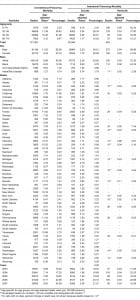
During 2003–2007, there were 121,367 unintentional poisoning deaths, representing 20.8% of all unintentional injury death (n=584,091) in the U.S. (Table 1). Overall, the unintentional poisoning mortality rate increased 46.9% from 6.7 to 9.8 per 100,000 . Unintentional poisoning mortalities varied by state with the highest rate in New Mexico (rate=18.2) (Table 1).

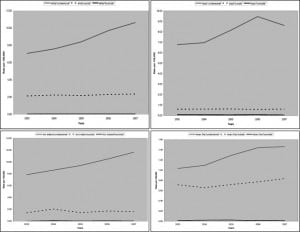
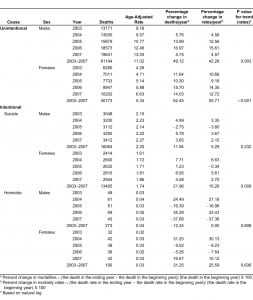
Overall the unintentional poisoning mortality rate increased by 42.3% among males (p=0.003 time-related trend for rate) and 55.7% among females (p<0.001 time-related trend for rate) (Table 2). Except for blacks, the rate significantly increased for all racial subgroups examined (p<0.05 time-related trend) (Figure 1).


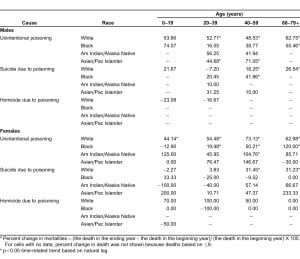
Sub-group analysis revealed the highest significant increase among white males aged 60–79+ years (62.8%), black males aged 60–79+ years (55.5%) and Asian/ Pacific Islanders males aged 40–59 years (71.1%) (p<0.05 time-related trend) (Table 3). Similarly among females, the highest significant increase was among whites aged 40–59 years (73.1%), and blacks aged 60–79+ years (120.0%) (p<0.05 time-related trend) (Table 3).

Intentional Poisoning
During 2003–2007, there were 29,469 suicide poisoning deaths and 463 homicide poisoning deaths representing 11.7% of all intentional injury deaths (n=256,478) in the U.S. (Table 1)
Among all intentional poisoning mortalities, 16,093 (54.61%) suicidal deaths were reported among aged 40–59 years, 16,064 (54.51%; rate=2.20) were males and 27,572 (93.6%; rate = 2.24) were whites (Table 1). Total suicidal poisoning mortality rate increased 9.9%, from 1.9 to 2.1 per 100,000. Suicidal poisoning mortalities varied by state with the highest rate in Nevada (rate=3.9) (Table 1). Overall suicidal poisoning mortality rate increased by 5.3% among males (p=0.232 time-related trend) and 15.3% among females (p=0.009 time-related trend) (Table 2). Among racial subgroups, the rate increased significantly only among whites (p=0.032 time-related trend) (Figure 1).
Among all intentional poisoning mortalities, 196 (42.33%; rate=0.05) homicidal deaths were reported among aged 0–19 years, 273 (58.96%; rate=0.04) were males and 335 (72.4%; rate= 0.03) were whites (Table 1). The rate of homicidal poisoning mortality remained the same from 2003 to 2007. The trends of homicidal poisoning rates among both sexes are shown in Table 2, and percentage changes among racial groups by sex are shown in Tables 3.
DISCUSSION
Our findings confirmed earlier reports that poisoning mortality rates increased significantly between 2003 and 2007.14 For unintentional poisoning deaths, this was particularly noticed for both males and females, and for suicide poisonings, this was noticed for females only. There was an increasing trend among all racial groups for unintentional poisoning deaths, but for suicide poisonings the increasing trend was noticed only among whites.
Unintentional Poisoning
The primary cause of unintentional poisoning deaths in the U.S is drug overdose, more specifically, prescription and illegal drugs.14 Several factors may be related to these findings and have been discussed in the literature. The key explanation, however, appears to be the excessive prescription of opioids analgesics, as well as the increased availability of these drugs.3 Prescription patterns and rates may vary across geographic regions.3 It had been suggested that medical doctors in rural areas, who are mostly primary-care physicians, may lack the experience and training in managing patients with long-term opioid use compared to specialists well trained in pain management.3,15 Further, the lack of uniform prescription monitoring plans in every state, as well as the increased pressure on emergency physicians to see a increasingly larger number of patients, appear to further exacerbate this issue. It is also well recognized that some patients seek prescriptions from multiple physicians at the same time, making it very difficult to monitor the actual drug intake.16,17
Our study also confirmed that males had higher (about double the rate) unintentional poisoning mortality rate than females in the U.S., with the highest increase among individuals aged 41–50 years.18–21 Similar to our findings, previous research showed that individuals aged 35 through 44 years had a significantly greater mortality rate. These mortalities mostly involved a drug without a documented prescription and having received prescriptions for controlled substances from 5 or more clinicians during the year prior to death.17 Also, easy, cost-free availability of pain relievers, tranquilizers, stimulants, and sedatives from a friend or relative has also been found to be associated with drug abuse.22
Our study also showed geographic variation in terms of the poisoning mortality rates. For instance, in New-Mexico, during 1990–2005, the proportion of total unintentional poisoning mortality involving heroin, prescription opioids, cocaine and alcohol/drug increased from 89% to 98%.23 The rate of unintentional poisoning mortality was found to have doubled in 23 states with the most pronounced increase observed in rural states including West Virginia.24 The state of West Virginia experienced the nation’s highest increase of 550% from 1999 to 2004, and the majority of these deaths were from unintentional overdoses of methadone or other opioid analgesics. 24–25 These regional patterns and differences should be examined more closely to determine if policies and laws, enforcement level, physician practices, drug trafficking routes, or other factors contribute to these variations across states.
Intentional Poisoning
In our study, the suicidal poisoning mortality rate increased from 2003 to 2007. Over the past years self-harm poisoning increased in the U.S. with an annual 1.8% increase in suicide mortality during 1999–2005.26–28 The highest proportion of suicidal deaths were reported among those aged 40–59 years. Previous research showed that among various methods used for suicide, younger people were more likely to use poisoning, followed by firearms and suffocation.29 Even though all suicide deaths were significantly greater among males than females, there was a significant increase in the trend among females for suicidal poisoning. Similarly to unintentional poisoning mortality, whites and American Indian/Alaska Natives had the highest suicidal rates per 100,000 population in 2007. Moreover, it was estimated that the risk of dying from suicide is more than double for the white than the black population.30 Several factors, including history of mental health problems, alienation from family and community, having a friend who attempted suicide, weekly consumption of hard liquor, a family history of a suicide or attempt, poor self-perception of health, a history of physical abuse, and sexual abuse, were reported to be associated with suicide attempts among American Indians.31
Future Directions
Recognizing the growing and devastating impact of unintentional drug overdose, CDC has recommended some methods to prevent unintentional poisoning mortality. To lessen the harm associated with drug abuse, there must be strict measures in place for improving physician awareness, supporting treatment for drug dependence, appropriate prescribing practices of medications by physicians, and identifying patients through prescription-monitoring programs who are getting multiple prescriptions.14 Further, clinicians need strategies to better adhere to chronic pain management guidelines, and counsel their patients about the risk of opioid drug overdose.32
To reduce the suicidal poisoning rate, the U.S. Department of Health and Human Services proposed a more targeted approach that should consider risk factors most important and appropriate for selected populations at risk.26 Since the majority of suicides occur due to drug and alcohol overdose, limiting access to these substances, especially availability of over-the-counter drugs such as acetaminophen, antidepressants, and benzodiazepines to those under psychological or emotional stress, could be helpful measures.6 Further, reduction in the package size of acetaminophen in Europe has shown promise in lowering the number of incidents of suicidal overdose, liver toxicity, and mortality from acetaminophen ingestions, which could be a useful alternative in reducing suicidal poisoning in the U.S. 33,34
Although the homicidal poisoning mortality rate remains low with a stable trend from 2003 to 2007 as reported in our study, continuous surveillance of these mortality cases among high risk groups is warranted to develop targeted interventions.
LIMITATIONS
The diagnoses provided on the death certificate may be erroneous or incomplete, leading to misclassification of condition under study.35 Lack of availability of detailed data from death certificates is influenced by varying methods of completion of death certificates. For example, details are lacking on socioeconomic factors, exposure data, individual behaviors, cultural differences, and risk factors that are extremely important for the development of effective interventions. We did not include non-fatal injuries in our analysis, which may be useful in comparative analyses between fatal and non-fatal unintentional and intentional poisoning. Finally, the small number of cases for certain population categories by age, race and state should be interpreted with caution. Despite these limitations, our study provides valuable data on current trends of unintentional and intentional poisoning mortality in the U.S. that can be used to devise interventions for high-risk groups.
CONCLUSION
In the U.S., during 2003–2007, the overall unintentional poisoning and suicidal poisoning mortality rates increased, while homicidal poisoning rates remained stable. Certain population groups such as males, individuals aged 40–59 and American Indians with substantially higher unintentional poisoning mortality rates appeared particularly vulnerable. Moreover, increase in unintentional and suicidal poisoning rates were also noted among women. Prevention efforts for poisoning mortalities and especially unintentional poisoning should be undertaken and strengthened, and close surveillance for these death data should continue to follow future trends. Targeted interventions for men and women are warranted. Overall, these findings underscore the urgency of addressing the differences in poisoning mortality more proactively and to better determine prevention strategies so that these deaths can be avoided as this epidemic continues to grow in the U.S.
Footnotes
Supervising Section Editor: Abigail Hankin, MD, MPH
Submission history: Submitted January 16, 2012; Revision received March 13, 2012; Accepted March 14, 2012
Reprints available through open access at http://escholarship.org/uc/uciem_westjem
DOI: 10.5811/westjem.2012.3.11762
Address for correspondence: Sana Muazzam, MSc
1740 Century Circle, # 1381, Atlanta, GA 30345
Email: sana.muazzam@gmail.com.
Conflicts of Interest: By the WestJEM article submission agreement, all authors are required to disclose all affiliations, funding sources and financial or management relationships that could be perceived as potential sources of bias. The authors disclosed none.
REFERENCES
1. World Health Organization. Poisoning Prevention and Management. 2011 Available at:http://www.who.int/ipcs/poisons/en/. Accessed March 15.
2. Centers for Disease Control and Prevention. Poisoning in the United States: Fact Sheet. 2011 Available at: http://www.cdc.gov/HomeandRecreationalSafety/Poisoning/poisoning-factsheet.htm. Accessed March 15.
3. Paulozzi LJ, Xi Y. Recent changes in drug poisoning mortality in the United States by urban-rural status and by drug type. Pharmacoepidemiol Drug Saf. 2008;17(10):997–1005. [PubMed]
4. Hu G, Baker SP. Trends in unintentional injury deaths, U.S., 1999–2005: age, gender, and racial/ethnic differences. Am J Prev Med. 2009;37(3):188–94. [PubMed]
5. Coben JH, Davis SM, Furbee PM, et al. Hospitalizations for poisoning by prescription opioids, sedatives, and tranquilizers. Am J Prev Med. 2010;38(5):517–24. [PubMed]
6. Centers for Disease Control and Prevention. Suicides Due to Alcohol and/or Drug Overdose. 2011Available at: http://www.cdc.gov/violenceprevention/pdf/NVDRS_Data_Brief-a.pdf. Accessed August 4.
7. Shepherd G, Ferslew BC. Homicidal poisoning deaths in the United States 1999–2005. Clin Toxicol (Phila) 2009;47(4):342–7. [PubMed]
8. Westveer AE, Jarvis JP, Jensen CJ. Homicidal poisoning: the silent offense. FBI Law Enforcement Bulletin 2004. 2011 Available at:http://www2.fbi.gov/publications/leb/2004/august04/august04leb.htm. Accessed October 3.
9. Centers for Disease Control and Prevention. WISQARS Injury Mortality Reports, 1999 – 2007.National Center for Injury Prevention and Control 2010. 2011 Available at:http://webappa.cdc.gov/sasweb/ncipc/mortrate10_sy.html. Accessed November 1.
10. Alamgir H, Muazzam S, Nasrullah M. Unintentional falls mortality among elderly in the United States: Time for action. Injury. 2012 [Epub ahead of print]
11. Nasrullah M, Muazzam S. Unintentional struck by/struck against injury mortality in the United States, 1999–2006. J Immigr Minor Health. 2011;13(5):948–53. [PubMed]
12. Nasrullah M, Muazzam S. Drowning mortality in the United States, 1999–2006. J Community Health. 2011;36(1):69–75. [PubMed]
13. Centers for Disease Control and Prevention. Data Sources for WISQARS Fatal. 20062011 Available at: http://www.cdc.gov/ncipc/wisqars/fatal/help/datasources.htm#6.3. Accessed June 20.
14. Centers for Disease Control and Prevention. Unintentional poisoning deaths–United States, 1999–2004. MMWR Morb Mortal Wkly Rep. 2007;56(5):93–6. [PubMed]
15. Breuer B, Pappagallo M, Tai JY, et al. U.S. board-certified pain physician practices: uniformity and census data of their locations. J Pain. 2007;8(3):244–50. [PubMed]
16. National Institute of Drug Abuse. Preventing and recognizing prescription drug abuse. 2011Available at: http://drugabuse.gov/ResearchReports/Prescription/prescription6.html. Accessed October 3.
17. Hall AJ, Logan JE, Toblin RL, et al. Patterns of Abuse among Unintentional Pharmaceutical Overdose Fatalities. JAMA. 2008;300(22):2613–20. [PubMed]
18. Bohnert AS, Fudalej S, Ilgen MA. Increasing poisoning mortality rates in the United States, 1999–2006. Public Health Rep. 2010;125(4):542–7. [PMC free article] [PubMed]
19. Warner M, Chen LH, Makuc DM. Increase in fatal poisonings involving opioid analgesics in the United States, 1999–2006. NCHS Data Brief. 2009;(22):1–8. [PubMed]
20. Piercefield E, Archer P, Kemp P, et al. Increase in unintentional medication overdose deaths: Oklahoma. Am J Prev Med. 1994–2006;39(4):357–63.
21. Paulozzi LJ, Budnitz DS, Xi Y. Increasing deaths from opioid analgesics in the United States.Pharmacoepidemiol Drug Saf. 2006;15(9):618–27. [PubMed]
22. Substance Abuse and Mental Health Services Administration [SAMHSA] Results from the 2008 National Survey on Drug Use and Health: National Findings. 2011 Available at:http://www.oas.samhsa.gov/nsduh/2k8nsduh/2k8Results.cfm. Accessed October 4.
23. Shah NG, Lathrop SL, Reichard RR, et al. Unintentional drug overdose death trends in New Mexico, USA, 1990–2005: combinations of heroin, cocaine, prescription opioids and alcohol. Addiction.2008;103(1):126–36. [PubMed]
24. Buddy T. Drug Overdose Deaths Double in Five Years. 2011 Available at:http://alcoholism.about.com/od/prescription/a/overdose.-Lz6.htm. Accessed September 27.
25. Paulozzi LJ, Logan JE, Hall AJ, et al. A comparison of drug overdose deaths involving methadone and other opioid analgesics in West Virginia. Addiction. 2009;104(9):1541–8. [PubMed]
26. Prosser JM, Perrone J, Pines JM. The epidemiology of intentional non-fatal self-harm poisoning in the United States: 2001–2004. J Med Toxicol. 2007;3(1):20–4. [PubMed]
27. Brickman AL, Mintz DC. Datapoints: U.S. rates of self-inflicted injuries and suicide, 1992–1999.Psychiatr Serv. 2003;54(2):168. [PubMed]
28. Hu G, Wilcox HC, Wissow L, et al. Mid-life suicide: an increasing problem in U.S. Whites, 1999–2005. Am J Prev Med. 2008;35(6):589–93. [PubMed]
29. National Institute of Mental Health. Suicide in the U.S.: Statistics and Prevention. 2011 Available at:http://www.nimh.nih.gov/health/publications/suicide-in-the-us-statistics-and-prevention/index.shtml. Accessed October 6.
30. Hoyert DL HM, Murphy SL, Kung H. Deaths: Final data for 2003. National Vital Statistics Reports.2006;54(13)
31. Grossman DC, Milligan BC, Deyo RA. Risk factors for suicide attempts among Navajo adolescents.Am J Public Health. 1991;81(7):870–4. [PMC free article] [PubMed]
32. Trescot AM, Boswell MV, Atluri SL, et al. Opioid guidelines in the management of chronic non-cancer pain. Pain Physician. 2006;9(1):1–39. [PubMed]
33. Hawton K, Simkin S, Deeks J, et al. UK legislation on analgesic packs: before and after study of long term effect on poisonings. BMJ. 2004;329(7474):1076. [PMC free article] [PubMed]
34. Garnier R, Bismuth C. Liver failure induced by paracetamol. BMJ. 1993;306(6879):718.[PMC free article] [PubMed]
35. Kircher T, Nelson J, Burdo H. The autopsy as a measure of accuracy of the death certificate. N Engl J Med. 1985;313(20):1263–9. [PubMed]


