
| Author | Affiliation |
|---|---|
| Michael J. Ward, MD, MBA | Vanderbilt University, Department of Emergency Medicine, Nashville, Tennessee |
| Olesya Baker, PhD | Brigham and Women’s Hospital, Department of Emergency Medicine, Boston, Massachusetts |
| Jeremiah D. Schuur, MD, MHS | Brigham and Women’s Hospital, Department of Emergency Medicine, Boston, Massachusetts |
Introduction
Materials and methods
Results
Discussion
Limitations
Conclusion
ABSTRACT
Introduction
With the majority of U.S. hospitals not having primary percutaneous coronary intervention (pPCI) capabilities, the time spent at transferring emergency departments (EDs) is predictive of clinical outcomes for patients with ST-elevation myocardial infarction (STEMI). Compounding the challenges of delivering timely emergency care are the known delays caused by ED crowding. However, the association of ED crowding with timeliness for patients with STEMI is unknown. We sought to examine the relationship between ED crowding and time spent at transferring EDs for patients with STEMI.
Methods
We analyzed the Centers for Medicare and Medicaid Services (CMS) quality data. The outcome was time spent at a transferring ED (i.e., door-in-door-out [DIDO]), was CMS measure OP-3b for hospitals with ≥10 acute myocardial infarction (AMI) cases requiring transfer (i.e., STEMI) annually: Time to Transfer an AMI Patient for Acute Coronary Intervention. We used four CMS ED timeliness measures as surrogate measures of ED crowding: admitted length of stay (LOS), discharged LOS, boarding time, and waiting time. We analyzed bivariate associations between DIDO and ED timeliness measures. We used a linear multivariable regression to evaluate the contribution of hospital characteristics (academic, trauma, rural, ED volume) to DIDO.
Results
Data were available for 405 out of 4,129 hospitals for the CMS DIDO measure. These facilities were primarily non-academic (99.0%), non-trauma centers (65.4%), and in urban locations (68.5%). Median DIDO was 54.0 minutes (IQR 42.0,68.0). Increased DIDO time was associated with longer admitted LOS and boarding times. After adjusting for hospital characteristics, a one-minute increase in ED LOS at transferring facilities was associated with DIDO (coefficient, 0.084 [95% CI [0.049,0.119]]; p<0.001). This translates into a five-minute increase in DIDO for every one-hour increase in ED LOS for admitted patients.
Conclusion
Among patients with STEMI presenting to U.S. EDs, we found that ED crowding has a small but operationally insignificant effect on time spent at the transferring ED.
INTRODUCTION
Timeliness of myocardial perfusion is an important predictor of long-term outcomes for patients with ST-elevation myocardial infarction (STEMI). 1 Since the majority of hospitals in the U.S. do not have primary percutaneous coronary intervention (pPCI) capabilities, 2 many STEMI patients require transfer to pPCI-capable facilities to restore myocardial perfusion. More time spent at transferring emergency departments (EDs) has been shown to be associated with increased mortality for patients with STEMI. 3 Further heightening the importance of the role of the ED and its timeliness is that most patients with STEMI initially present to U.S. EDs. 4 Not only are transfers from U.S. EDs increasing in frequency for patients with STEMI, 5 but the time spent at transferring EDs is longer and more variable than either the transportation or pPCI center phases. Considering the role of the emergency care system is to rapidly identify, coordinate and treat time-sensitive emergency conditions like STEMI, the timeliness and performance of the ED for patients with STEMI is central to high-quality care.
To measure the timeliness of transferring EDs, the American Heart Association (AHA) recognizes a quality measure called the “door-in-door-out” time (DIDO) interval. 6 While no specific time benchmark is endorsed, studies recommend that DIDO should be no longer than 30 or 45 minutes before clinical outcomes are diminished. 3, 7 However, only 10% of transferred STEMIs met the more stringent 300-minute benchmark. 3 Potentially influencing the ability of EDs to meet these timeliness goals is ED crowding. Studies of ED crowding and prolonged ED length of stay (LOS) have found associations with lower quality care. 8 However, the influence of ED crowding and timeliness of patient transfer for STEMI is unknown. Considering that unique policies exist, such as prehospital and triage electrocardiograms (EKGs), and guidelines for timeliness, EDs have developed policies to identify STEMIs in the setting of crowding. Therefore, we sought to quantify the association between ED crowding and time spent at transferring EDs for patients with STEMI in U.S. EDs.
MATERIALS AND METHODS
We analyzed the Centers for Medicare and Medicaid Services (CMS) hospital quality data from 2012. The primary outcome, DIDO, is CMS measure OP-3b, ED Median Time to Transfer a Patient with acute myocardial infarction (AMI) for acute coronary intervention. OP-3b data included hospitals with ≥10 AMI cases annually. While the term AMI includes a broader group of cardiovascular emergencies, OP-3b only measures those with STEMI and new left bundle branch block requiring acute coronary intervention. 9 We selected four surrogate measures of ED crowding for our analyses. Our primary measure of ED crowding was ED-1: median ED LOS for admitted patients. We hypothesized that ED LOS for admitted patients would explain significant variation in DIDO for several reasons. First, boarding of admitted patients in the ED was identified by the 2006 Institute of Medicine report, Hospital-Based Emergency Care, as a key cause of crowding in the ED. 10 Second, the proportion of ED patients admitted and higher inpatient occupancy rates were associated with increased ED LOS. 11 Last, ED admitted LOS may be more reflective of STEMI ED patient care as the severity of illness for STEMI patients is more comparable to patients admitted from the ED rather than those who are discharged.
Beyond ED admitted LOS, we included additional ED timeliness measures in our analyses: 1) discharged LOS (OP-18b: Median ED LOS for Discharged Patients); 2) boarding time (ED-2: Median time from admit decision time to time of departure from ED for ED patients admitted to inpatient status); and 3) waiting time to be seen by a clinical provider (OP-20: Door to Diagnostic Evaluation by a Qualified Medical Professional).
We identified facilities that were eligible to report OP-3b. Of those that reported OP-3b, we examined the distribution of DIDO times by facility types and facility characteristics. Facility types were obtained from the AHA annual survey and included academic, trauma center, rural/urban location (U.S. Department of Agriculture classification) and number of hospital beds (i.e., bed size). Facility characteristics included ED patient volume, ED admitted LOS, ED discharged LOS, boarding time, and waiting time. We used a bivariate linear regression model to determine the relationship between DIDO and ED crowding measures (admitted LOS, discharged LOS, boarding time, and waiting time). We used a multivariable linear model to evaluate the contribution of hospital characteristics to DIDO. The model assumed normally distributed errors, homoscedasticity, and a low degree of multicollinearity. We also selected the longer of the two DIDO benchmarks, 45 minutes, since few EDs met the more stringent 30-minute benchmark and would be unlikely to be implemented in practice. 3 We tested whether ED crowding measures were affected if EDs met this 45-minute benchmark for DIDO using a two-sample t-test with a level of significance of P<0.05. We conducted all analyses using Stata v13.1 (College Station, TX).
RESULTS
We identified 405 out of 4,129 hospitals eligible for inclusion with >10 cases; 1,406 had between one and 10 cases to report, 923 had no cases, and 1,395 did not have results available for the reporting period. Included facilities were primarily non-academic (99.0%), non-trauma centers (65.4%), in urban locations (68.5%). Overall median DIDO was 54.0 minutes (IQR 42.0, 68.0). We report DIDO performance by facility characteristics and ED crowding measure (Table 1 and 2).
| N | % | Mean DIDO | Median DIDO | Interquartile range | |
|---|---|---|---|---|---|
| All hospitals | 405 | 100 | 59.5 | 54.0 | 42.0, 68.0 |
| Academic status | |||||
| Academic | 4 | 1.00 | 71.0 | 76.0 | 58.5, 83.5 |
| Non-academic | 399 | 99.0 | 59.4 | 54.0 | 42.0, 67.0 |
| Trauma status | |||||
| Trauma | 140 | 34.6 | 62.2 | 54.0 | 43.0, 68.0 |
| Non-trauma | 265 | 65.4 | 58.1 | 53.0 | 42.0, 67.0 |
| Rural/urban status | |||||
| Rural | 127 | 31.5 | 65.0 | 59.0 | 45.0, 75.0 |
| Urban | 276 | 68.5 | 56.9 | 52.0 | 42.0, 66.0 |
| Hospital bed size* (by groups) | |||||
| 1–3 | 149 | 37.0 | 63.2 | 53.0 | 43.0, 70.0 |
| 4 | 161 | 40.0 | 57.8 | 55.0 | 42.0, 66.0 |
| 5–8 | 93 | 23.1 | 56.6 | 52.0 | 42.0, 68.0 |
| Emergency department yearly volume (quartile) | |||||
| Q1: 16–12,772 | 26 | 6.72 | 66.0 | 54.5 | 45.0, 84.0 |
| Q2: 12,954–27,420 | 130 | 33.6 | 63.3 | 55.0 | 45.0, 68.0 |
| Q3: 27,720–48,812 | 170 | 43.9 | 54.3 | 52.0 | 40.0, 63.0 |
| Q4: 49,264–337,128 | 71 | 18.1 | 57.5 | 55.0 | 43.0, 70.0 |
Hospital bed size ranges from the American Hospital Association website: 1) 6–24, 2) 25–49, 3) 50–99, 4) 100–199, 5) 200–299, 6) 300–399, 7) 400–499, 8) 500+.
| N | % | Mean DIDO | Median | Interquartile range | |
|---|---|---|---|---|---|
| ED admitted length of stay (LOS) (ED-1: median ED LOS for admitted patients) | |||||
| Q1: 84–215 minutes | 68 | 17.1 | 54.0 | 51.5 | 38.5, 63.0 |
| Q2: 216–259 | 139 | 35.0 | 60.1 | 51.0 | 44.0, 64.0 |
| Q3: 260–314 | 105 | 26.4 | 54.2 | 54.0 | 41.0, 64.0 |
| Q4: 316–1,031 | 85 | 21.4 | 66.9 | 60.0 | 48.0, 76.0 |
| ED discharged LOS (OP-18b: median ED LOS for discharged patients) | |||||
| Q1: 60–112 minutes | 82 | 21.0 | 56.0 | 53.0 | 42.0, 66.0 |
| Q2: 113–135 | 127 | 32.5 | 58.7 | 53.0 | 41.0, 65.0 |
| Q3: 136–162 | 105 | 26.9 | 58.6 | 55.0 | 43.0, 68.0 |
| Q4: 163–860 | 77 | 19.7 | 62.0 | 53.0 | 43.0, 70.0 |
| Boarding time (ED-2: median time from admit decision time to time of departure from ED for ED patients admitted to inpatient status) | |||||
| Q1: 0–61 minutes | 86 | 21.7 | 58.4 | 51.5 | 41.0, 67.0 |
| Q2: 62–88 | 122 | 30.8 | 58.2 | 52.0 | 43.0, 64.0 |
| Q3: 89–126 | 110 | 27.8 | 58.8 | 55.5 | 46.0, 66.0 |
| Q4: 127–584 | 78 | 19.7 | 61.4 | 59.0 | 42.0, 73.0 |
| Door-to-diagnostic evaluation (OP-20: door to diagnostic evaluation by a qualified medical professional ) | |||||
| Q1: 0–19 minutes | 90 | 23.1 | 55.2 | 50.0 | 40.0, 62.0 |
| Q2: 20–28 | 98 | 25.2 | 60.2 | 56.0 | 46.0, 66.0 |
| Q3: 29–40 | 114 | 29.3 | 59.2 | 55.5 | 45.0, 70.0 |
| Q4: 41–749 | 87 | 22.4 | 60.8 | 52.0 | 42.0, 70.0 |
*Door-in-door-out by ED crowding measures by quartile.
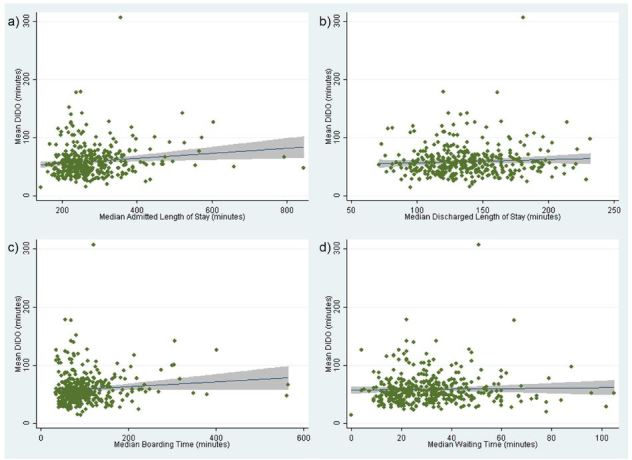
Of the reporting hospitals, 30.1% (119/396) met the 45-minute DIDO benchmark. In bivariate linear regression analyses of the four ED crowding measures and DIDO, median ED admitted LOS (coefficient, 0.044 [95% CI [0.012–0.076]]; p=0.007) and boarding time (coefficient, 0.043 [95% CI [0.001–0.085]]; p=0.047) were significantly associated with DIDO, while waiting time (p=0.6) and ED discharged LOS (p=0.2) were not associated with DIDO. Hospitals with an average DIDO <45 minutes had a significantly lower median ED admitted LOS than hospitals with DIDO ≥45 minutes (259 vs. 283 minutes; p=0.008). Similarly, median boarding times were significantly lower for those with average DIDO <45 versus those ≥45 minutes (90.0 vs. 105 minutes; p=0.027).
After adjusting for hospital characteristics, a one-minute increase in ED LOS at transferring facilities was associated with DIDO (coefficient, 0.084 [95% CI [0.049–0.119]]; p<0.001). This translates into a five-minute increase in DIDO for every one-hour increase in ED LOS for admitted patients. Among hospital characteristics, urban setting (coefficient, −9.52 [95% CI [−15.6 – −3.47]]; p=0.002), the third (coefficient, −13.3 [95% CI [−24.8- −1.73]]; p=0.024) and fourth (coefficient, −13.7 [95% CI [−26.8 – −0.655]]; p=0.040) highest quartiles of ED patient volumes were associated with shorter DIDO times. The scatterplots of each measure versus DIDO can be seen in the Figure.
We tested model assumptions of linearity, normality, homoscedasticity and correlation. To test for linearity, we plotted the standardized residuals against continuous predictor variables. We did not observe a nonlinear pattern, indicating that the linearity assumption was reasonable. The distribution of standardized residuals was slightly skewed due to the presence of outliers. We determined these outliers to be appropriate data points and decided to include them in the model. We tested for homoscedasticity by plotting residuals against fitted values, which produced a random scatter indicating homoscedasticity. Finally, we checked for multicollinearity using variance inflation factor (VIF). All explanatory variables had low VIF values.
DISCUSSION
We found that longer DIDO time for STEMI patients requiring transfer for acute coronary intervention was associated with a longer ED admitted LOS. However, an approximately one-hour increase in ED admitted LOS was associated with only a five-minute longer DIDO time – unlikely to be clinically significant as this duration represents approximately 4% of the maximum recommended benchmark. Such a small increase in DIDO for a large increase in ED LOS suggests that crowding may have a minimal effect on an ED’s ability to identify and transfer patients requiring acute coronary intervention.
Since the presentation of individual time-sensitive diseases (e.g., STEMI) can occur infrequently depending upon the ED’s patient volume, measures that capture hourly and daily ED performance for the general ED population may represent more effective measures of a system’s readiness to handle time-sensitive emergencies. Our findings suggest that measures dissimilar to the admitted population (e.g., overall ED LOS) may not reliably reflect timeliness for critical conditions such as STEMI. Moreover, performance measures involving admitted patients may be a better indicator of the quality of time-sensitive conditions (e.g., STEMI) compared with other crowding measures. For example, the boarding time measure captures the ED population who are admitted and waiting for a hospital bed. Considering that hospital congestion can limit bed availability in the ED, the degree of boarding affects not only admitted patients, but those who may be discharged home as well. On the other hand, other measures involving discharged patients and waiting time to see a clinician may not reflect the key process step for rapid diagnosis of a STEMI, namely EKG use. For example, in order to comply with the AHA guidelines for a rapid EKG, 6 EDs have developed evidence-based triage protocols to obtain EKGs on patients with symptoms suggestive of STEMI at arrival prior to clinician evaluation. 12 Concerning EKGs and patients with presentations consistent with STEMI can result in the patient bypassing any triage line and trigger early activation of the transfer process. Patients with a suspected STEMI are therefore likely to have a much shorter waiting time to be seen by an ED clinician as a direct result of these policies. However, patients with suspected STEMI represent a minority of the ED population, and therefore, true waiting times are likely to be much longer.
While we found a minimal influence of ED crowding on transfer timeliness, one finding of our study is that nearly 70% of included EDs did not meet the recommended 45-minute DIDO threshold. This finding is consistent with other studies examining the 45-minute benchmark. 7 This suggests that there is a substantial opportunity to improve the timeliness of transfers for patients with STEMI from U.S. EDs. As other studies have also identified a similarly poor national transfer performance, 3, 13 we recommend enhancing the prominence of transfer performance by publicly reporting the proportion of patients meeting the 45-minute benchmark. Doing so would provide more meaningful data to consumers and for quality improvement efforts.
LIMITATIONS
Our results should be considered in light of several limitations. As this is an administrative dataset, we did not know the pPCI capabilities of facilities, which may affect the timeliness and decision to transfer. We also did not know the proximity of each facility to pPCI centers; however, rural/urban status is a proxy measure for this facility characteristic. Since these facilities had ≥10 transfers annually, our results are not generalizable to facilities with lower patient volume (i.e., less than 10 transfers). While there were 1,395 facilities that had results unavailable for the reporting period, this likely had minimal effect on our results as eligible facilities face large financial penalties for not reporting measure OP-3b to CMS. Further, this group also includes critical access hospitals that likely care for few patients with STEMI.
CONCLUSION
Among STEMI patients presenting to U.S. EDs, we found that ED crowding has a small but operationally insignificant effect on STEMI DIDO times. These results suggest that ED performance during the transfer of STEMI patients is minimally affected by ED crowding. As few EDs meet a recommended transfer time of 45 minutes, we propose that CMS report the proportion of STEMI patients who meet recommended DIDO times.
Footnotes
Section Editor: James R. Langabeer, PhD, MBA
Full text available through open access at http://escholarship.org/uc/uciem_westjem
Address for Correspondence: Michael J. Ward, MD, MBA, Department of Emergency Medicine, Vanderbilt University, 1313 21st Ave, Nashville, TN 37232. Email: mward04@gmail.com. 12 / 2015; 16:1067 – 1072
Submission history: Revision received June 22, 2015; Accepted August 14, 2015
Conflicts of Interest: By the WestJEM article submission agreement, all authors are required to disclose all affiliations, funding sources and financial or management relationships that could be perceived as potential sources of bias. The authors disclosed none.
REFERENCES
1. Cannon CP, Gibson CM, Lambrew CT, et al. Relationship of symptom-onset-to-balloon time and door-to-balloon time with mortality in patients undergoing angioplasty for acute myocardial infarction. JAMA. 2000;283(22):2941-7.
2. Langabeer JR, Henry TD, Kereiakes DJ, et al. Growth in percutaneous coronary intervention capacity relative to population and disease prevalence. J Am Heart Assoc. 2013;2(6):e000370.
3. Wang TY, Nallamothu BK, Krumholz HM, et al. Association of door-in to door-out time with reperfusion delays and outcomes among patients transferred for primary percutaneous coronary intervention. JAMA. 2011;305(24):2540-7.
4. Ward MJ, Kripalani S, Zhu Y, et al. Incidence of emergency department visits for ST-elevation myocardial infarction in a recent six-year period in the United States. Am J Cardiol. 2015;115(2):167-170.
5. Ward MJ, Kripalani S, Storrow AB, et al. Timeliness of interfacility transfer for ED patients with ST-elevation myocardial infarction. Am J Emerg Med. 2015;33(3):423-429.
6. O’Gara PT, Kushner FG, Ascheim DD, et al. 2013 ACCF/AHA guideline for the management of ST-elevation myocardial infarction: a report of the American College of Cardiology Foundation/American Heart Association Task Force on Practice Guidelines. Circulation. 2013;127(4):e362-425.
7. Miedema MD, Newell MC, Duval S, et al. Causes of delay and associated mortality in patients transferred with ST-segment-elevation myocardial infarction. Circulation. 2011;124(15):1636-1644.
8. Bernstein SL, Aronsky D, Duseja R, et al. The effect of emergency department crowding on clinically oriented outcomes. Acad Emerg Med. 2009;16(1):1-10.
9. Acute myocardial infarction (AMI): median time to transfer to another facility for acute coronary intervention. 2014. Available at: http://www.qualitymeasures.ahrq.gov/content.aspx?id=47042. Accessed Jun 2015.
10. Hospital-based emergency care: at the breaking point. 2007.
11. Handel DA, Fu R, Vu E, et al. Association of emergency department and hospital characteristics with elopements and length of stay. J Emerg Med. 2014;46(6):839-846.
12. Glickman SW, Shofer FS, Wu MC, et al. Development and validation of a prioritization rule for obtaining an immediate 12-lead electrocardiogram in the emergency department to identify ST-elevation myocardial infarction. Am Heart J. 2012;163(3):372-382.
13. Herrin J, Miller LE, Turkmani DF, et al. National performance on door-in to door-out time among patients transferred for primary percutaneous coronary intervention. Arch Intern Med. 2011;171(21):1879-1886.