
| Author | Affiliation |
| Bert A. Silich, MD, MS | Henry Ford Health System, Department of Emergency Medicine, Warren, Michigan |
| James J. Yang, PhD | Henry Ford Health System, Department of Biostatistics and Research Epidemiology, Detroit, Michigan |
ABSTRACT
Measuring workplace performance is important to emergency department management. If an unreliable model is used, the results will be inaccurate. Use of inaccurate results to make decisions, such as how to distribute the incentive pay, will lead to rewarding the wrong people and will potentially demoralize top performers. This article demonstrates a statistical model to reliably measure the work accomplished, which can then be used as a performance measurement.
WORK ACCOMPLISHED VS PERFORMANCE
It is important to emphasize that the measurement presented is individual work accomplished and not work performance, which are related but different measures. For example, working a slow night shift is not an indicator of performing poorly and this factor needs to be recognized. Work accomplished is a more objective measurement, while performance is customarily a combination of objective and subjective measures. Having a reliable objective measurement should therefore help us judge performance better.
VARIABLES AFFECTING WORK ACCOMPLISHED
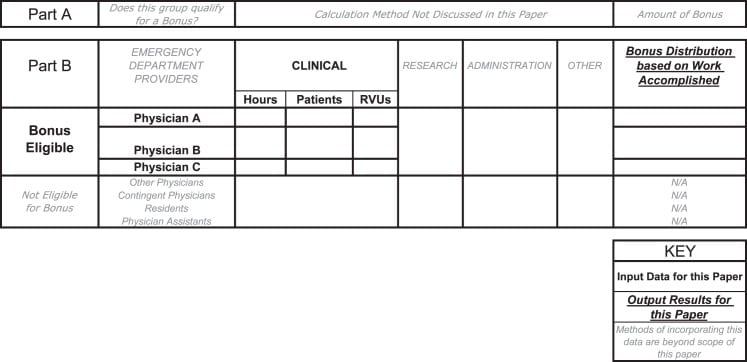
Accurately measuring work accomplished is important to emergency physicians, because often their salary, or in the example for this article, their incentive pay, is in some manner based on a measure of their performance. Figure 1 represents some of the major variables involved in the individual performance of an emergency department (ED). We must start by making sure the data are accurate. Then, we determine if the group deserves any incentive pay and what the total should be. Finally, it is necessary to determine how to distribute this incentive to the eligible individuals. We have to account for each physician’s clinical hours, patients, RVUs (a relative value unit that is a measure of work or effort applied to a patient and is related to the revenue potential), research, administrative tasks, or other unnamed tasks. We may have incentive-eligible physicians working with noneligible physicians, residents, and physician assistants. Although the different techniques used to sort out all of these issues and variables can be demonstrated, they are outside the narrower scope of this article. The core of the approach for solving these problems requires first an understanding of how to measure the performance of a group of incentive-eligible physicians, based on their clinical hours worked, patients seen, and RVUs generated. This article will demonstrate a technique that is statistically sound and that reliably measures an individual’s performance on the basis of these 3 productivity factors. Once this concept is understood, how to incorporate the remaining variables in Figure 1 can be discussed. We will start by introducing an artificial department scenario involving 3 physicians to demonstrate the major advantages of the suggested technique.
EMERGENCY DEPARTMENT SCENARIO
Let us consider a department that employs physicians A, B, and C and compare the work each physician accomplishes during a period spanning twelve 10-hour shifts. The Table, part A1, shows the raw data available for these physicians. If we had knowledge that these physicians were equal workers, then they could all be considered average and we would simply compensate them with an incentive based on the percentage of hours they will have worked, as seen in the Table, part A3, first column. They would receive 16.7%, 33.3%, and 50% of the total incentive pay, respectively. We know that, for various reasons, the work each physician will actually have accomplished is different, maybe because of a performance difference or just because one shift happened to be busier with higher-acuity patients. Therefore, just looking at the hours worked does not give a reliable measure of work accomplished.
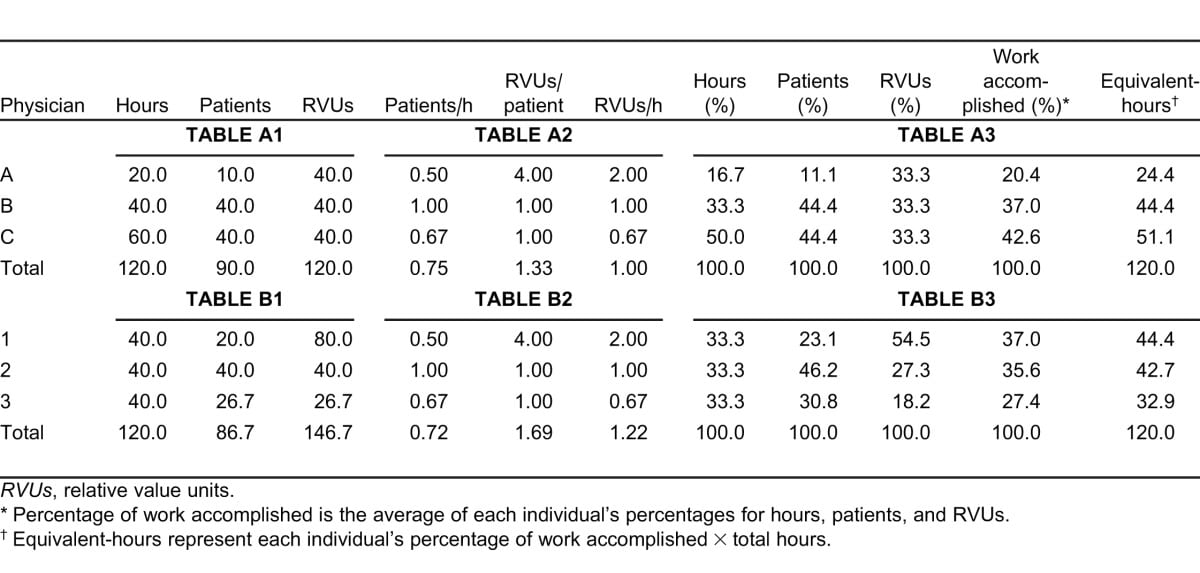
We could take a “bottom-line” approach and evaluate these physicians by the amount of revenue potential or RVUs they generate. According to the Table, part A3, third column, all 3 physicians would each receive 33.3% of the incentive. We now get very different answers from the ones obtained with the previous approach based on the hours worked. Which is right? Well, physician A argues he created a lot of revenue by seeing 10 of the sickest patients in the ED and his RVUs/patient and RVUs/hour, shown in the Table, part A2, were the highest in the department. Therefore he deserves a higher share of the incentive than do the other physicians. Physician B reminds us that while his RVUs/patient and RVUs/hour were lower, he created just as much revenue as physician A and saw more patients. Some of the patients were considered low acuity but some were high acuity. Also, because he worked more hours than physician A, his share of the incentive should be greater than that of physician A. Physician C had the lowest combination of RVUs/patient and RVUs/hour but he reminds us that while physician A was “stuck” in the intensive care bay with high-acuity patients, he was out in the department seeing more patients, keeping them satisfied, and maintaining the flow throughout the department. Furthermore, physician C had most of the typically quieter night shifts during that period and worked more hours, and he kept the ED functioning for as long as did the other 2 physicians combined. All 3 physicians bring up valid points and each feels deserving of more than an equal share of the incentive. What is a logical answer to these various opinions, each of which has valid points?
THE PROPOSED SOLUTION
The answer lies in all of the physician’s arguments. The hours present at work, patients seen, and RVUs created are all important. Therefore, we must incorporate these various factors into 1 statistically sound quantity that is the measure of the total work accomplished. While it is not absolutely required, in our example it will be assumed that all 3 of these factors are equally important. It is important to work clinically and keep the department open 24 hours a day, 7 days a week. It is equally important to see any patient presenting to the ED. We must care for the high-acuity patients but we should not be penalized for being in the intensive care bay, spending time stabilizing one patient while being unable to get out in the department to care for other patients. These physicians need to get credit for the extra RVUs they generate. On the other hand, the physician who is out in the ED should not be penalized for not getting the RVUs associated with the high-acuity patient while he is busy caring for more patients with lower acuity.
The approach that takes into account all 3 productivity factors is outlined in the Table, part A3. We start by normalizing each column’s raw data in the Table, part A1, and we calculate the percentage of the total hours worked, patients seen, and RVUs created for each physician. Next, we calculate each physician’s average for these 3 percentages. This average is the percentage of the group’s total work accomplished by each physician and this is the percentage of the total incentive each physician deserves for his work. To give a clinical meaning to this quantity, we multiply each physician’s percentage of work accomplished by the total hours for the group. This gives the equivalent-hours, which is the number of hours the physician would have worked if he had been an average physician in the group. The average physician is the performance of the entire group combined as 1 entity. In other words, every physician’s work is compared to the work of the entire department that worked 120 hours and saw 90 patients, creating 120 RVUs. You can see that physician A is credited with working 24.4 equivalent-hours in his 20 clinical hours present. In other words, compared to the department average, physician A did 24.4 hours of work in only 20 hours. This physician’s incentive share of 20.4% is appropriately above the average because he got 4.4 hours extra credit for his 2 shifts. Physician B is credited with working 44.4 equivalent-hours for his 40 clinical hours. His incentive share of 37.0% is appropriately above average, with 4.4 hours extra credit for his work. Finally, physician C was credited with working only 51.1 equivalent-hours for his 60 clinical hours. His incentive share of 42.6% was appropriately below average, with 8.8 hours subtracted from his work. By using an equivalent-hours concept, a physician knows exactly how much work above or below the department average he completed (in hours). A difference in hours from the average is a quantity that should be easily understood. Also, we have not artificially created hours; notice that in the Table, the 120 total hours in part A1 are unchanged in part A3. Equivalent-hours are a redistribution of an individual’s clinical hours, based on his hours, patients, and RVU data, as compared to the total work accomplished by the group. Therefore, for whatever number of hours a physician worked, if he saw more patients, or generated more RVUs, he will get additional credit for this work accomplished.
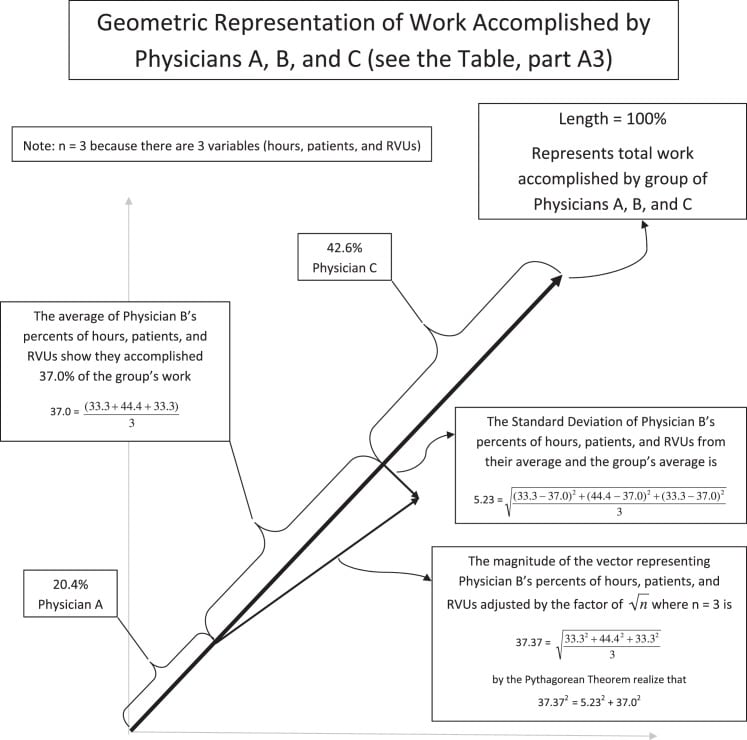
Notice that we have now combined the 3 completely different entities of hours, patients, and RVUs into 1 quantity. The statistics of this approach will not be discussed in depth in this article. A graphical representation shown in Figure 2 and Appendix 1 (online only) does show this statistical detail. Each individual’s information is contained in a right triangle (see physician B), where the magnitude of the hypotenuse is proportional to the magnitude of the vector containing an individual’s percentages of hours, patients, and RVUs. The magnitude of 1 leg of the triangle is the standard deviation. The magnitude of the other leg is the individual’s percentage of the group’s total work that he accomplished, which is determined by averaging the individual’s percentages of hours, patients, and RVUs. It is the value of this second leg of the triangle that is used to determine an individual’s contribution to the group and his share of the incentive. By simply averaging 3 numbers, we have silently incorporated the standard deviation to transform an individual’s percentages of hours, patients, and RVUs into the magnitude of an individual’s work accomplished in the group of physicians. A notable advantage to this approach is that the control group for measuring each individual physician’s work accomplished is the sum of physicians in the group. They are not compared to the performance of another group of EDs from different regions, which is supposed to be exactly like their department. There is no need to spend time and money to collect outside data.
RATIOS NOT RECOMMENDED
An additional point is that, while the ratios including patients/hour, RVUs/patient, and RVUs/hour were mentioned, they were not used in the calculations. Use of these ratios should be avoided because they are ambiguous terms. The simplest example is illustrated when physician groups 1, 2, and 3 (Table, part B2) are seen to have the same ratios as physician groups A, B, and C (Table, part A2). In the Table, the raw data in parts A1 and B1, which produce the data in parts A2 and B2, respectively, are not alike except that the total hours happen to be identical. There are in fact an infinite number of different tables such as B1 that could each produce B2. These ratios simply are not representative of any one set of raw data; therefore, any results derived from these terms do not uniquely apply to the initial raw data used. Part B3 is included to show that there is a difference in percentage work accomplished in part A3, even though both groups have identical ratios in parts A2 and B2. A difference was detected only because the data from parts A1 and B1 were used rather than the data from parts A2 and B2.
SUMMARY
Details about other potential variables and types of work (academic, teaching, research) have been omitted from this discussion. Comparing the ED in this scenario to other EDs, and determining if a department qualifies for any incentive pay, requires a different approach.
Physicians should be more satisfied in their workplace if they know evaluation of their performance is fair and objective. One step toward this goal is to appropriately measure work. This article focused on 3 important components of work: clinical hours, patients seen, and RVUs generated. Problems associated with using fewer items than these 3 were discussed in an artificial ED scenario. Combining these terms into commonly used ratios is problematic because of ambiguity and cannot be recommended. The proposed solution converts the raw data into percentages and then averages them to give a single percentage, which is an individual’s contribution toward the group’s total work. Appendix 2 (online only) presents a program that calculates the answer by using this technique for up to 6 physicians. Individuals are compared to their entire department, with the aggregate work performance serving as an internal control. This obviates the time and expense to produce comparison data from other EDs. In this approach, a physician will be rewarded by an increase in his equivalent-hours if he sees an above-average number of patients or generates an above-average number of RVUs for each clinical hour of work.
Footnotes
Supervising Section Editor: Scott E. Rudkin MD, MBA
Submission history: Submitted October 28, 2010; Revision received December 28, 2010; Accepted May 5, 2011
Reprints available through open access at http://escholarship.org/uc/uciem_westjem
DOI: 10.5811/westjem.2011.5.6664
Address for Correspondence: Bert A. Silich, MD, MS
Henry Ford Health System, Department of Emergency Medicine, 13355 E 10 Mile Rd, Warren, MI 48089
E-mail: BSilich1@hfhs.org
Conflicts of Interest: By the WestJEM article submission agreement, all authors are required to disclose all affiliations, funding, sources, and financial or management relationships that could be perceived as potential sources of bias. The authors disclosed none.