
| Author | Affiliation |
|---|---|
| Alp Arkun, MD | New York Methodist Hospital, Department of Emergency Medicine, Brooklyn, NY |
| William M. Briggs, PhD | New York Methodist Hospital, Department of Emergency Medicine, Brooklyn, NY |
| Sweha Patel, MD | New York Methodist Hospital, Department of Emergency Medicine, Brooklyn, NY |
| Paris A. Datillo, RN | New York Methodist Hospital, Department of Emergency Medicine, Brooklyn, NY |
| Joseph Bove, MD | New York Methodist Hospital, Department of Emergency Medicine, Brooklyn, NY |
| Robert H. Birkhahn, MD, MS | New York Methodist Hospital, Department of Emergency Medicine, Brooklyn, NY |
ABSTRACT
Introduction:
The objective of this study was to evaluate those factors, both intrinsic and extrinsic to the emergency department (ED) that influence two specific components of throughput: “door-to-doctor” time and dwell time.
Methods:
We used a prospective observational study design to determine the variables that played a significant role in determining ED flow. All adult patients seen or waiting to be seen in the ED were observed at 8pm (Monday-Friday) during a three-month period. Variables measured included daily ED volume, patient acuity, staffing, ED occupancy, daily admissions, ED boarder volume, hospital volume, and intensive care unit volume. Both log-rank tests and time-to-wait (survival) proportional-hazard regression models were fitted to determine which variables were most significant in predicting “door-to-doctor” and dwell times, with full account of the censoring for some patients.
Results:
We captured 1,543 patients during our study period, representing 27% of total daily volume. The ED operated at an average of 85% capacity (61–102%) with an average of 27% boarding. Median “door-to-doctor” time was 1.8 hours, with the biggest influence being triage category, day of the week, and ED occupancy. Median dwell time was 5.5 hours with similar variable influences.
Conclusion:
The largest contributors to decreased patient flow through the ED at our institution were triage category, ED occupancy, and day of the week. Although the statistically significant factors influencing patient throughput at our institution involve problems with inflow, an increase in ED occupancy could be due to substantial outflow obstruction and may indicate the necessity for increased capacity both within the ED and hospital.
INTRODUCTION
A survey of 250 Emergency Departments (ED) published in the Annals of Emergency Medicine in 2003 found that 11% of them regularly were on diversion, 73% had two or more boarded patients, 59% used hallways for patients, 38% doubled up patients in rooms, and 47% used non-clinical space for patient care.1 This situation is not foreign to most EDs in the country and has been termed as “crowding.” As alarming as these statistics sound, those within the realm of emergency care know that it is not new and, most importantly, the problem is getting worse.2
Given our saturated healthcare system, medical personnel dread the proverbial “straw” that will break the camel’s back. In the setting of emergency health care, that “straw” could be a mass casualty incident, such as a natural disaster or terrorist attack. Several sources have voiced concerns about disaster preparedness in our crowded EDs, although a single massive incident is not all that is required to stress a saturated system.3 During times of crowding, something as minor as a heavy flu season or local hospital closure can push an already struggling ED over the brink. Social factors, such as the current economic climate, can also increase volume as patients turn to EDs for primary care after losing jobs with health benefits. A common response to crowding is to create more room within the department to accommodate the influx of patients. However, it has been suggested that increasing capacity in an already inefficient system only serves to potentiate the problem, not solve it.4,5
Therefore, it’s imperative to first examine which factors within the institution contribute to crowding and then maximize efficiency within this system before addressing physical space limitations. Crowding is a complex issue and no single factor can explain why it occurs.6 The goal of our study was to evaluate those factors, both intrinsic and extrinsic, which influence patient flow through the ED. The components of patient flow studied were “door-to-doctor” time and dwell time (time from disposition to physical transport to in-patient bed).
METHODS
Study Design
We conducted a prospective cross-sectional cohort study of all adult patients seen or waiting to be seen at 8pm, Monday through Friday, over a 1.5 month period (September 25–November 21, 2006). We chose this methodology to provide a “snapshot” or static view of the department that could be used to reflect the status at the busiest time of the day. The developed protocol met the criteria for exemption from institutional review board review at our facility.
Setting
This study took place in an urban Level II Trauma Center ED with a volume of 50,000 adult visits per year. The department, which has 55 adult treatment bays, is located in a 570-bed acute care facility.
Selection of Participants
We included all adult patients older than 18 who were being seen or waiting to be seen at 8pm in the main ED from Monday through Friday. Weekends were excluded due to limited research department staffing. Pediatric patients, as well as category C patients seen in our “fast track” service, were not accounted for in this study. Both are separate operating entities outside of our main ED and were not followed due to different patient-flow dynamics.
Methods and Measurements
Trained research assistants documented the various study times using different modalities. The “door” time, for example, was taken from a triage form that is automatically time-stamped when the patient is triaged by a nurse, either in the ED waiting room or ambulance triage area. The “doctor” time was taken from the emergency physician’s (EP) notes, which have to be manually entered when the EP first makes contact with a patient. The “door-to-doctor” time was the difference between these two variables. After patient disposition is decided, whether admitted or discharged, the time is entered into a computer tracking system in the ED by either the resident or attending EP. “Dwell” time was determined to be the time a patient physically left the ED, subtracted by the disposition time, and was only applied to those patients who were admitted to the hospital from the ED. Also noted each day was the breakdown of the acuity of patients waiting to be seen as decided by a three-tier triage system, the number of ED patients already admitted, the total number of ED patients, number of nurses, physicians and technicians in the ED, as well as the number of admitted patients in the hospital, number of open beds in the hospital, and number of critical care beds available. The latter two components included total available beds within the institution and were independent of staffing demands at those times.
Primary Data Analysis
All entries were recorded on a standardized data entry form. The response variables of interest were “door-to-doctor” time and dwell time. ED variables measured included acuity, daily volume/admissions, number of boarders (admitted patients waiting for in-hospital beds in the ED), occupancy (number of occupied beds divided by the total number of ED beds), and number of staff. We defined acuity as triage assessment of level A, B, or C in a three-tier triage system with triage category A patients listed as emergent, category B as urgent but able to wait, and category C as non-urgent. Hospital variables measured were hospital volume, daily admissions, and intensive care unit (ICU) volume.
At 8 pm, some patients had not yet been seen by an EP or had been seen but had not yet been discharged from the ED. Partial “door-to-doctor” and dwell times for each of these patients were still measured, but their total times were considered censored in accordance with standard survival analysis methodology.7 Both log-rank tests and time-to-wait (survival) proportional-hazard regression models were fitted to determine which variables were most significant in predicting “door-to-doctor” and dwell times, with full account of the censoring for some patients.
RESULTS
We reviewed 1,543 patient visits over a period of 42 days. Our study captured 27% of patients who came through the ED with 68% in triage category A, 29% in B, and 3% in C. The disproportionately small percentage of category C patients captured was due in part to the operation of our “fast track” service until 10pm. Thus, our study only captured those category C patients requiring further workup than could be provided in “fast track.” The distribution of data for the studied variables with appropriate ranges is shown in Table 1.
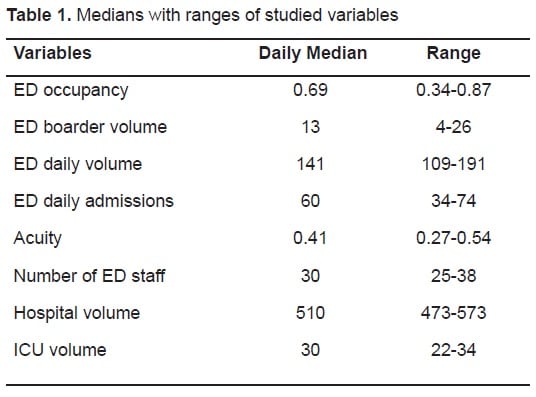
The ED operated at an average of 85% capacity (61–102%) with 27% of patients admitted and only awaiting bed assignment. During the same time period, the hospital had a median of 510 occupied beds (range 473 – 573). ED visits averaged 138 per day (133–143) with a median “door-to-doctor” time of 1.8 hours and median dwell time of 5.5 hours.
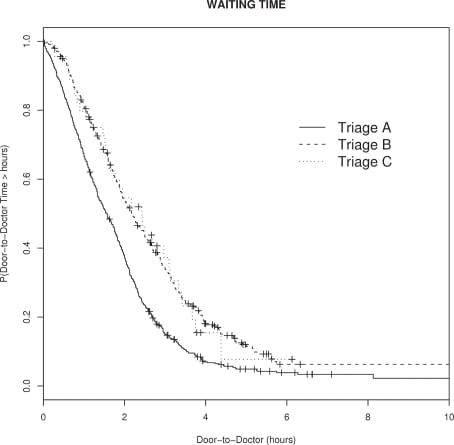
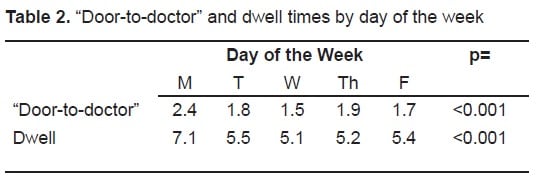
A log-rank test indicated significant differences in “door-to-doctor” times for the three triage categories. The model-adjusted median “door-to-doctor” times for categories A, B, and C were 1.6, 2.2, and 2.4 hours respectively; these were significantly different (p-value<0.001). Median dwell times were also different for categories A, B, and C with times of 5.0, 9.8, and 4.4 hours respectively; these were also significantly different (p-value<0.001). Days of the week also had significantly different times (Table 2), with Mondays having longer “door-to-doctor” and dwell times. Figure 1shows the estimated probability of waiting at least as long as a fixed number of hours for times between 0 and 10 hours. The “+” symbols indicate censored data points. Thus, full accounting of censored data was used to estimate the curves using survival analysis methodology. Category A patients had consistently shorter “door-to-doctor” times, while category B and C patients had a higher probability of longer times. Figure 2 is the same plot but for dwell times. Here, the differences between the triage categories are more apparent and indicate significantly longer dwell times for category B patients.

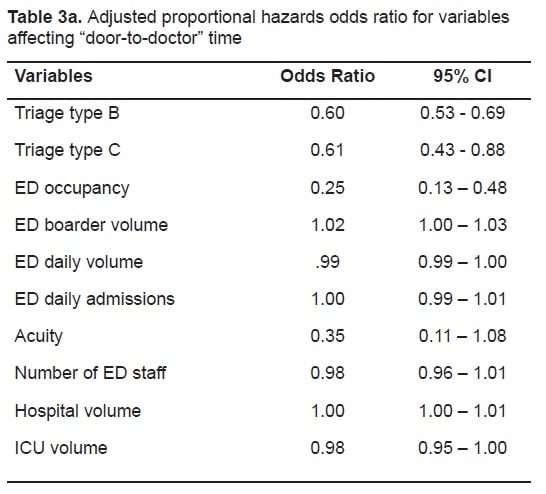
The next step was to control for the important clinical and hospital census variables. Proportional hazard regression models for “door-to-doctor” and dwell times were computed controlling for triage category, ED occupancy, daily ED volume/admissions, ED boarder volume, acuity, number of ED staff, daily hospital volume, and ICU volume. These models predict the probability of being seen or boarded at any given time; therefore, odds ratios less than one indicate a lower probability, and therefore longer times. For the “door-to-doctor” model (Table 3a), triage category and ED occupancy were significantly associated with “door-to-doctor” time. Category B and C patients had odds of 0.6 times less than Category A patients to be seen by a doctor at any given time. Higher ED occupancy was also associated with lower probabilities of being seen at any time, hence longer “door-to-doctor” times.
In the dwell-time model, (Table 3b) only triage category B had significantly longer times than did category A; category C patients were not significantly different than A. This latter finding may be true, or it may be a consequence of fewer category C patients being sampled. Higher ED occupancy was again a significant predictor of longer dwell times.

ED Boarder Volume, although statistically significant, was clinically unimportant for both “door-to-doctor” times and dwell times. (Tables 3a and and3b3b)
The advantage of the proportional hazards regression is that it allows us to take full account of censored data and all variables simultaneously. As such, our main results must be expressed in terms of odds ratios and not absolute time. Odds indicate the chance of being seen by an EP (time to “doctor”) or being discharged (waiting time) at any given moment; the odds themselves are found my multiplying the value of the stated variables by the odds coefficients (class variables, such as Triage category, take a value of one). An odds ratio for a variable indicates the chance of being seen or discharged changes in a multiplicative way by the amount of the ratio. Odds ratios greater than one thus imply a higher chance of being seen or discharged; while odds ratios less than one imply a proportionately lower chance.
DISCUSSION
In 2002 more than 110 million ED visits occurred in the Unites States, a 23% increase since 1992.8An April 2002 report for the American Hospital Association (AHA) found that officials at many hospitals in urban areas described their EDs as operating at or above capacity, with some directors reporting that patient care was compromised and patients experienced poor outcomes as a result.6ED crowding is no longer insider information known only to those on the front lines. On the contrary, it is now on the minds of the public. A survey published by the American College of Emergency Physicians (ACEP) in 2005 showed that 69% of Americans believed there was an impending crisis within our EDs.9
This sharp rise in ED use has been blamed on a multitude of factors, many of which are extrinsic. Recent trends indicate that much of the increased volume seen in EDs can be attributed to visits for non-emergent cases and may be interpreted as “problems or dissatisfaction with the performance and accessibility of local primary care delivery systems.”10,11 Although ED use by the uninsured is a major contributor to the recent surge in volume seen at many hospitals, the majority of growth in recent years has been attributed to the privately insured seeking a “one-stop” healthcare source.10In addition to these factors, there are staffing shortages, lack of materials to measure and manage patient flow, and fewer available beds due to local hospital closures.12,13
Our study determined that “door-to-doctor” time differences based on triage category was statistically significant with category A patients being seen sooner than category B and C patients. This is an expected finding since emergent patients warrant immediate attention. Category C patients waited slightly longer to see a physician when compared to category A and B patients. Bordoloi et al.14 conducted a study looking at the impact of non-urgent patients, the equivalent to our category C patients, on ED flow and concluded that these patients are “receiving the brunt of the punishment” as far as “door-to-doctor” time. Although their findings were consistent with ours, the observed outcome was not as dramatic as expected. This may be due in large part to the fact that Bordoloi looked exclusively at patients who presented with symptoms consistent with Acute Coronary Syndrome, whereas we included all adult ED patients.
More interesting was the observed statistically significant differences in dwell time based on triage category. Category A patients had boarding times slightly longer than category C patients. Previous studies have correlated elevated dwell times with high acuity patients to the limited available space for intensive care in the hospital as well as the complexity of the presenting cases.5,15,16 The difference, however, is not as pronounced as expected in our study possibly due to the siphoning of A and C patients into type B patients. In other words, some patients triaged into category B are actually A or C patients but are placed in the B category due to an erroneous initial first impression. This finding brings to light a flaw in this classification scheme. Since many EDs are finding the “B” patients too general a category, they are effectively breaking it apart and instituting a five-tier numbered system for triaging patients.17 For this reason, ACEP codified this new triage system into policy in 2003. Another interesting point is that category B patients may encompass those who are awaiting elective surgery. Although this variable was not accounted for in our study, it is a topic worth mentioning and was recently discussed in a study by Rathlev et al.,18 who found a direct correlation between the number of elective surgical admissions from the ED and increased dwell times at their institution.
The day of the week was found to correlate with fluctuations in “door-to-doctor” as well as dwell times. We saw a distinct increase in both measured time intervals for patients seen in the ED on Mondays. Our findings differ from those of Chan et al.19 who concluded that the day of the week has no significant influence over throughput in the ED. One possible point of difference is their use of throughput, which they define as the time a patient enters the ED to the time of discharge, whereas we looked at specific periods during a patient’s overall visit. Another point of difference could be differences in the patient population. The spike in patient visits on Mondays could be attributed to patients who wait over the weekend to see their primary care physician for an urgent condition and are thus referred to the ED.
To take into account the continuous nature of the variables, we used a time-to-wait or proportional-hazard regression model.7 Although measured variables included those considered inflow as well as outflow factors, we observed statistically significant effects on both “door-to-doctor” and dwell times for those variables representing primarily inflow factors, including triage category. With the recent advent of “fast track” in EDs nationwide, it is important to comment on the impact of low acuity patients on ED flow. This topic was addressed by Schull et. al.,20 who concluded that these patients are associated with a negligible increase in “door-to-doctor” time for other ED patients. Thus, it can be inferred that although “low-complexity” patients may affect the overall statistical “door-to-doctor” times in an ED, lowering their number may not have an effect on overall flow. ED occupancy was another variable that played a large role in patient flow. It is intuitive that a decreased capacity to receive patients in the ED would invariably increase “door-to-doctor” times.
It was interesting to see that ED occupancy was also correlated with increased dwell times. This could be due to a lack of physical space within the hospital, resulting in more patients boarding in the ED and occupying more beds. One of the limiting factors to ED patient output of admitted patients is the “bottleneck” effect addressed in several publications.5,15,16 On the top of a long list of “bottleneck” culprits, including backups in radiology, patient transport, and laboratory, is hospital capacity. According to the AHA, the number of inpatient beds in the U.S. decreased 39% between 1981–1999. Reduced inpatient capacity is reported to be a major cause of overcrowding in ED treatment areas. A study by Forster et al.16 found that the duration admitted patients wait in the ED is influenced by the hospital’s occupancy. With a 10% absolute increase in occupancy, patients waited on average 5% longer to get to their inpatient beds. Our study could not confirm these findings, as our results did not produce a statistically significant correlation between hospital occupancy and wait time in the ED.
The importance and necessity of real-time ED flow models have become more apparent over the years. These models would both relay minute-to-minute data on current patient flow conditions, enabling quick interdepartmental response and possible avoidance of a bottleneck, and could potentially use that data to predict future flow patterns. Hoot et al.21 recently published a study dealing with the use of multiple flow models to create an advance warning system. They concluded that none of the measures provided substantial warning before crowding with low rates of false alarms. We agree with other study findings that a hospital’s efficiency should be maximized prior to considering an increase in physical space. We also believe that a better understanding of factors influencing crowding could potentially improve upon existing prediction models in the future.
LIMITATIONS
Our study had several limitations, first of which was that it took place in a single clinical center. This limits the ability of our results to relate to other clinical centers as they may have dissimilar staffing and patient demographics. Our study took place in an urban teaching hospital and may show different trends than in a rural setting.
We looked at ED admissions at only 8pm because it was the busiest time of day. Alternative methods of collecting data, e.g. a method that samples patients at several times a day, was too time consuming and impractical at our clinical center, which uses an integrated paper and computer system to track patients’ progress.
Another limitation was the length of time in which our study was done. Because it was prospectively done over a period of 1.5 months, this did not allow for variations in ED admissions associated with the seasons and could account for the variability observed in some of our results.
Finally, we did not account for differences in those patients arriving by ambulance and those who were ambulatory. It is possible that those patients arriving by ambulance are seen faster regardless of their triage level and warrants further study.
CONCLUSION
In our study the ED and hospital operated near capacity on a daily basis, and the major determinants of “door-to-doctor” and dwell times were triage category and ED occupancy. The day of the week also proved to be significant with an observed spike in both “door-to-doctor” and dwell times on Mondays. We did not find that hospital or ICU occupancy affected the measured ED time intervals at our institution. As we cannot alter the triage category or day of week our patients present to the ED, future efforts to reduce “door-to-doctor” and dwell times must center on improving ED occupancy through improved efficiency or increased physical space. Further study is warranted, encompassing an entire year’s worth of data, while accounting for the limitations addressed within the scope of this study.
Footnotes
Supervising Section Editor: Michael Menchine, MD, MPH
Submission history: Submitted November 1, 2009; Revision Received May 11, 2009; Accepted June 1, 2009
Full text available through open access at http://escholarship.org/uc/uciem_westjem
Address for Correspondence: Robert H. Birkhahn, MD, Department of Emergency Medicine, New York Methodist Hospital, Brooklyn, NY 11791
Email: rhbirkhahn@pol.net
Conflicts of Interest: By the WestJEM article submission agreement, all authors are required to disclose all affiliations, funding sources, and financial or management relationships that could be perceived as potential sources of bias. The authors disclosed none.
REFERENCES
1. Schneider SM, Gallery ME, Schafermeyer R, et al. Emergency department crowding: a point in time. Ann Emerg Med. 2003;42(2):167–72. [PubMed]
2. Derlet RW, Richards JR. Overcrowding in the nation’s emergency departments: complex causes and disturbing effects. Ann Emerg Med. 2000;35(1):63–8. [PubMed]
3. Trzeciak S, Rivers EP. Emergency department overcrowding in the United States: an emerging threat to patient safety and public health. Emerg Med J. 2003;20(5):402–5. [PMC free article][PubMed]
4. Greene J. Emergency department flow and the boarded patient: how to get admitted patients upstairs. Ann Emerg Med. 2007;49(1):68–70. [PubMed]
5. Bazzoli GJ, Brewster LR, Liu G, et al. Does U.S. hospital capacity need to be expanded? Health Aff (Millwood) 2003;22(6):40–54. [PubMed]
6. The Lewin Group Falls Church, VA: American Hospital Association; 2002. Emergency department overload: a growing crisis — the results of the American Hospital Association Survey of Emergency Department and Hospital Capacity.
7. Kleinbaum DG, Klein M. Survival Analysis: A Self-Learning Text. 2 ed. New York, NY: Springer-Verlag; 2005.
8. McCaig LF, Burt CW. National Hospital Ambulatory Medical Care Survey: 2002 emergency department summary. Adv Data. 2004;18(340):1–34. [PubMed]
9. American College of Emergency Physicians Crowding, Boarding Problems Fleshed Out at ACEP Summit. EM Today. August 22, 2005. Available at: http://www.acep.org/publications.aspx?LinkIdentifier=id&id=27362&fid=1786&Mo=No. Accessed January 27, 2010.
10. Cunningham P, May J. Insured Americans drive surge in emergency department visits. Issue Brief Cent Stud Health Syst Change. 2003;(70):1–6. [PubMed]
11. Billings J, Parikh N, Mijanovich T. Emergency department use in New York City: a substitute for primary care? Issue Brief (Common Fund) 2000;(433):1–5.
12. Pate DC, Puffe M. Special report: quality of care survey. Improving patient flow. Physician Exec.2007;33(3):32–6. [PubMed]
13. Sun BC, Mohanty SA, Weiss R, et al. Effects of hospital closures and hospital characteristics on emergency department ambulance diversion, Los Angeles County, 1998 to 2004. Ann Emerg Med.2006;47(4):309–16. Epub 2006 Feb 3. [PubMed]
14. Bordoloi SK, Beach K. Improving operational efficiency in an inner-city emergency department.Health Serv Manage Res. 2007;20(2):105–12. [PubMed]
15. Derlet RW. Overcrowding in emergency departments: increased demand and decreased capacity.Ann Emerg Med. 2002;39(4):430–2. [PubMed]
16. Forster AJ, Stiell I, Wells G, et al. The effect of hospital occupancy on emergency department length of stay and patient disposition. Acad Emerg Med. 2003;10(2):127–33. [PubMed]
17. Fernandes CM, Tanabe P, Bonalumi N, et al. Emergency department triage: why we need a research agenda. Ann Emerg Med. 2005;46(2):204–5. [PubMed]
18. Rathlev NK, Chessare J, Olshaker J, et al. Time series analysis of variables associated with daily mean emergency department length of stay. Ann Emerg Med. 2007;49(3):265–71. [PubMed]
19. Chan L, Reilly KM, Salluzzo RF. Variables that affect patient throughput times in an academic emergency department. Am J Med Qual. 1997;12(4):183–6. [PubMed]
20. Schull MJ, Kiss A, Szalai JP. The effect of low-complexity patients on emergency department waiting times. Ann Emerg Med. 2007;49(3):273–4. [PubMed]
21. Hoot NR, Zhou C, Jones I, et al. Measuring and forecasting emergency department crowding in real time. Ann Emerg Med. 2007;49(6):747–55. Epub 2007 Mar 27. [PubMed]