
| Author | Affiliation |
|---|---|
| John T. Morris, PhD | Crawford Research Institute, Shepherd Center, Atlanta, Georgia |
| James L. Mueller, MA | Crawford Research Institute, Shepherd Center, Atlanta, Georgia |
| Michael L. Jones, PhD | Crawford Research Institute, Shepherd Center, Atlanta, Georgia |
ABSTRACT
Introduction:
People with disabilities are generally more vulnerable during disasters and public emergencies than the general population. Physical, sensory and cognitive impairments may result in greater difficulty in receiving and understanding emergency alert information, and greater difficulty in taking appropriate action. The use of social media in the United States has grown considerably in recent years. This has generated increasing interest on the part of national, state and local jurisdictions in leveraging these channels to communicate public health and safety information. How and to what extent people with disabilities use social and other communications media during public emergencies can help public safety organizations understand the communication needs of the citizens in their jurisdictions, and plan their social media and other communications strategies accordingly.
Methods:
This article presents data from a survey on the use of social media and other communications media during public emergencies by people with disabilities conducted from November 1, 2012 through March 30, 2013.
Results:
The data presented here show four key results. First, levels of use of social media in general are high for people with disabilities, as well as for the general population. Second, use of social media during emergencies is still low for both groups. Third, levels of use of social media are not associated with income levels, but are significantly and strongly associated with age: younger people use social media at higher rates than older people in both groups (p<0.001). Fourth, differences in the use of social media during emergencies across disability types are slight, with the exception of deaf and hard-of-hearing respondents, the former more likely to have used social media to receive (p=0.002), verify (p=0.092) and share (p=0.007) emergency information.
Conclusion:
These last two results suggest that effective emergency communications strategies need to rely on multiple media types and channels to reach the entire community.
INTRODUCTION
The use of social media has grown considerably in recent years, from 8% of internet users in 2005 to 72% in 2013, according the Pew Research Center.1 This trend has spurred national, state and local organizations to develop programs to leverage these channels to communicate public health and safety information. Whether and how the public uses social media during emergencies is critically important for designing public safety programs and protocols, and ultimately for public safety outcomes.
An estimated 56.7 million people in the United States (or about 19% of the population) have at least one disability, according to the 2010 U.S. Census Bureau.2 The differential access to specific forms of communications and the greater vulnerability of people with disabilities during public emergencies3–5makes understanding their use of communications media under emergency conditions critically important. The core question, “Is there a ‘disability divide’ in the use of social media by people with disabilities versus the general population” will be addressed through analysis of the following data:
-
a.Percentage of people with disabilities using social media
-
b.Percentage of people with disabilities using social media, by age and income
-
c.Percentage of people with disabilities using social media, by disability type
-
d.Comparison of percentage of people with disabilities using social media during emergencies with percentage of the general population
Evidence from studies conducted over the past decade indicates that people with disabilities demonstrate substantially lower rates of technology use than the general population.6–8 These studies primarily focus on internet access via traditional desktop and laptop computers, particularly in the home, and place less emphasis on the use of other communications platforms/technology, such as mobile wireless technology. The Centers for Disease Control and Prevention (CDC) estimates that 36.5% of adults and 45.0% of children in the U.S. live in households that do not have a functioning telephone that is not a cellphone (i.e., they do not have a functioning “landline” telephone).9 This growing trend of “wireless substitution” in the U.S. suggests that access to “computers” connected to the internet in the home may be becoming less critical for social and economic participation.
Survey research conducted by the Rehabilitation Engineering Research Center for Wireless Technologies (Wireless RERC) in 2012 and 2013 focusing on use of wireless technology by people with disabilities confirms lower levels of technology use by people with disabilities.10 Still, the Wireless RERC survey data showed high rates of overall usage of mobile wireless devices, with 81% of respondents reporting that they own or use a wireless device such as a cellphone or smartphone, compared to 91% for the general population, according to the Pew Research Center.11
And this gap seems to be narrowing. The difference with the general population as reported by the Pew Research Center was substantially smaller (by only 10%) than those reported in earlier studies on computer and internet access (28% reported by Dobransky and Hargittai in 2006; and 31% t reported in the Kessler/NOD study in 2010). Furthermore, tablet ownership was approximately equal for Wireless RERC survey respondents with disabilities (31%), compared to the general population (34%) sampled by the Pew Research Center.12
Income, Education, Age and Disability Type
There is general agreement about the substantial impact of demographic variables, such as income, education, and age, on technology use by the general population and the population of people with disabilities. Further, specific disabilities have been shown to impact use of consumer technologies (e.g., deaf people generally do not use voice calling).
Burger et al show that younger age groups among Jersey Shore residents were more likely to use a range of communications technologies during and after Hurricane Sandy.13 The annual American Red Cross surveys also show that younger and more educated individuals are more likely to use social media during disasters and emergencies.14–16 Similarly, the Pew Research Center has shown that younger, more educated individuals and those with higher household incomes are more likely to use social media, the internet and cellphones.11 Additionally, a 2013 U.S. Department of Commerce report based on Current Population Survey data from 2011 shows that rates of computer ownership, internet use, and broadband adoption in the home are directly related to family income and householder education, and inversely related to householder age.6
Among people with disabilities, younger and higher household income individuals have been shown to be more likely to use cellphones, smartphones, tablets,17 and mobile internet.18 But there has been little published research on how people with disabilities use social media in general, or specifically during emergencies.
METHODS
For this study, we collected data from November 1, 2012 through March 30, 2013 using convenience sampling to draw a sample of adults over age 18 with any type of disability. Minors under age 18 were not recruited due to concerns over conducting research with vulnerable populations. The protocol for this study was approved by the local institutional review committee at the grant recipient’s home institution, as well as the subcontracting researchers’ home institution. The questionnaire was made available in English and Spanish.
We recruited participants through the Wireless RERC’s Consumer Advisory Network (CAN), a nationwide network of consumers with disabilities. The research team also engaged its internet and social media assets, including Yahoo! Groups, the Wireless RERC website, and its Twitter, Facebook and LinkedIn accounts. We asked our contacts among organizations that focused on disability issues at the national, state and local levels to disseminate the invitation to participate to their networks of people with disabilities. These organizations included Federal Emergency Management Agency (FEMA), the Federal Communications Commission (FCC), American Foundation for the Blind, Hearing Loss Association of America, American Foundation for the Blind, National Emergency Numbering Association (NENA), Telecommunications for the Deaf and Hard of Hearing (TDI), Coalition of Organization for Accessible Technology, Shepherd Center, and others.
Respondents represented a range of disabilities, including hearing, vision, cognitive, mobility, dexterity, and speech limitations (Table 1). Further, respondents reporting vision or hearing impairment were asked to specify having either blindness or low vision, and being deaf or hard of hearing. Our experience conducting focus group research suggests that each of these subgroups may have distinct technology access and life experiences.

Percentage of respondents – by disability type, 2012–13.
We collected data via the web, voice phone interviews, and in-person interviews. Of the 1,772 people who responded, 1,120 indicated that they had at least 1 of the disabilities listed in Table 1. Caregivers of people with disabilities were also recruited to complete the questionnaire. A total of 370 caregivers completed the questionnaire, 198 of them indicating that they also had a disability. Responses of the 172 caregivers without disabilities are not analyzed here. The age range of respondents with disabilities was 19–98, with a mean age of 52.18 and a standard deviation of 12.95.
Where possible, analysis of response data presented in this article has been weighted by income as reported by the 2011 American Community Survey (ACS). We downloaded ACS microdata from the Integrated Public Use Microdata Series (IPU MS), which is maintained by the Minnesota Population Center at the University of Minnesota.19 Weighting by income helps mitigate possible biases toward recruitment of higher income respondents introduced by convenience sampling. This is especially important because of the focus on technology use, which has been demonstrated to be partially determined by income levels.
This weighting is used in analyzing data for all disability types listed in our questionnaire. Additionally, weighting by income is used for select disability types identified in the ACS database, which include 6 types: difficulty hearing (not disaggregated by deafness and hard of hearing); seeing (also not disaggregated by blindness and severe low vision); remembering, concentrating or making decisions; physical difficulties (walking, climbing stairs, reaching, lifting, carrying); performing basic tasks outside the home; and self-care inside the home.
RESULTS
Table 2 shows little overall difference in the general use of social media by people with disabilities in our Emergency Communications Survey and in the general population as measured by the Pew Research Center. Slightly less than three quarters of both groups of respondents use social media. Further, Table 2shows that income is not a statistically significant factor in use of social media for either group. The percentage of respondents across the 4 income ranges for both surveys is generally consistent in the low- to mid-70% range.
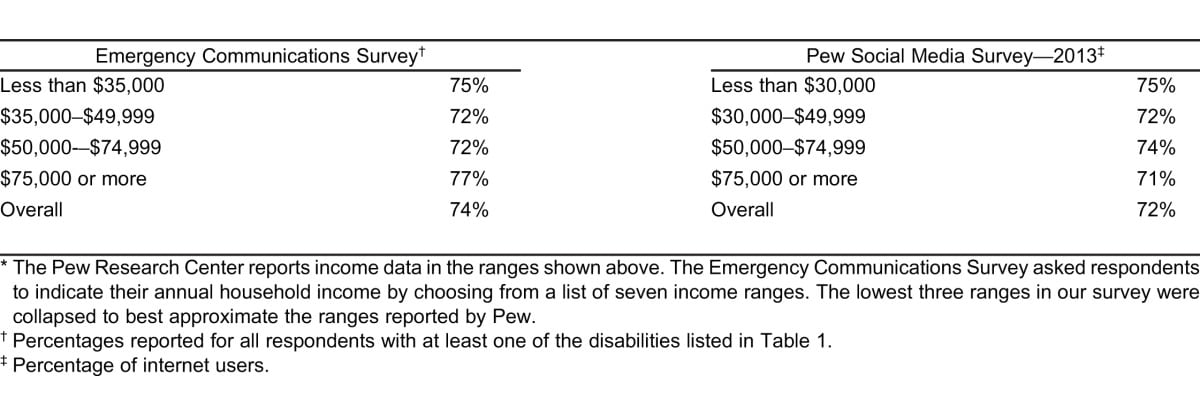
Percentage of respondents who use social media and online communities, by income.*
In contrast to the similarities across income levels, age is strongly and significantly related to use of social media in both surveys (p<0.001 for our Emergency Communications Survey; the Pew Research Center also reports a significant relationship). Table 3 shows high rates of use by people with disabilities under 30 years old and in the general population, with progressively lower rates of use across the next 3 higher age ranges. Data on age and social media use are comparable in both surveys, with our survey showing higher levels of use in the older age ranges.
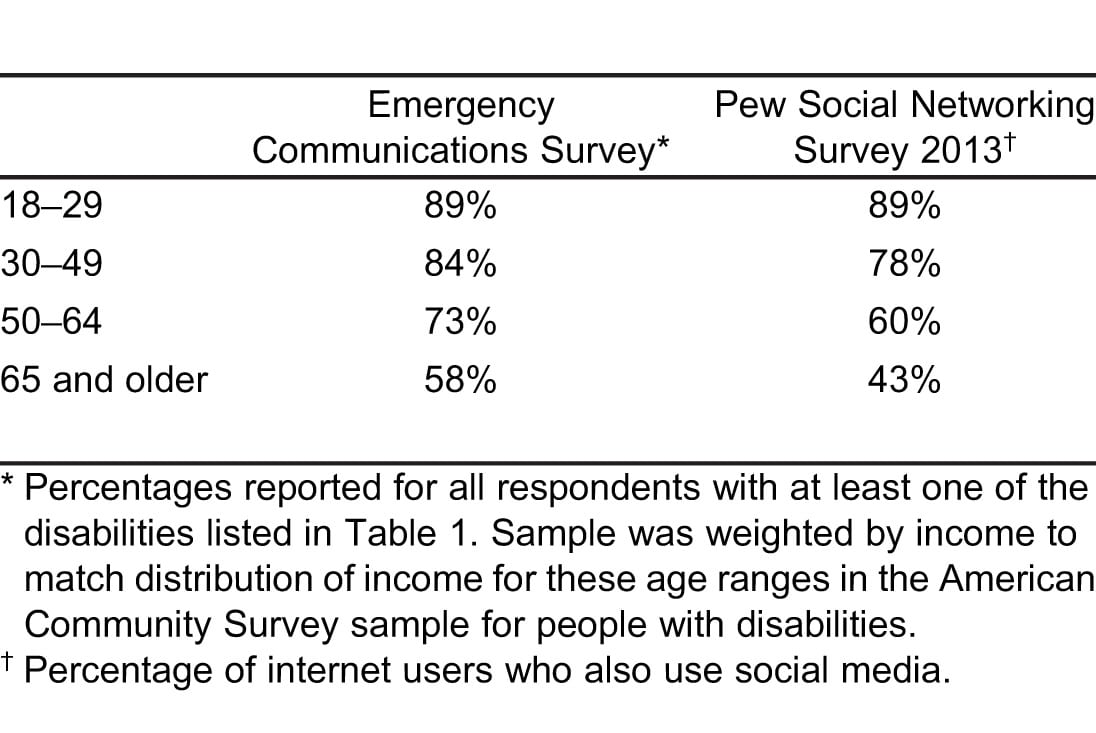
Percentage of respondents who use social media and online communities, by age.
Use of Social Media and Other Media During Emergencies
The previous 2 tables focused on the use of social media in general, not necessarily during disasters and public emergencies. Our Emergency Communications Survey separately asked respondents how they received, verified (if at all) and shared (if at all) the most recent public alert they have received. The focus on the most recent public alert helps mitigates the possibility of respondents checking all or most of the options in a long list of media simply because at one time or another over an extended period they may have received, verified and/or shared alerts in these several ways. The aim of this particular formulation is to distinguish between more commonly and recently used communications media from those less commonly or recently used.
Additionally, we distinguished between receiving, verifying and sharing alert information as 3 distinct aspects of communication during emergencies. The act of verifying alert information points to the level of trust in particular communications media, a central concern with social media because of its ability to disseminate information to wide audiences. False reports abounded during and after Hurricane Sandy came ashore in 2012,20 so much so that the Federal Emergency Management Agency (FEMA) created a webpage that identified and validated (or not) rumors about current emergency status.21 Sharing information is also a distinct action that is fundamental to the social media user experience. Community-wide sharing of information on fast-moving events like disasters and public emergencies makes social media a potentially powerful tool for enhancing public safety through near real-time and highly localized updates. However, it also is the source of considerable concern over the dissemination of incorrect or outdated information.
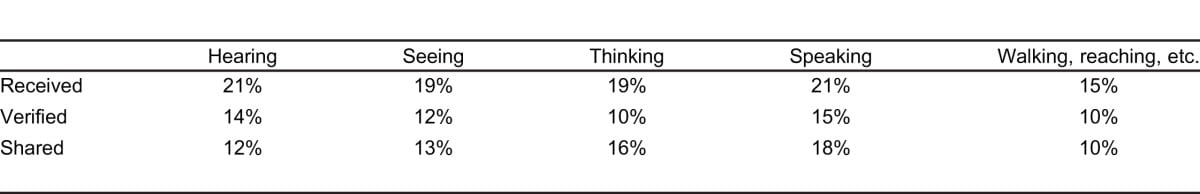
Table 4 shows the response data from the Emergency Communications Survey to 3 questions asking respondents to identify all the media used to receive, verify, and share information about their most recentpublic alert. Notably, social media ranks rather low for each of these actions, at percentages far below the rates of general use of social media for these same respondents.
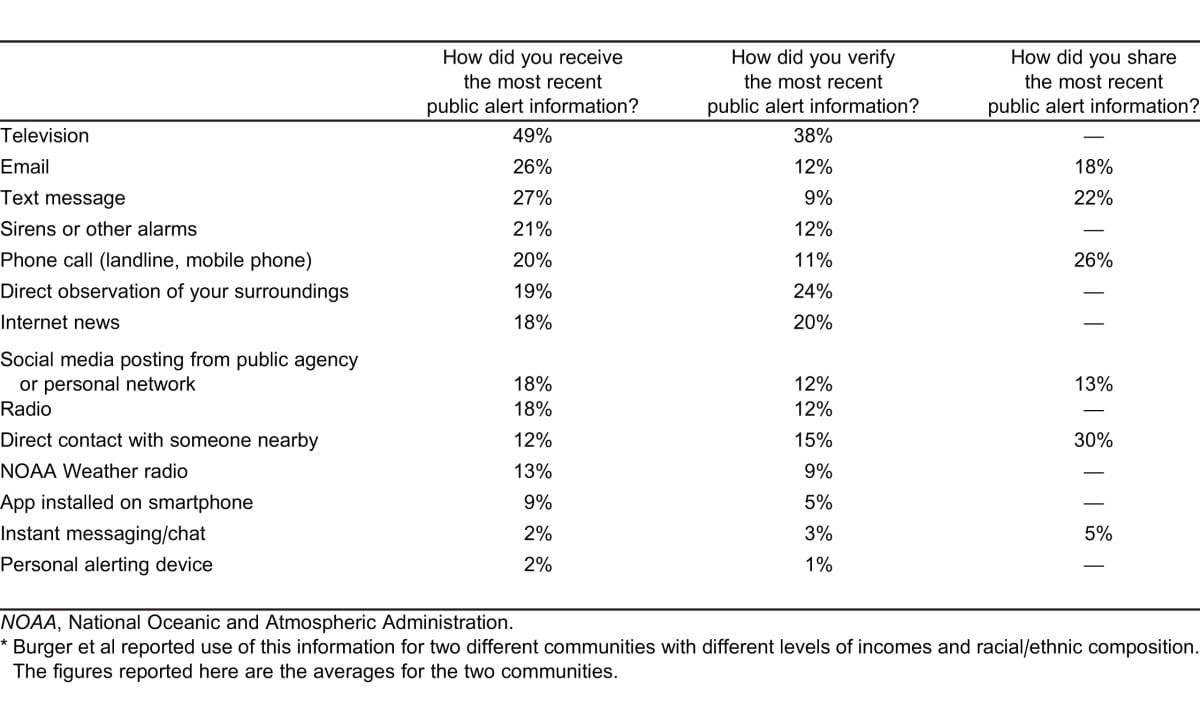
Methods of receiving, verifying, and sharing emergency alert information – All respondents with a disability.
These results are comparable to those from 2 other studies on communications during disasters and public emergencies. In Table 5, data for some of the items in Table 4 are redisplayed alongside data from the most recent survey on social media use during emergencies conducted by the Red Cross, and data from the 2013 study of two communities in New Jersey during and after Hurricane Sandy conducted by Burger et al. In this last study, the authors reported use of a range of communications technology for 2 different communities with different levels of income and racial/ethnic composition. The figures reported here are the averages for the 2 communities for the items that matched the question in our survey.
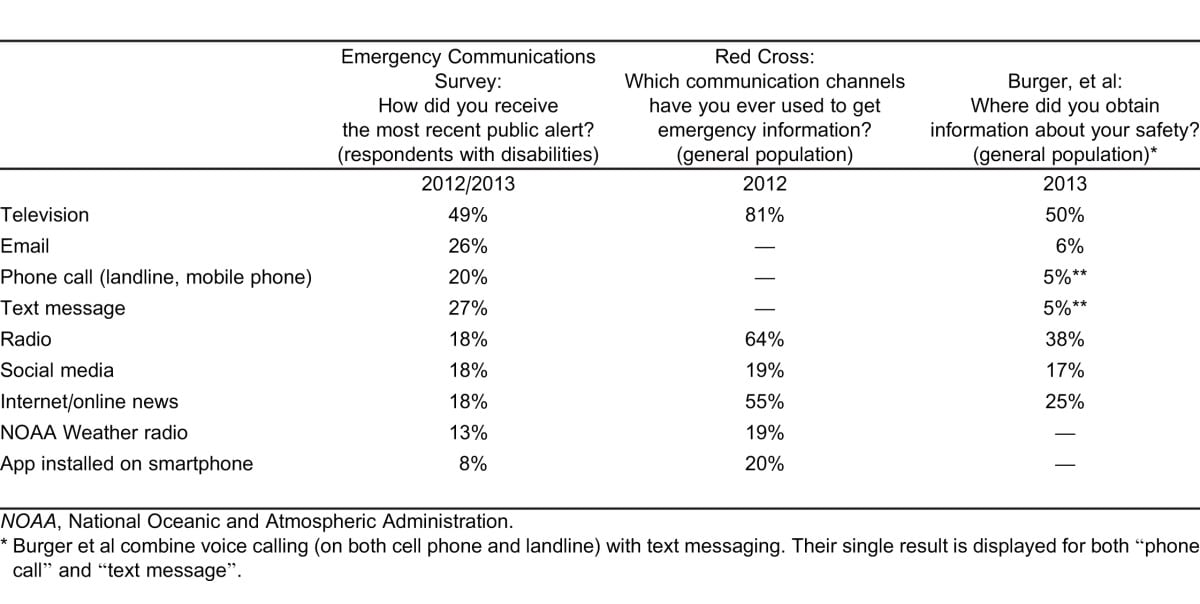
Methods of receiving emergency information: Results from three studies.
Use of Social Media During Emergencies—By Disability Type
Screen readers, voice command, speech-to-text, eye-gaze trackers, improved hearing aid compatibility, and custom configuration of interfaces are a few examples of the accessibility features of in-home and mobile information and communications technology (ICT). Yet access to rapidly evolving ICT is an ongoing challenge for users with disabilities. At the same time, disabilities like deafness and blindness can spur individuals to embrace technology more fully—and sometimes differently—than others.22
Table 6 shows the percentage of each of 5 disability types self-identified by respondents who received, verified or shared information via social media about the most recent public emergency possibly affecting them. The questionnaire asked respondents to select all disability types that applied to them from a list of 8. Three of those—walking, standing and climbing stairs; using arms; using hands and fingers—correspond to the ACS disability category “physical difficulty,” which is defined as: “a condition that substantially limits one or more basic physical activities, such as walking, climbing stairs, reaching, lifting, or carrying.”18 Consequently, response data for these 3 disability categories were combined for the analysis in Table 6.
Percentage of each disability group that received, verified, or shared their most recent public alert via social media.
Four of the 5 disability types—difficulty hearing, seeing, thinking, and physical difficulty—are weighted by total family income based on ACS data. The ACS relies on only 6 disability categories: the 4 functional disability categories mentioned immediately above, plus 2 activity-based categories (self-care and basic activities outside the home). Difficulty speaking is not an option in the ACS, and therefore cannot be weighted using ACS family income data.
The results in Table 6 show low use of social media for each of the 3 actions across all 5 disability types. Notably, those with speaking difficulties are consistently the most likely to use social media for all 3 actions. Those with physical difficulties are the least likely group to use social media across all 3 actions. However, the differences across all 5 disability categories are slight.
Results for those with vision and hearing difficulties can be further disaggregated by level of sensory loss: deaf and hard of hearing, and blind and low vision. The results in Table 7 show there is no significant difference in the rates of use of social media between people with low vision and people with blindness. Conversely, people who are deaf use social media at consistently and substantially higher rates than people who are hard of hearing.
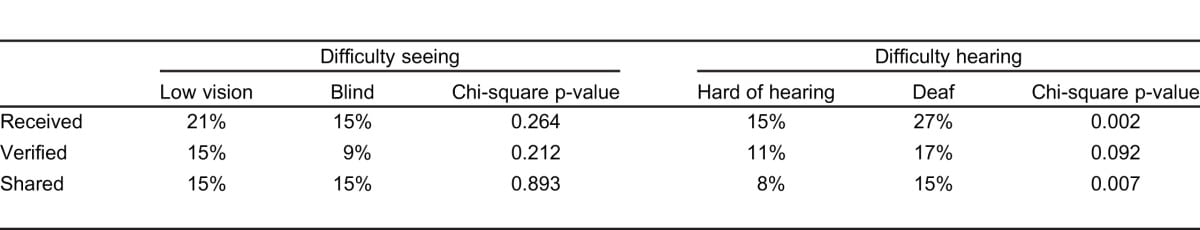
Percentage of respondents with vision and hearing loss received, verified, or shared most recent public alert via social media.
DISCUSSION
The role of social media in emergency communications is still not well established. In part, this is a result of the nature of these media, which allow users in the community to send and receive mass communications easily. Concerns over accuracy and trustworthiness can be considerable among users in the community,13 as well as among public safety and health officials.23
The data presented here show 4 specific results. First, use of social media in general is high for people with disabilities, as well as for the general population. Second, use of social media during emergencies is low for both groups. Third, levels of use of social media are not associated with income levels, but are significantly and strongly associated with age: younger people use social media at higher rates than older people in both groups. Fourth, differences in the use of social media during emergencies across disability types are slight. The only substantial and significant difference is between deaf and hard-of-hearing respondents, with the former more likely to have used social media to receive, verify and share emergency information.
These results show that people with disabilities as a group behave much like the general population in use of social and other media. Levels of social media use by people with disabilities are similar to those of the general population as documented by the Pew Research Center, the American Red Cross, and by more targeted studies like that conducted by Burger, et al.
High percentages of people with and without disabilities use social media for everyday communication. This behavior suggests that effective emergency communications strategies should include social media both for posting official alert information and for monitoring traffic originating in the community.
However, a robust system should include other media and community outreach efforts to maximize public awareness and safety across the entire community. At the current time, use of social media in emergency situations is secondary to more established broadcast media, especially television. As these media continue to evolve, relative use patterns are likely to change, warranting additional study.
LIMITATIONS
The primary limitation of this research was the reliance on convenience sampling of the disability community. It prohibited estimating the confidence intervals and confidence levels of the sample and subsamples. Unfortunately, techniques such as random digit dialing and supporting strategies for random selection are problematic when reaching people with disabilities, especially those who may have hearing, speech, or cognitive limitations. Nevertheless, our results are comparable to other survey research in the area of technology use during disasters and emergencies, especially with the Pew Research Center, American Red Cross, and more targeted studies like that conducted by Burger, et al.
Weighting the response data by ACS annual family total income data in order to correct potential biases introduced by convenience sampling has limits. First, the most recent ACS microdata available are from 2011. Our survey, however, was conducted in fall and winter 2012–2013. Second, the ACS includes only a limited set of disability types, which prohibits weighting for other disability types of interest, including blind, low vision, deaf and hard or hearing types. Our experience tells us that blind and low-vision individuals have different experiences using technology, and that deaf and hard-of-hearing individuals belong to entirely different cultures. Consequently, it would have been useful to have income weights for the population of people with these specific disabilities.
Additionally, we asked respondents about their use of a wide variety of media, but only for the most recent instance in which they received any alert or notice, not for disasters and emergencies in general. This helps to sharpen the focus on recent use patterns, while forfeiting insight into the various communications media people with disabilities generally might access during any disaster or emergency. Use of a specific medium on a specific occasion can result from a range of factors, including availability of voice or data networks, specific location of the individual respondent (in the home, outside, etc.), or nature of the specific emergency.
CONCLUSION
There does not seem to be a “disability divide” in the use of social media between the population of people with disabilities and the general population. However, there do seem to be slight variations between and among disability types, e.g., people with speech limitations and those who are deaf use social media during emergencies at higher rates than other disability types. People with physical limitations use social media least. Additionally, there is an age divide in both populations, with younger people using social media considerably more than older people.
Further, there seems to be a trust gap concerning information about public emergencies received via social media. Television is still the most-used medium for information regarding public emergencies. Social media are used for gathering emergency information by a relatively small percentage of the population, much smaller than the percentage that has access to social media. As a consequence, public safety and health authorities need to ensure that social media are complemented by other components of a comprehensive communications plan.
ACKNOWLEDGMENTS
This research was conducted by the Rehabilitation Engineering Research Center for Wireless Technologies (Wireless RERC), which is funded by the National Institute on Disability and Rehabilitation Research of the U.S. Department of Education, grant #H133E110002. The opinions contained in this document are those of the grantee and do not necessarily reflect those of the U.S. Department of Education. We also thank Ben Lippincott and Salimah LaForce for contributing to the development of the survey instrument used in this study.
Footnotes
Supervising Section Editor: Monica H. Swahn, PhD, MPH
Full text available through open access at http://escholarship.org/uc/uciem_westjem
Conflicts of Interest: By the WestJEM article submission agreement, all authors are required to disclose all affiliations, funding sources and financial or management relationships that could be perceived as potential sources of bias. The authors disclosed none.