
| Author | Affiliation |
|---|---|
| Dajun Dai | Georgia State University, Department of Geosciences, Atlanta, GA |
| Emily Taquechel | Georgia State University, Institute of Public Health, Atlanta, GA |
| John Steward | Georgia State University, Institute of Public Health, Atlanta, GA |
| Sheryl Strasser | Georgia State University, Institute of Public Health, Atlanta, GA |
ABSTRACT
Introduction:
Motor vehicle-pedestrian crash is a significant public health concern. The urban campus of Georgia State University poses unique challenges due to a large number of students and university employees. The objectives of this study are twofold: 1) to examine the correlation between specific features of the built environment on and around the University campus and pedestrian crashes; and 2) to identify crash clusters in the study area using network-based geospatial techniques.
Methods:
We obtained pedestrian crash data (n=119) from 2003 to 2007 from Georgia Department of Transportation and evaluated environmental features pertaining to the road infrastructure, pedestrian infrastructure and streetscape for each road segment and intersection. Prevalence rate of each feature with pedestrian crashes present was calculated. We used network-based Kernel Density Estimation to identify the high density road segments and intersections, then used network-based K-function to examine the clustering of pedestrian crashes.
Results:
Over 50% of the crosswalk signs, pedestrian signals, public transit, and location branding signs (more than three) at intersections involved pedestrian crashes. More than half of wider streets (greater than 29 feet), two-way streets, and streets in good condition had pedestrian crashes present. Crashes occurred more frequently in road segments with strong street compactness and mixed land use present and were significantly (p<0.05) clustered in these high-density zones.
Conclusion:
Findings can be used to understand the correlation between built environment and pedestrian safety, to prioritize the high-density zones for intervention efforts, and to formulate research hypotheses for investigating pedestrian crashes.
INTRODUCTION
Motor vehicle-pedestrian crash is a serious public health problem. According to the National Highway Traffic Safety Administration (NHTSA), it is estimated that 4,600 to 5,300 pedestrians are killed by motorists, and 80,000 to 120,000 more are injured each year.1 Urban environments, although rich with many unique resources and opportunities, are often “black spots” for pedestrian crashes. The nature of urban design contributes to highly condensed and heavily trafficked areas, as they are usually the business centers of the surrounding area, as well as hubs for entertainment and residence. Downtown areas are dense with pedestrian foot traffic, which raises the issue of pedestrian crashes; Atlanta is no different. Between the years 2000 and 2005, metropolitan Atlanta has seen a growth rate of 15% and was ranked one of the worst places for pedestrian injury and fatality.2,3
Urban university campuses face unique challenges when dealing with pedestrian safety issues. Densely packed street networks, combined with the assemblages of student pedestrians that navigate them, create corridors for pedestrian crashes. As an urban university in the heart of downtown, Georgia State University (GSU) has over 31,000 students and university employees.4 This large vulnerable population is forced to navigate around the fast-moving, high-volume traffic of downtown Atlanta every day. Many hazards are associated with crossing campus streets—motor vehicle traffic volume, speed, and street design, all of which are present on the GSU campus. For example, the surveys from Georgia Department of Transportation (GDOT) indicate the traffic volume around the GSU campus averages 14,000 vehicles daily.5 Besides factors of pedestrians and motorists, it is necessary to evaluate the built environment contributing to pedestrian crashes and identify high density zones of crashes before any interventions take place.
The built environment, including road infrastructure, pedestrian infrastructure and streetscape, has a strong influence on pedestrian safety. It can provide buffers between pedestrians and motorists, such as refuge islands.6 It can also encourage motorists to keep a safe speed through the inclusion of traffic calming measures, such as speed humps, traffic circles, and road narrowing.7 The built environment, such as crosswalk signs,8 may provide pedestrians with more visibility as well. Additionally, street width may have an influence on pedestrian safety. Some studies found a concentration of crashes on major arterial streets, which tend to be wider than small streets and put pedestrians at greater risk for a longer period of time while crossing the road.9,10 Lightstone et al.11reported that the majority of midblock crashes occurred in streets less than 35 feet in width, while the majority of intersection crashes occurred on streets greater than 70 feet in width.11 These results suggest that there are confounding factors that might affect crash patterns at certain sites, for instance, block length and presence of crosswalks and crosswalk signals. Studies found that for both midblock and intersection crash locations, long block length was a contributing factor.10,12 Lastly, mixed land use, such as a mixture of commercial and retail businesses with residential areas,8,10,13,14 often plays an influential role in pedestrian safety, as they attract foot traffic around the businesses.
Besides the identification of the environmental features correlated with pedestrian crashes, detecting the high-density zones, which refers to the number of pedestrian crashes per unit of road segment, is critical for an intervention program.2,15 These zones have a high prevalence of pedestrian crashes. Therefore, although pedestrian safety in a motorized urban environment, such as Atlanta, is important throughout a city, public health interventions prioritized at these high-density zones are paramount to make accident reduction efforts more effective.16 The development of Geographic Information Systems (GIS) and spatial analysis techniques allows for density estimation and clustering of crashes, which helps to identify the high-density zones.
Ordinary Kernel Density Estimation (KDE) and K-function in GIS have been used to address the issue of traffic accidents,17–19 but questions remain as to whether or not the methods can be directly applied to street- related events. Both methods are conventionally applied to an unbounded homogeneous plane using Euclidian distance measure;20 they are, however, limited in analyzing traffic accidents that are constrained in a one-dimensional linear space along a street network.16,21Studies show that ordinary KDE and K-function are likely to provide misleading conclusions when they are used to study events (e.g., crime or traffic accident) distributed along streets.16,22,23 One possible reason is that the streets themselves exhibit high-density and clustering tendencies in cities.16 Studies extend the ordinary KDE and K-function on network, that is, network-based KDE16,22 and network-based K-function23 that can effectively investigate events distributed along streets.16,22,23 Among these extended methods, the network versions of KDE and K-function (referred to as NKDE and NK-function in this study) developed by Okabe et al.24 receive growing attention and have been effectively used in studies.20,23,25 To our knowledge, neither approach has been used yet to address pedestrian crashes.
This study aims to identify modifiable environmental features correlated with pedestrian crashes and detect high-density crash zones through statistical analyses and network-based spatial analyses, respectively. We first examined a few environmental features (e.g., street width, public transits including bus stops and train stations, and corner radius) on and around the GSU campus. We then used the NKDE to identify the high-density road segments. Finally, the NK-function was used to test the statistical significance of the spatial clustering of the pedestrian crashes in these high-density zones. This research makes a twofold contribution. First, it identified environmental features that could be correlated with pedestrian crashes. Once identified, they may be modified to improve the walking environment for pedestrian safety, thus enhancing the feasibility of creating appropriate interventions. Second, this study detected high-density zones for pedestrian crashes. These zones shall be a higher priority for intervention efforts. Findings can also be used to formulate hypotheses for investigating pedestrian crashes in future.
METHODS
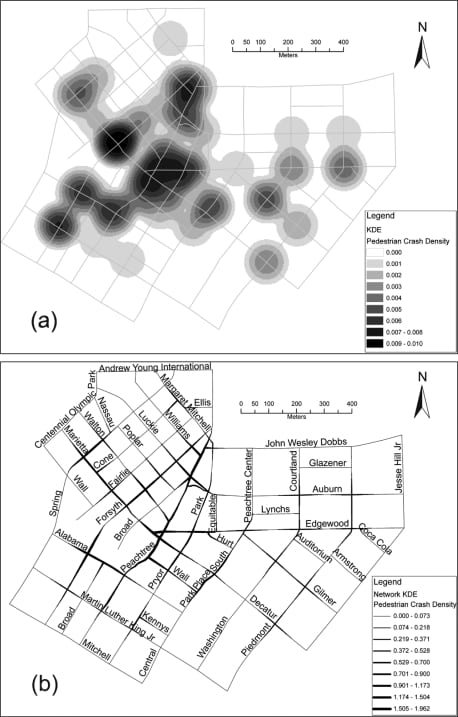
The study area is approximate 0.35 square miles located in downtown Atlanta, Georgia (Figure 1). It includes the GSU campus with its offices, classrooms, and parking garages, which are mixed with business and government buildings. Little residential land use is present. Because the mixture of GSU with other land uses makes it difficult to determine the percentage of GSU space, the study area is carefully selected based on what constitute the campus and any surrounding area where the students and university employees would be likely to traverse for university-related activities. A large commuting population and high traffic volume make this study area appropriate to examine pedestrian safety related to university lives. As a densely populated urban university, GSU has over 31,000 students and employees,4 and the majority commute either by driving or taking Atlanta public transits, thus constituting a large vulnerable population. Several arterial roads, such as Peachtree Center Avenue and Piedmont Avenue, cross the campus.
This study obtained 5-year (2003–2007) crash data (n=119) from the GDOT. The GDOT compiled the data from the police reports that provide detailed documents used for legal purposes and identifying traffic safety hazards. For each accident, the police recorded the road type and name, as well as the distance from the accident spot to the nearest intersection or to the nearest hundredth mile log, which allows the GDOT to map the accident in GIS. Police officers also classified the injuries following an accident report instruction.26 The 119 crash data include no injury (n=21), fatalities (n=2), serious injuries (n=11), visible injuries (n=25), and complaints (n=60). Based on the instruction, serious injuries mean injured persons cannot walk, drive, or continue their normal activities, and complaints indicate pedestrians complain of being hurt without any visible wounds. Pedestrian health records for detailed severity scores and injured body parts evaluated by on-scene healthcare providers are not available due to privacy protection. Given the small number in each category, we grouped all in the same “crash” category, as investigating them separately may introduce a “small population” problem—rare events tend to have high rates due to the large variation.27 We obtained street network data in the study area from the Environmental Systems Research Institute (ESRI; Redlands, California) and used it for geocoding the built environment features, the subsequent built environment evaluation, and spatial analyses.
From June to August of 2009, a research assistant collected the built environment data pertaining to the road infrastructure, pedestrian infrastructure, and streetscape for each intersection and road segment in the study area through environmental audits. Two separate audit forms were created, one for intersections and the other for segments. Intersection audits included measures in four categories: crosswalk signs, pedestrian signals, transit, location branding signs, and vehicle instruction signs. Coordinates for all intersections were collected using a handheld Global Positioning System (GPS) unit. Each segment was defined as the discrete section of a road between two adjacent intersections. Segment audits included measures in five categories: lanes, sidewalks, environment, signage, and streetscape. The selection of these features is based on literature10,14,28–30 showing their correlations with pedestrian crashes. Additionally, several features related to pedestrian crashes were left out of the study due to their ubiquitous presence (e.g., crosswalk, sidewalk, and lighting) or absence (e.g., speed limit sign) in the study area. The audit results were geocoded in ArcGIS 9.3 (ESRI; Redlands, California).
We conducted descriptive analysis after the overlay of pedestrian crash locations on each environmental feature in GIS. Each incident was characterized by the environmental features present. After summarizing the total incidences associated with each environmental feature, we calculated the prevalence rates for each environmental feature by dividing the number of a particular feature associated with pedestrian crash present by the total number of that particular feature in the study area. One may also calculate the prevalence rate for each feature via dividing the number of pedestrian crashes with an environmental feature present by the total number of crashes in the study area, yet this approach may be subject to the significant variation in the number of features present. That is, some features are overrepresented (e.g., 53 locations with a street width between 36 and 40 feet) or underrepresented (e.g., only four locations with a street width between 21 and 25 feet). The method employed in this study thus may reduce such bias, which from a public health point of view, is important to understand the correlation of each feature with crashes while accounting for the unequal number of features. Features associated with the segments were determined by gross numbers, and the varied size of the segments (Figure 1) was not accounted for. Admittedly, this weakness might affect the prevalence rate and shall be addressed in future.
The NKDE22 and the NK-function,23 implemented in SANET24 coupled with ArcGIS 9.3, were employed to identify the zones with high density and to test the clustering of the pedestrian crashes, respectively. We used these two methods as studies22,23,25 demonstrate both are effective and reliable to investigate spatial patterns of point events (e.g., traffic accidents) along a street network. For comparison, this study also tested the ordinary KDE and K-function.
The first step is to estimate the density of crashes along the street network using the NKDE. The ordinary KDE calculates density within a circular window (i.e., kernel) that moves across the study area.31 Events (pedestrian crashes) within the kernels are weighted based on their Euclidean distance from the kernel center, and the resulting density value is assigned to that center. The distance is weighted according to a kernel function. Okabe and his colleagues argued22,23 that the application of ordinary KDE to density estimation on a network produces biased estimates. They proposed a NKDE22 that constraints the kernel on a network. Crashes within the kernels are weighted based on their network distance from the kernel center following street lines using an unbiased kernel function. This study uses the equal-split continuous kernel method because it is unbiased.22See Okabe et al.22 for more detailed discussion on NKDE. The choice of kernel bandwidth (i.e., the size of the window) is important in density estimation as the estimated density varies according to the bandwidth. Studies22,32 suggest 100–300 meter bandwidth because these values are widely employed in urban studies to model pedestrian catchment areas at the scale of a block or street. Given the high street density in the study area, this research utilized a 100-meter bandwidth, which is within the range. The resulting density is expressed as the number of pedestrian crashes per meter. The ordinary KDE used 100-meter bandwidth too. It results in a density showing the number of pedestrian crashes per square kilometers given that the kernel is not restricted on the network.
The second step is to evaluate the clustering of the observed crash distribution from the NKDE. The ordinary K-function33 draws circular windows, whose radii range from the smallest to a size covering the entire study area, around each crash spot. It then compares the cumulative numbers of crashes (i.e., K value) up to certain radii in the observed distribution with the cumulative numbers of crashes to the same radii in random distributions. If the accumulated number of crashes in the observation at a radius is more than the accumulated number of crashes in a random distribution at the same radius, the observed crashes are believed to be clustered at the distance of the radius. Yet the ordinary K-function using Euclidean distance dramatically underestimates the actual network distance in cities.34 On the contrary, the NK-function proposed by Okabe and Yamada23 uses the distance along street network and simulates the crashes in random distributions on the street network, which is more accurate than the ordinary K-function.23,25,34 For both K-function and NK-function, this study conducted 999 times of Monte Carlo simulations to derive the statistical significance of the observed distribution. If the observed K value is to the left side of the random envelope (the highest and lowest K based on the simulations) at a distance, then the pedestrian crashes are clustered at that distance.
Ideally, the analysis shall include both pedestrian and motor vehicle volumes. Unfortunately, no survey on pedestrian count has been done so far and the traffic-count surveys from the GDOT only sample a couple of intersections in the study area; the sparsity of sampling locations prevents us from interpolating the traffic counts in the entire area. Given the influence of University enrollment, calendar, and budget on the volumes of students and employees, surveying pedestrians and motorists shall be a long-term effort reflecting the yearly, seasonal, and daily variations. Such surveys shall be included in the future once available.
RESULTS
Among the 119 pedestrian crashes, nearly 70% occurred at intersections and over 30% occurred in midblocks. Table 1 is based on the total crashes that occurred at intersections, whereas the following percentages in Table 2 are based on all crashes that occurred within the study area. As Table 1displays, nearly 54% of crosswalk signs, 55% of pedestrian signals, and over 57% public transits had pedestrian crashes present. Results also show that the locations having over three location branding signs had much higher prevalence (nearly 71%), compared with locations having less than three location branding signs (33.3%). Additionally, half of the locations with 5–6 vehicle instruction signs had experienced pedestrian crashes. Interpreting these results takes caution as these environmental features, such as location branding signs and vehicle instruction signs, may appear more in higher volumes of pedestrians and motor vehicles, yet this study was unable to account for the volumes given the shortage of such information.
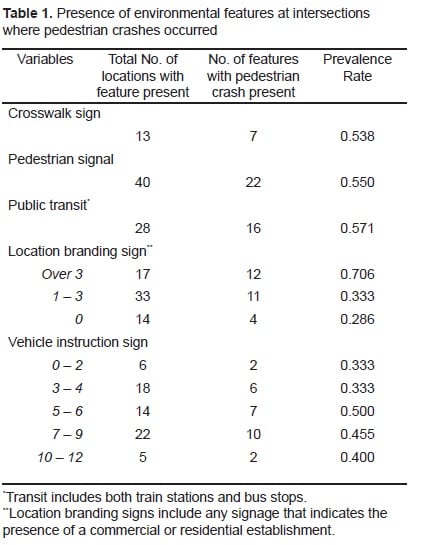
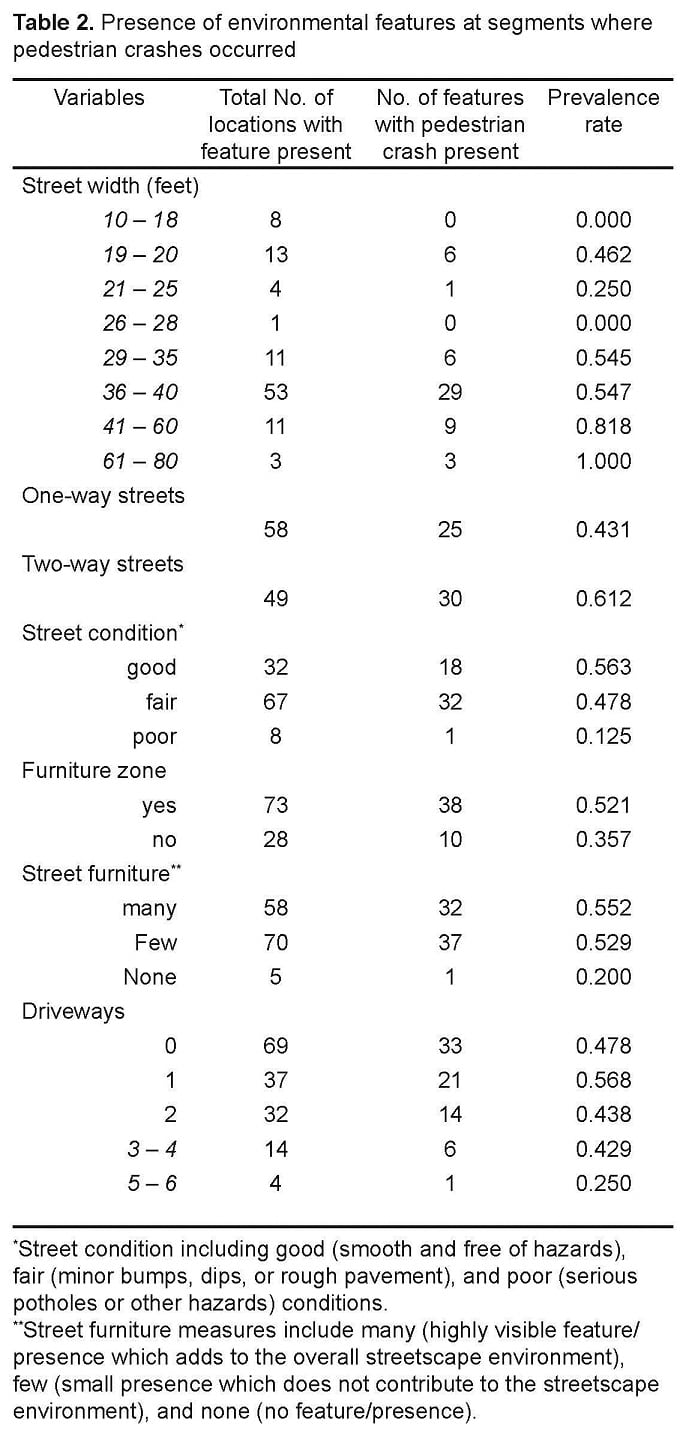
Table 2 shows that street width, street condition, furniture zone, and street furniture are positively associated with pedestrian crashes. First, wider streets had a higher prevalence of pedestrian crashes, and the highest prevalence existed at locations with a street width greater than 60 feet (100%). No pedestrian crashes occurred at a location where the street width is 18 feet or less. Second, the prevalence of two-way streets having pedestrian crashes (61.2%) was higher than that of one-way streets (43.1%). Third, locations with a street in good condition showed a prevalence of 56.3% with pedestrian crashes, compared to 48% locations with a street in fair condition and 13% locations with a street in poor condition. Fourth, over 52% locations with a furniture zone were associated with crashes compared to 35.7% of locations without a furniture zone. In addition, over 55% of locations with a sidewalk containing a good amount of street furniture (characterized as “many”) had pedestrian crash events, compared with 53% at locations with a sidewalk containing a small amount of street furniture (characterized as “few”). Lastly, locations with more than five driveways had a very low prevalence (25%) of pedestrian crashes, compared to locations with less than five driveways.
Figure 1 shows an estimation of pedestrian-crash density using both the ordinary KDE (Figure 1a) and the NKDE (Figure 1b). The planar KDE extended the estimation to areas where no streets are present. On the contrary, the NKDE clearly delineated high crash-density segments by showing the number of pedestrian crashes per meter of road segment. These high-density segments can be seen on streets such as Spring, Forsyth, Peachtree, Park, Park Place South, Alabama, Decatur, among others. These zones have mixed commercial and retail use. For example, there is a high-density triangle formulated by Peachtree, Marietta, and Edgewood, where GSU Andrew Young School of Public Policy, GSU Department of Computer Science, and the Georgia State Government building are mixed with Five Point (the transit station linking all four subway lines), restaurants, and retailers.
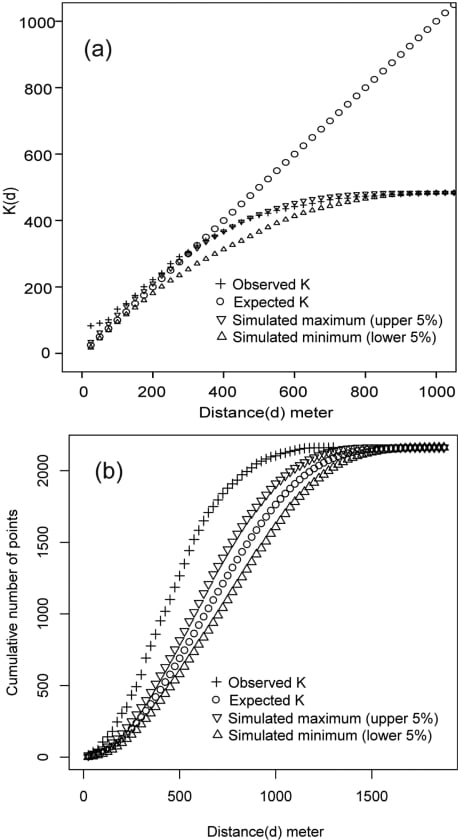
The NK-function revealed the statistically significant clustering of pedestrian crashes (Figure 2). The planar K-function suggested that the pedestrian crashes were clustered up to approximately 300 meters because the observed K values are to the left side of the envelope (Figure 2a) up to this distance. Yet the NK-function revealed the crashes were clustered up to 1,200 meters (Figure 2b), given that the observed K values are always to the left of the upper 5% curve up to this distance. Therefore, pedestrian crashes in the study area present strong clustering on the street network. This confirms the observation from the NKDE that crashes are dense in certain segments.
DISCUSSION
This research shows built environmental features at intersections expose certain correlations with pedestrian crashes. More than half of the locations with five vehicle instruction signs or more than three location branding signs experience pedestrian crashes. One study suggested that motorists might be affected by too many visual stimuli on the road.35 Other factors, however, cannot be ruled out; for example, the number of signs present may correlate with traffic density (e.g., higher volume of motor vehicles), thereby increasing exposure to pedestrian crashes. In addition, more than half of the locations with crosswalk signs present had pedestrian crashes, which is contrary to some studies that show the presence of crosswalk signs is protective.29,36,37 Yet we cannot conclude this unambiguously because some prevention interventions after these crashes occurred might have been taken before the environment audit, which had changed the pedestrian risk at these intersections. Besides, the absence of speed limit signs in the area and possible fast speed may prevent one from timely stopping the vehicle to avoid crashes, which necessitates a survey in the future of actual traveling speed.
Road infrastructure is also correlated with pedestrian crashes. First, street widths are positively correlated with pedestrian crashes, which is consistent with the literature.9–11 Street width is the main indicator for crossing distance—crossing wider streets requires staying in the road for a longer period of time, thus increasing a pedestrian’s chance of being hit by a motorist. This correlation, however, warrants further investigation as densities of pedestrians and vehicles were not taken into account. Second, two-way streets have higher prevalence rates than one-way streets. This can be contributed to the fact that these roads are wider than most others in our study area, which confirms the positive correlation between street widths and pedestrian crashes. Besides, compared to one-way streets, two-way streets are more difficult for pedestrians to navigate as they must cross against two directions of traffic. The addition of a refuge island could be protective for crossing wider or two-way streets.6 Third, the prevalence rates of fair and good road conditions where crashes occurred are higher than that of poor road conditions. One study38 explained that the fewer potholes and defects a road has, the more likely the motorist will travel at a high speed, which makes them less likely to have a timely response to a pedestrian crossing the street. Fourth, areas with street furniture are more likely to have pedestrian crashes than areas without furniture and more than half of locations with furniture zones experience pedestrian crashes. One possible reason is that areas with more street furniture and with furniture zones may also be more populated, which increases the probability of crashes because of the higher pedestrian density. This requires taking into account pedestrian and motor vehicle counts in future research.
The spatial analysis reveals the high density zones and the strong clustering of the pedestrian crashes in these zones. Major GSU classroom and administration buildings are along these high-density zones, such as Park Place South between Hurt and Wall, where students and university employees have to interact with vehicles, thus formulating hazardous corridors on these streets. In addition, these zones consist of mixed land use including GSU buildings, government buildings, restaurants, and recreational sites (e.g., Underground and Hurt Park), among others. These zones have strong street compactness, which is in line with previous studies reporting that areas with high retail density, neighborhood compactness, great land use mix, and high employment density increase crash risk.8–10 This study, in addition to exploring the geographic distribution of pedestrian crashes, shows the network-based spatial techniques are effective for investigating the spatial patterns of street-related point events. Results suggest both NKDE and NK-function perform better than the ordinary KDE and K-function, which confirms previous findings.16,22,25
LIMITATIONS
This study is subject to several limitations. The first is the small number of pedestrian crashes and environmental features in the study area. For example, only three streets are wider than 60 feet, which may result in significant variations in the calculation of prevalence rate. Moreover, the small population problem prevents this study from evaluating statistical significance of the association between environmental features and pedestrian crashes. Second, the correlations between environmental features and crashes warrant further investigation as this study did not differentiate the severity of injuries and did not take into account the volumes of pedestrians and motor vehicles. One may argue that injuries that are not severe might be seen as a success of the protective characteristics of some environmental features compared to severe injury or fatality. Given that less than 30% of the crashes in this study resulted in severe injuries or fatalities, excluding these non-severe crashes will worsen the small population problem, which increases the sensitivity of estimating the correlation between environmental features and pedestrian crashes. In addition, traffic and pedestrian counts are necessary to enhance this study so that the correlation of built environment with pedestrian crashes can be better understood. Third, findings of the correlations are further subject to the time lag between the crashes and the environmental audit. The environment might have been modified prior to the audit, which might bias the correlations. More recent crash data would be more appropriate when they are available. Last but not least, surveys of both motorist and pedestrian behaviors may provide insights into the high-density zones besides the environmental audit.
CONCLUSION
This research was designed to evaluate the role of the built environment on pedestrian crashes and to explore the spatial variation in pedestrian crashes using network-based spatial analysis techniques within an urban university campus. It has important implications for pedestrian safety on urban campuses. GSU has seen a growing student population4 in recent years. This, along with the growing trend of using mass transit, is creating a wave of new pedestrians on and around the campus. The growing trends could cause an increase in pedestrian crashes as more people are put at risk. It is imperative that research look at the ways in which the environment can improve the pedestrian conditions around these urban centers and heighten interventions at the high-density zones, thus improving pedestrian safety. Through the inclusion of the results presented here into the larger matrix of injury prevention, appropriate countermeasures can be applied to the issue of pedestrian safety on urban university campuses.
Footnotes
Supervising Section Editor: Monica H Swahn, PhD
Submission history: Submitted March 1, 2010; Revision Received April 14, 2010; Accepted April 21, 2010
Full text available through open access at http://escholarship.org/uc/uciem_westjem
Address for Correspondence: Dr. Dajun Dai, Assistant Professor in Geography (GIS), Department of Geosciences, P.O. Box 4105, Atlanta, Georgia 30302-4105
Email: ddai@gsu.edu
Conflicts of Interest: By the WestJEM article submission agreement, all authors are required to disclose all affiliations, funding sources, and financial or management relationships that could be perceived as potential sources of bias. The authors disclosed none.
REFERENCES
1. National Highway Traffic Safety Administration National Pedestrian Crash Report. Available at:http://www-nrd.nhtsa.dot.gov/Pubs/810968.PDF. Accessed January 30, 2010.
2. Beck LF, Paulozzi LJ, Davidson SC. Pedestrian fatalities, Atlanta metropolitan statistical area and United States, 2000–2004. J of Safety Research. 2007;38:613–16. [PubMed]
3. Ewing R, Schieber RA, Zegeer CV. Urban sprawl as a risk factor in motor vehicle occupant and pedestrian fatalities. Am J of Publ Heal. 2003 Sep;93:1541–45.
4. Georgia State University Georgia State University Fact Sheet. Available at:http://www.gsu.edu/factsheet.html. Accessed February 20, 2010.
5. Georgia Department of Transportation Georgia Traffic Count Database. Available at:http://www.dot.state.ga.us/statistics/TrafficData/Pages/TrafficCounts.aspx. Accessed March 1, 2010.
6. Garder P. Pedestrian safety at traffic signals: a study carried out with the help of a traffic conflict technique. Accident Analysis and Prevention. 1989;21:435–44. [PubMed]
7. Garder PE. The impact of speed and other variables on pedestrian safety in Maine. Accident Analysis and Prevention. 2004 Jul;36:533–42. [PubMed]
8. Loukaitou-Sideris A, Liggett R, Sung HG. Death on the Crosswalk: A study of pedestrian-automobile collisions in Los Angeles. Journal of Planning Education and Research. 2007;26:338.
9. Morency P, Cloutier M-S. From targeted “black spots” to area-wide pedestrian safety. Injury Prevention. 2006;12:360–64. [PMC free article] [PubMed]
10. Schuurman N, Cinnamon J, Crooks VA, et al. Pedestrian injury and the built environment: an environmental scan of hotspots. BioMedCentral Public Health. 2009;9
11. Lightstone AS, Dhillon PK, Peek-Asa C, et al. A geographic analysis of motor vehicle collisions with child pedestrians in Long Beach, California: comparing intersection and midblock incident locations. Injury Prevention. 2001;7:155–60. [PMC free article] [PubMed]
12. Schuurman N, Hameed SM, Fiedler R, et al. The spatial epidemiology of trauma: the potential of geographic information science to organize data and reveal patterns of injury and services. Canadian Journal of Surgery. 2008;51:389–95.
13. Clifton KJ, Kreamer-Fults K. An examination of the environmental attributes associated with pedestrian-vehicular crashes near public schools. Accident Analysis and Prevention. 2007;39:708–15. [PubMed]
14. Cho G, Rodriguez DA, Khattak AJ. The role of the built environment in explaining relationships between perceived and actual pedestrian and bicyclist safety. Accident Analysis and Prevention.2009;41:692–702. [PubMed]
15. Warden CR. Comparison of Poisson and Bernoulli spatial cluster analyses of pediatric injuries in a fire district. International Journal of Health Geographics. 2008;7:1–17. [PMC free article] [PubMed]
16. Xie Z, Yan J. Kernel density estimation of traffic accidents in a network space. Computers, Environment and Urban Systems. 2008;32:396–406.
17. Erdogan S, Yilmaz I, Baybura T, et al. Geographic information system aided traffic accident analysis system case study: city of Afyonkarahisar. Accident Analysis and Prevention.2008;40:174–81. [PubMed]
18. Krisp JM, Durot S. Segmentation of lines based on point density – An optimisation of wildlife warning sign placement in southern Finland. Accident Analysis and Prevention. 2007;39:38–46.[PubMed]
19. Pulugurtha SS, Krishnakumar VK, Nambisan SS. New methods to identify and rank high pedestrian crash zones: An illustration. Accident Analysis and Prevention. 2007;39:800–11.[PubMed]
20. Okabe A. A theme issue on spatial analysis and GIScience in honor of Atsuyuki Okabe Preface. J of Geograph Syst. 2009;11:107–12.
21. Okabe A, Satoh T. Uniform network transformation for point pattern analysis on a non-uniform network. Journal of Geographical Systems. 2006;8:25–37.
22. Okabe A, Satoh T, Sugihara K. A kernel density estimation method for networks, its computational method and a GIS-based tool. International Journal of Geographical Information Science. 2009;23:7–32.
23. Okabe A, Yamada I. The K-function method on a network and its computational implementation.Geographical Analysis. 2001;33:271–90.
24. Okabe A, Okunuki K, Shiode S. SANET: A toolbox for spatial analysis on a network. Geographical Analysis. 2006;38:57–66.
25. Yamada I, Thill J-C. Comparison of planar and network K-function in traffic accident analysis.Journal of Transport Geography. 2004;12:149–58.
26. Georgia Department of Transportation Georgia uniform vehicle accident report instruction guide. Available at: http://www.nhtsa-tsis.net. Accessed February 20, 2010.
27. Mu L, Wang F. A scale-space clustering method: Mitigating the effect of scale in the analysis of zone-based data. Ann of the Associa of Am Geographers. 2008;98:85–101.
28. Lee JY. A three-dimensional navigable data model to support emergency response in microspatial built-environments. Ann of the Associa of Am Geographers. 2007;97:512–29.
29. Clifton KJ, Burnier CV, Akar G. Severity of injury resulting from pedestrian-vehicle crashes: What can we learn from examining the built environment. Transportation Research Part D. 2009;14:425–36.
30. Li F, Harmer P, Cardinal BJ, et al. Built environment and changes in blood pressure in middle aged and older adults. Preven Med. 2009;48:237–41.
31. Parzen E. On estimation of a probability density function. Annals of Mathematical Statistics.1962;33:1065–76.
32. Porta S, Latora V, Wang F, et al. Street centrality and densities of retails and services in Bologna, Italy. Environment and Planning, B, Planning and Design. 2009;36:450–65.
33. Ripley BD. The second-order analysis of stationary point processes. Journal of Applied Probability. 1976;13:255–66.
34. Spielman S. Appropriate use of the K-function in urban environments. American Journal of Public Health. 2006;96:205. [PMC free article] [PubMed]
35. Dixon MA, Jacko JA. An investigation of tactile and visual stimuli in the roadway environment.Perceptual and Motor Skills. 1998;87:387–94. [PubMed]
36. Van-Houten R, Malenfant L. The influence of signs prompting motorists to yield before marked crosswalks on motor vehicle-pedestrian conflicts at crosswalks with flashing amber. Accident Analysis and Prevention. 1992;24:217–25. [PubMed]
37. Nassar JL. Promoting drivers to stop for crossing pedestrians. Transportation Research Part F.2003;6:175–82.
38. Retting RA, Ferguson SA, McCartt AT. Review of evidence-based traffic engineering measures designed to reduce pedestrian-motor vehicle crashes. Am J of Publ Heal. 2003;93:1456–63.