| Author | Affiliation |
|---|---|
| Mark I. Langdorf, MD, MHPE | University of California Irvine, Department of Emergency Medicine, Orange, California |
| Sharon Lee, MD | University of California Irvine, Department of Emergency Medicine, Orange, California |
| Michael D. Menchine, MD, MPH | University of Southern California, Department of Emergency Medicine, Los Angeles California |
Introduction Methods Results Discussion Conclusion
ABSTRACT
Introduction: Higher-level-of-care (HLOC) transfers to tertiary care hospitals are common. While this has been shown profitable for hospitals, the impact on physicians has not been described. Community medical center call panels continue to erode, in part due to the perception that patients needing transfer are underinsured. Surveys show that the problematic specialties to maintain call panels in community hospitals are neurosurgery, otolaryngology, plastic surgery, orthopedics and ophthalmology. This places greater stress on tertiary care hospitals’ physicians. The objective of this study is to describe the financial consequences to physicians who care for HLOC transfers across specialties and compare these with all patients from each specialty and specialty-specific national reimbursement benchmarks.
Methods: Financial data were obtained for all HLOC transfers to a single tertiary care center from January 2007 through March 2008. Work relative value unit (RVU) and reimbursement were taken from a centralized professional fee billing office. National benchmarks for reimbursement per RVU were calculated from the 2006 Medical Group Management Association (MGMA) Compensation and Production Survey.
Results: In this period 570 patients were transferred, 319 (55.9%) through the emergency department (ED). Reimbursement per RVU varied from a high of $74.93 for neurosurgery to $25.91 for family medicine. Reimbursement to emergency medicine (EM) for HLOC patients was 16% above the average reimbursement per RVU for all ED patients ($50.5 vs. $43.7). Similarly, neurosurgery reimbursement per RVU was 22% above the reimbursement per RVU for all patients ($74.93 vs. $61.27). The remainder of specialties was reimbursed less ($25.91 vs $69.60) per RVU for HLOC patients than for all of their patients at this center. All specialties at this site were reimbursed less for each HLOC patient than national average reimbursement for all patients in each specialty.
Conclusion: Average professional fee reimbursement for HLOC patients was higher for EM and neurosurgery than for all other patients in these specialties at this site, but lower for the rest of the specialties. Compared to the national benchmarks, this site had an overall lower reimbursement per RVU for all specialties, reflecting a poorer patient mix. At this site HLOC transfers patients are financially advantageous for EM and neurosurgery.
INTRODUCTION
The federal Emergency Medical Treatment and Active Labor Act (EMTALA) mandates that all patients presenting to an emergency department (ED) must have a medical screening evaluation, and that emergent conditions must be treated within the capacity of the ED and hospital, regardless of ability to pay. If a patient’s emergency medical condition cannot be stabilized, often due to lack of specialist availability, then the patient may be transferred to another ED for higher level of care (HLOC). Conversely, hospitals with tertiary care capacity, often academic institutions, must accept these patients. Failure to comply with EMTALA carries civil fines and suspension from Medicare reimbursement.
Community hospitals have increasing problems maintaining specialist panels for their EDs.1,2 The cause is multifactorial, including erosion of the willingness of specialists to take ED call. This in turn is fueled by the perception that ED patients carry greater liability risk, and that specialists receive inadequate reimbursement from these patients or their often-underfunded insurance. The availability of on-call specialists to EDs has received attention from the media in recent years. The New York Times in 2004 stated “fewer and fewer doctors are willing to be on call to ERs given the high insurance premiums they must pay and, in many cases, the lack of reimbursement for treating the uninsured.”3The Institute of Medicine in 2007 concluded that the lack of on-call specialist availability was “one of the most troubling trends” in emergency care.4
The American College of Emergency Physicians (ACEP) surveyed 442 national ED directors in 2008, and 74% reported on-call specialist coverage problems,5 with the most problematic specialties of neurosurgery, plastic surgery, hand surgery, and orthopedics. A similar survey by the California chapter of ACEP found that 80% of ED physicians reported that on-call physicians were less willing to see underinsured or uninsured ED patients. Plastic surgery, head and neck surgery, neurosurgery, ophthalmology, and orthopedics, in that order, were the most problematic specialties for emergency physicians (EP) to obtain an admitting physician or secure follow-up care.1
A 2006 survey of 243 California ED directors found that rural EDs have the greatest problems obtaining specialty care.6 They reported long delays for transfer to HLOC. Interestingly, specialist physician availability in community hospitals was not found to be associated with the payer mix of the ED patients.
HLOC transfers to tertiary hospitals are common. A previous study performed at the same academic health center as this paper, showed that transfers for HLOC resulted in a net financial gain to the hospital, although reimbursement varied dramatically by insurance type.7 State (Medicaid) and county insurance reimbursements resulted in net losses to the hospital, comparable to the completely uninsured. Conversely, these losses were more than compensated for by reimbursement from private insurance carriers. For this same group of patients, the hospital realized a net profit of reimbursement over cost of $2,586,200.
The purpose of this study is to estimate the financial consequences to physicians who care for HLOC transfers. We specifically describe professional reimbursement, by specialty, and compare with all patients from each specialty during the same time period. Finally, we compare HLOC patients to specialty-specific national reimbursement benchmarks.
METHODS
The study used the same group of 570 HLOC patients to examine professional reimbursement as the previous study, which looked at hospital reimbursement.7
We identified all transferred patients (regardless of HLOC status) from 3 different sources. First, the county government Emergency Medical Services Agency maintains an Interfacility transfer (IFT) report with patients who were initially seen at a primary paramedic receiving center ED, but then sent immediately with the same ambulance to a designated specialty center (n=90 patients). Second, this hospital’s transfer center maintains a log of phone requests for transfer into this tertiary care facility (n=457 patients). We verified that patients on the IFT list came to this tertiary ED via this hospital’s electronic medical record and this log book. Finally, we queried the ED tracking board at this tertiary care hospital to identify referrals for HLOC that came directly to the EP, rather than the transfer center (n=185 patients). Duplicates were identified and removed from the list, resulting in 570 patients. Of these, 319 (55.9%) were transferred to this tertiary center through the ED, while 251 (44.0%) came to the tertiary center as direct admits from another inpatient setting.
Research assistants identified patients for the study who came to the tertiary center from another ED or inpatient setting via ambulance over a 14-month period (1/1/2007 to 3/31/2008). Since patients are never transferred to our tertiary center for elective reasons (physician preference, managed care or other insurance reasons, or for lateral levels of care), we are confident that all patients transferred were for HLOC. The time period examined was chosen such that all 570 patients’ billing and reimbursement activities were complete, with accurate information regarding charges and reimbursement. Through these mechanisms, we are confident that we captured all HLOC transfer to the institution during this time period.
Each specialty department’s centralized professional fee billing office used the list of patients, dates of birth, date of arrival and medical record numbers to provide admission service, length of stay, principle diagnosis, procedures performed, primary payer (insurance profile), charges, relative value unit (RVU) and reimbursement data. Data were entered and analyzed with purely descriptive statistics with Excel (version 12.3.0, Microsoft, Redmond, WA). We determined total patients, RVUs and charges and reimbursement by specialty. We calculated charges, reimbursement, and RVUs per patient. In order to compare to national benchmarks, we calculated reimbursement per RVU and average percent of Resource-Based Relative Value Scale (RBRVS) for all patients within each specialty.
National benchmarks for reimbursement per RVU were calculated from the 2006 Medical Group Management Association (MGMA) Compensation and Production Survey.8 Since an RVU in 2007 was reimbursed according to RBRVS at $38.0870, if the account were paid this, we considered that reimbursement to be 100% of RBRVS. Therefore, we calculated percent of RBRVS by specialty by dividing the reimbursement per RVU by $38.0870.9
If reimbursement per RVU for HLOC transfers were found to be low compared to national benchmark, this could be explained by genuine poor reimbursement for HLOC transfers, or by global or specialty-specific low reimbursement specific to our institution alone. To determine which of these was the case, we compared each specialty’s payer mix from this study site (reimbursement per RVU) with national benchmarks. The study was approved by the local Institutional Review Board.
RESULTS
We present our reimbursement data comparisons for HLOC patients in 4 ways.
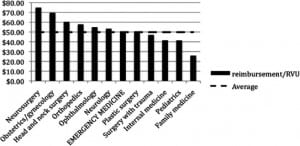
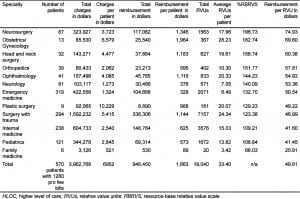
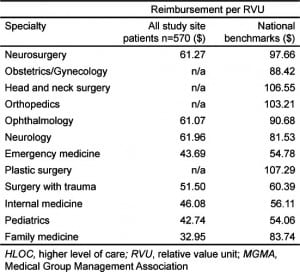
- Reimbursement per RVU for each group of HLOC patients by specialty (n=12) (Table 1, Figure 2).
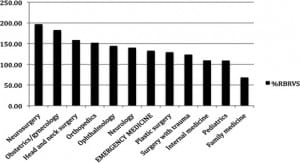
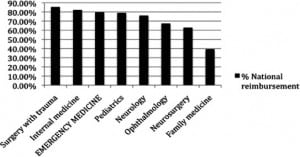
- Percent RBRVS reimbursement for HLOC patients by specialty (n=12) (Figure 3).
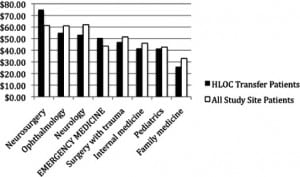
- Reimbursement per RVU for HLOC patients compared to all of this tertiary center’s patients by specialty (n=8) (Figure 4).
- Reimbursement per RVU for HLOC patients by specialty (n=12) compared to national benchmarks and all of each specialty’s patients at this study site (Figure 5).
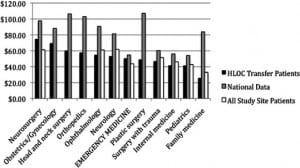
Finally, to isolate the potential effect of HLOC status alone vs. overall payer mix of our tertiary care center, we present reimbursement per RVU for this study site (not only HLOC patients) vs. national benchmarks (Figure 6).
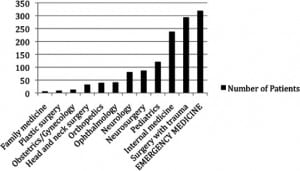
In this period 576 patients were transferred, or 1.6 per day. The number of patients per specialty ranged from a low of 6 for family medicine to a high of 319 for emergency medicine (EM) (Figure 1). The remaining 251 patients were transferred directly to an inpatient unit, and so did not trigger any ED charges. Total RVUs for all patients at the receiving center were 19,040, or 33.40 RVU per patient. RVU per patient varied from a low of 3.42 for family medicine to a high of 28.23 for obstetrics/gynecology (Table 1) (e.g. normal spontaneous vaginal delivery= 26.80 work RVU). EM had 6.49 RVU per patient (e.g. evaluation and management code level 5= 3.80 RVU).10
Total reimbursement from all payers (government, private and self-pay) was $948,450 (Table 1). Reimbursement per RVU varied from a high of $74.93 for neurosurgery to $25.91 for family medicine (Table 1, Figure 2). The average reimbursement per RVU for all HLOC transfer patients was $49.81. Five of the 6 specialties shown by hospital surveys to have the most trouble maintaining call panels (neurosurgery, head and neck surgery, orthopedics, ophthalmology, and plastic surgery) had higher-than-average reimbursement per RVU compared to other specialties. The sixth, plastic surgery, had lower-than-average reimbursement per RVU.1,2
We also compared specialties using the 2007 RBRVS as determined by Centers for Medicare and Medicaid Services (CMS). The percent RBRVS ranged from a high of 197% for neurosurgery to 68% for family medicine. Percent RBRVS for EM was 132.7% (Table 1, Figure 3).
Not all specialties at this tertiary center had billing data available for reimbursements per RVU for all of that specialty’s patients during the same time period. Head and neck surgery, obstetrics, orthopedics, and plastic surgery were unavailable from the billing group.
Looking more closely at the individual specialties, EM had $50.54 reimbursement per RVU for their HLOC transfer patients (Table 1, Figure 2). Reimbursement to EM for transferred patients was 16% above the average reimbursement per RVU for all ED patients for the period (Figure 4). Compared to national data from the 2006 MGMA survey, reimbursement to EM for transferred patients was 8% below the national EM average (Figure 5).
For the most problematic specialties, neurosurgery transferred-patient reimbursement per RVU was 24 % above the average patient reimbursement per RVU for all neurosurgery patients at this center ($75.93 vs. $61.27 per RVU) for the period (Table 1 and and2,2, Figure 4). However, compared to national data, reimbursement per RVU at this center was 22% lower ($97.66 nationally) (Figure 5).
The remainder of specialties were reimbursed less per RVU for HLOC patients than for all of their patients at this center (Figure 4). The largest loss was seen in family medicine patients. For surgery with trauma (the second highest volume specialty for HLOC transfers after EM), reimbursement per RVU was 8.9% less than for all Level I Trauma Center patients combined (Table 1 and and2,2, Figure 4).
Compared to the national average, this study site had an overall lower reimbursement per RVU for all specialties. This demonstrates that this study site likely has a lower payer mix than national average, leading to lower reimbursements per RVU (Figure 5).
Figure 6 is a graphical representation of this tertiary center’s overall reimbursement by specialty (not just HLOC patients) vs. the national benchmark. This illustrates the degree to which average reimbursement at our center lags behind national norms.
DISCUSSION
According to a recent national survey, maintaining on-call specialist panels has become an increasing problem nationwide, with 74% of ED directors reporting problems.5 Between 2000 and 2006, surveys of California EPs indicate increasing problems obtaining timely specialist care for 9 of 20 specialties (mostly surgical), and that the number of specialty call panels for community hospitals is, on average, declining. Community practitioners who care for underserved populations reported the most problems.1,2
Although we obtained billing data for 12 specialties, including internal medicine, pediatrics and family medicine, the HLOC service required of the transfer was most often a surgical subspecialty. Furthermore, the 41 ophthalmology patients in our system were admitted to internal medicine or pediatrics. Consequently, the most common services required for HLOC transfers were surgery with trauma (including burns) at 52% (294/570), neurosurgery 15% (87/570) and neurology 14% (81/570). This in turn reflects our tertiary center’s status as an American College of Surgeons Level I Trauma Center, and The Joint Commission-certified Primary Stroke Center. The next most common groups of patients were ophthalmology, orthopedics and head and neck surgery (at 6–8% each).
At our tertiary care center, specialties that hospital surveys indicate have the most trouble maintaining call panels (neurosurgery, otolaryngology, orthopedics, and ophthalmology), paradoxically had higher-than-average reimbursement per RVU compared to other specialty’s higher level of care patients. Plastic surgery had lower-than-average reimbursements per RVU, but this is likely inconclusive with only nine HLOC patients (Figure 2, Table 1).
For specialties with complete reimbursement data (n=8), average professional fee reimbursement for HLOC patients was higher than all-patient reimbursement rates only for EM and neurosurgery. Of the other problematic surgical subspecialties (head and neck surgery, orthopedics and ophthalmology), HLOC transfer reimbursement was lower for ophthalmology, but unavailable for the other 2. This implies that neurosurgery and EM may benefit from accepting HLOC patients, but not ophthalmology. At our center 319/570 (56%) patients arrived through the ED, and though they may contribute to crowding and flow problems, these patients appear to reimburse better than the average ED patient (Figure 4, Table 1 and and22).
For HLOC transfer patients, all specialties studied at this center (n=12) had lower reimbursement per RVU than national benchmarks [$49.81 vs. $65.62 (weighted average of national RVU/patient reimbursements proportional to the number of HLOC transfers by specialty in this data set)]. Therefore, our site had substantially lower reimbursements compared to the national data, likely a reflection of our challenging payer mix as an academic institution. Previous studies have found that receiving hospitals have a poorer payer mix than transferring hospitals, which in turn shifts the burden for care of these patients from the private to public/academic sector.6
While the hospital realized $2,586,200 in profit from these 570 patients, the total professional fee reimbursement was $948,450, or $1,663 per patient.7 We have no way of calculating professional costs to care for these patients, so cannot comment on physician “profit,” but reimbursement per RVU was $49.81, or 131% of RBRVS. Some specialties may consider this attractive, while others not. From an ED perspective, HLOC transfers generate 133% of RBRVS compared with 115% for all other patients, and are therefore economically advantageous at this site. Couple this with the obvious patient need for special expertise in the tertiary center, as well as provision of patient material to support training and procedural needs, and these HLOC transfers should be viewed as desirable.
LIMITATIONS
We acknowledge several limitations and recommend further study. Billing data were unavailable at our center for some of the specialties we were most interested in, including orthopedics, head and neck surgery, and plastic surgery. These are specialties often cited by EPs as the most problematic for obtaining consultation, admission, or follow-up care.
Also, the number of HLOC patients for some specialties was low, and comparison to national data and to all of our tertiary care patients for that specialty is inexact (eg. plastic surgery and family medicine).
We used 2006 MGMA national benchmark data for 2007–2008 patients, as this was the latest available at the time of data analysis.
We believe this is a consecutive patient sample, but acknowledge that some transfers may have occurred that were not discovered in our screening process. Conversely, some revenue could have been lost due to inaccurate billing practices in our centralized university billing center.
Finally our data would not be generalizable to other tertiary care centers with varied HLOC transfer patient proportions by specialty, differing payer mixes, billing efficiencies, and direct admission practices.
CONCLUSION
Higher-level-of-care transfers (HLOC) to one tertiary center were found to be economically disadvantageous overall, but reimbursement varied widely among specialties. Neurosurgery and EM were reimbursed better for HLOC transfers than for all of the other patients in these specialties at this site, but HLOC transfer-patient reimbursement was worse than national benchmarks for all services. This reflects a poorer patient mix at this site than nationally. Whether the teaching and procedural value of these patients compensate for financial liability is a matter of institutional purpose and professional priority.
Footnotes
Supervising Section Editor: Erik D. Barton, MD, MBA
Submission history: Submitted October 4, 2011; Revisions received October 5, 2012; Accepted December 7, 2011
Full text available through open access at http://escholarship.org/uc/uciem_westjem
DOI: 10.5811/westjem.2011.10.6906
Address for Correspondence: Mark I. Langdorf, MD, MHPE, University of California Irvine Medical Center, Department of Emergency Medicine, 101 The City Drive South, Orange, CA 92868. Email: milangdo@uci.edu.
Conflicts of Interest: By the WestJEM article submission agreement, all authors are required to disclose all affiliations, funding sources, and financial or management relationships that could be perceived as potential sources of bias. The authors disclosed none.
REFERENCES
1. Rudkin SE, Landorf MI, Oman JA. The worsening of ED on-call coverage in California: 6 year trend.Am J of Emerg Med. 2009;27:785–791. et al. [PubMed]
2. Rudkin SE, Oman JA, Langdorf MI. The state of ED on-call coverage in California. Am Journ Emer Med. 2004;22:575–81. et al. [PubMed]
3. Madigan N. Los Angeles Emergency Care Crisis Deepens. New York Times; New York, NY: Aug 21, 2004.
4. Institute of Medicine: committee on the future of emergency care in the United States health system.Hospital-based Emergency Care at the Breaking Point. Washington DC: The National Academies Press; 2006.
5. Rao MB, Lerro C, Gross CP. The Shortage of On-call Surgical Specialist Coverage: A National Survey of Emergency Department Directors. Acad Emerg Med. 2010;17:1374–1382. [PubMed]
6. Menchine M, Baraff LJ. On-call Specialists and Higher Level of Care Transfers in California Emergency Departments. Acad Emerg Med. 2008;15:329–336. [PubMed]
7. Amr O, Menchine M. Financial Implications for Facilities Receiving Higher Level of Care Transfers.In Press.
8. MGMA Physician Compensation and Production Survey: 2006 Report.
9. “The RBRVS and the AMA Specialty Society RVS Update Committee (RUC) Process,” AMA 2008. Available at: http://reimbursement.atwiki.com/file/open/67/RUC_Process_2008.pdf. Accessed June 28, 2011.
10. Centers for Medicare & Medicaid Services. Available at http://www.cms.gov/apps/physician-fee-schedule/search/search-criteria.aspx. Accessed July 22, 2011.


