
| Author | Affiliation |
|---|---|
| Knox H. Todd, MD, MPH | Pain and Emergency Medicine Institute, Beth Israel Medical Center, New York, NY |
| Penney Cowan | American Chronic Pain Association, Pittsburgh, PA |
| Nicole Kelly | American Chronic Pain Association, Pittsburgh, PA |
| Peter Homel, PhD | Department of Pain Medicine and Palliative Care, Beth Israel Medical Center, New York, NY |
ABSTRACT
Introduction:
Persons with chronic or recurrent pain frequently visit the emergency department (ED), yet little research examines this experience. We conducted this national survey to assess patients’ ED experiences.
Methods:
We developed and conducted a ten-minute telephone survey using random digit dial methodology. We included adults with chronic or recurrent pain reporting an ED visit within two years.
Results:
We interviewed 500 adults. Sixty percent were female, their median age was 54, two-thirds were under a physician’s care, and 14% were uninsured. They reported an average of 4.2 ED visits within the past two years. Almost one-half reported “complete” or “a great deal” of pain relief during the ED visit, while 78% endorsed as “somewhat or definitely true” that “the ED staff understood how to treat my pain.” Although over three-fourths of patients felt that receiving additional information on pain management or referrals to specialists was “extremely” or “very” important, only one-half reported receiving such referrals or information. A significant minority (11%) reported that the “ED staff made me feel like I was just seeking drugs.” The majority (76%) were “somewhat” to “completely satisfied” with their treatment while 24% were “neutral” to “completely dissatisfied”. In multivariate models, age, recurrent pain, waiting time, imaging, receiving analgesics and pain relief predicted patient satisfaction.
Conclusion:
Although those with chronic or recurrent pain report relatively high satisfaction with the ED, our findings suggests that specific areas, such as unmet needs for information and specialty referral, might be targeted to improve care.
INTRODUCTION
Chronic pain is common, with a prevalence of approximately 20% in the general population and is associated with frequent physician visits.1–3 The reported prevalence of any pain among those visiting the emergency department (ED) is as high as 78%, and in a recent multicenter study, underlying chronic pain conditions were reported by 40% of all ED patients who presented with pain.4–7 For one-half of these, an exacerbation of chronic pain was the proximal cause for the ED visit and those with chronic pain reported lower satisfaction with ED pain management than those presenting with acute pain.7
In 2006, to better understand the ED experiences of persons with chronic pain, the American Chronic Pain Association (ACPA) conducted a preliminary on-line survey among visitors to their website with chronic pain who had been treated in an ED within the past year. Of 250 respondents, 44% reported three or more ED visits within the past year, most commonly for pain that was out of control. Forty-four percent of respondents felt they were treated with dignity and respect by ED staff and only 22% were satisfied with their treatment. In terms of pain management, 47% rated their ED visit as “poor,” “terrible,” or “the worst experience of my life.”8 While this survey had a number of limitations and did not attempt to recruit a representative sample of those with chronic pain, it suggested a mismatch between patient expectations and the ED treatment of chronic pain.
To more completely explore the problem of chronic pain and the ED, in March 2007 the ACPA employed Public Opinion Strategies, a national polling firm, to conduct a random digit dial telephone survey of Americans with chronic or recurrent pain treated in an ED within the past two years. The goal of this study was to characterize the ED experiences of a statistically valid, representative sample of the United States (U.S.) population suffering from chronic or recurrent pain.
METHODS
Survey Development
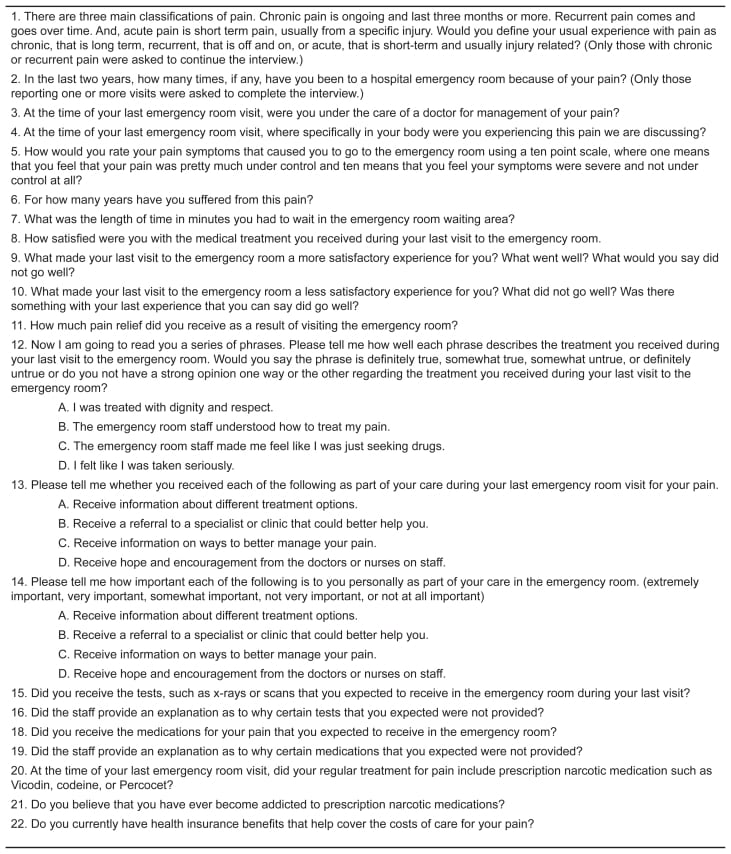
The survey instrument was developed with input from a panel of experts in pain medicine and emergency medicine, as well as representatives from chronic pain consumer groups. Survey items were adapted from the 2006 ACPA online survey, as well as previously conducted national pain surveys.8–9 Items were chosen to assess features of the underlying pain condition, healthcare use, perceptions of the ED experience and respondent demographics. Panel members reviewed six successive revisions of the survey instrument, and after piloting in an initial thirty respondents, it was shortened to a length of ten minutes. Survey questions are shown in Figure 1.
Survey Methods and Sampling Design
We employed a national polling firm to conduct the survey using random digit dial methodology. In this process, a sample of telephone households in the continental U.S. is selected via random digit dialing (RDD) procedures, in which all telephone numbers, listed and unlisted, have an equal probability of selection. RDD samples are produced from a sampling frame that included all active telephone area codes and exchanges. Active blocks (contiguous groups of 100 phone numbers for which more than one residential number is listed) are added to the database, and listed business numbers are removed. The listed database is updated on a four- to six-week rolling basis, 25% of listings at a time, and the file of business numbers is updated quarterly.
Each telephone exchange is assigned to the county where it is most prevalent. In the first stage of selection, the database is sorted by state and county, and the number of telephone numbers to be sampled within each county is determined using systematic sampling procedures from a random start, such that each county is assigned a sample size proportional to its share of possible numbers. In the second stage of selection, telephone numbers are sorted within county by area code, exchange and active block, and using systematic sampling procedures from a random start, individual phone numbers within each county are selected. The sampled phone numbers are pre-dialed via a non-ringing auto-dialer to reduce dialing of non-working numbers.
Interviewers asked if the respondent was 18 years or older and if not then the respondent asked to speak to someone in the household 18 years or older. Respondents were then screened for type of pain (acute, recurrent or chronic) and their history of ED visits. Those with a history of chronic or recurrent pain who reported an ED visit within the past two years were included. All respondents were guaranteed anonymity. The survey was conducted over five days in March 2007.
Weighting
Final data were weighted using demographic information from the U.S. Census to adjust for sampling and non-sampling deviations from population values. Respondents were classified by age, race, sex and education. Weights were assigned to each combination of factors based on the corresponding population proportions according to the Census Bureau’s most recent Current Population Survey.
Statistical Analysis
We carried out all analyses using the survey procedures in SAS 9.1 (SAS Institute, Cary, NC). These allow for appropriate weighting of responses obtained under complex survey designs. The survey has an overall margin of error of ± 4.38%. We analyzed descriptive data using PROC Surveyfreq and PROC Surveymeans. Frequencies and percentages are reported in terms of weighted results rounded off to the nearest integer. We performed between-group comparison of categorical outcomes (e.g., taking prescription opioids) using a weighted chi square statistic, while comparison of wait times in the ED was carried out using a weighted Mann-Whitney test. We used PROC Surveylogistic to calculate univariate odds ratios (OR) for predictors of satisfaction along with 95 % confidence limits (95 % CI) and significance levels. Satisfaction was defined as being “somewhat”, “very”, or “completely” satisfied with treatment received in ED. We created a multivariate logistic model with fixed entry of predictors to determine whether each factor remained significant after controlling for all other factors. A univariate p-value of 0.10 was necessary for inclusion in the multivariate model. We also included gender (female) and being white because they constituted potential confounding factors.
RESULTS
The telephone survey was conducted in on March 2007, and involved 148,451 attempted phone calls. Nearly one-third (31%) of the calls resulted in no answers and these numbers were redialed up to six times. In addition, another 31% of the calls were picked up by answering machines and these numbers were also dialed again up to six times. Ten percent of those reached by phone refused to participate in the survey. The remaining respondents were asked to characterize their histories of pain as acute, recurrent or chronic and to report the number of ED visits they had made within the past two years. Those characterizing their pain as either chronic (“ongoing and lasting three months or more”) or recurrent (“comes and goes over time”), who reported at least one ED visit within the past two years, were invited to complete the ten-minute survey.
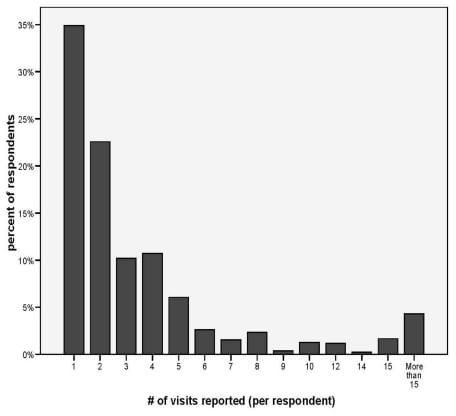
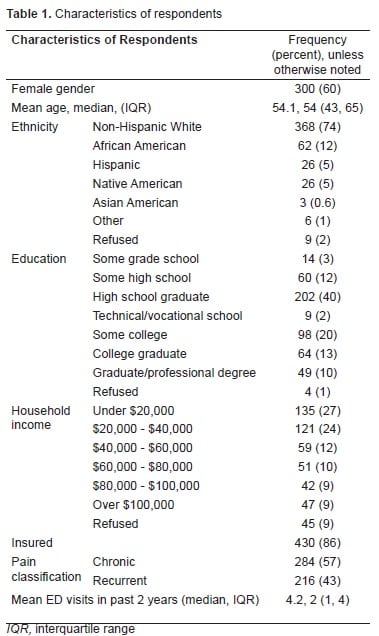
The 500 respondents who met both pain and ED visit criteria constituted 15.34% of those who were reached by phone and agreed to the interview. Respondents’ ages ranged from 19 to 95 years with mean and median ages of 54 years. Sixty percent were female, 74% were non-Hispanic whites, and 45% received education beyond the high school graduate level. Fourteen percent were uninsured, mirroring the rate for the underlying U.S. population. Chronic pain was reported by 284 (57%) and recurrent pain by 216 (43%), with a median symptom duration of four years (mean 7.9 years, range 1–40 years). The group reported a median of two ED visits within the past two years (mean 4.2). [Table 1 and Figure 2]. Recurrent and chronic pain patients did not differ from each other significantly with regard to any background characteristic with the exception of number of ED visits with chronic patients reporting a mean, median (IQR [interquartile range]) of 5.3,2 (1, 5) visits compared to 2.6, 2 (1, 3) for recurrent pain patients (p < 0.001).
At the time of their most recent ED visit, 67% of respondents were under the care of a physician and 40% were regularly taking prescription opioids. Although the term “addiction” was not explicitly defined during the interview, 5% of respondents reported that they “believed that they had become addicted to prescription narcotic medications” at some time in the past. (Table 2)
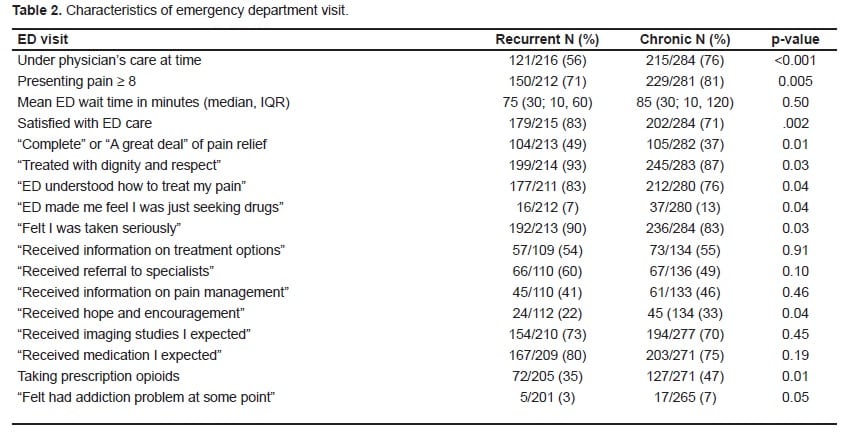
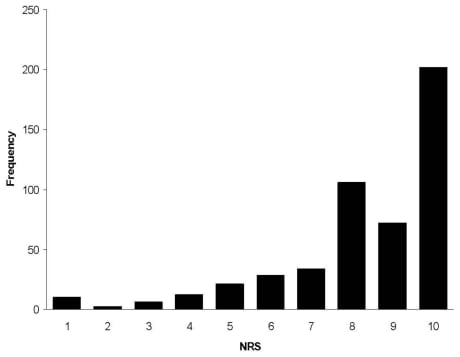
Respondents reported high levels of pain intensity on arrival to the ED, with a median presenting pain score of 9 on an 11-point Numerical Rating Scale (NRS), with 77% reporting severe pain (NRS 8–10). In comparison to national data, their perceived waiting times were surprisingly short (41% < 30 minutes). Given the chronic nature of their pain syndromes, relatively large proportions of respondents reported pain relief during the ED visit, with 42% of respondents reporting either “complete” (18%) or “a great deal” (24%) of pain relief. Seventy-eight percent of respondents endorsed as “somewhat or definitely true” that “the ED staff understood how to treat my pain.”
Although over three-fourths of patients felt receiving that additional information on pain management (83%) or referrals to specialists (75%) was “extremely” or “very” important, only one-half reported receiving such referrals (44%) or information (54%). A minority of respondents (11%) reported that the “ED staff made me feel like I was just seeking drugs.”
Respondents with chronic pain differed in many ways from those with recurrent pain. Respondents with chronic pain were more likely to be under a physician’s care (76% versus 57%, p < 0.001), present with severe (NRS 8–10) pain (81% versus 71%, p = 0.005), take regular prescription opioids (47% versus 35%, p = 0.01), report feeling they had experienced an addiction problem at some point (7% versus 3%, p = 0.05), that the ED provided hope and encouragement (33% versus 22%, p = 0.04), and that the ED staff suspected they were drug seeking (13% versus 7%, p = 0.04). Those with chronic pain were less likely to report complete or a great deal of pain relief (37% versus 49%, p = 0.01), being treated with dignity and respect (87% versus 93%, p = 0.03), being taken seriously (83% versus 90%, p = 0.03), and feeling that the ED understood how to treat their pain (76% versus 83%, p = 0.04).
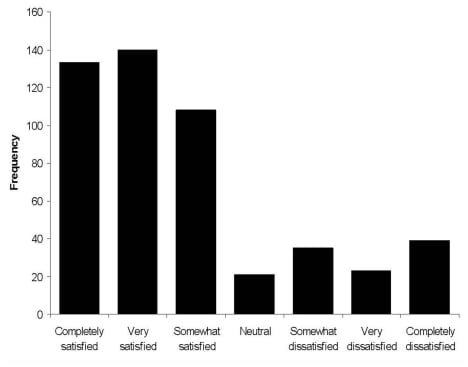
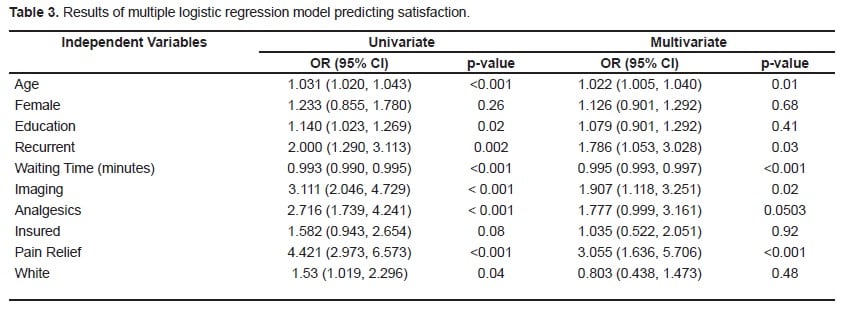
The majority of respondents (76%) was either “somewhat”, “very” or “completely” satisfied with their medical treatment, while 24% were “neutral” to “completely” dissatisfied. In univariate analyses with satisfaction as the dichotomous outcome, the following factors were associated with satisfaction: older age (OR = 1.03, p < 0.001), higher education (OR = 1.13, p = 0.10), recurrent pain (OR = 2.00, p = 0.002), shorter waiting times (OR = 0.99, p < 0.001), increasing pain relief (OR = 5.15, p < 0.001), undergoing imaging tests (OR = 3.38, p < 0.001), receiving ED analgesics (OR = 3.44, p < 0.001), and having insurance (OR = 1.85, p = 0.03). Gender (female) and being white were not significantly associated with satisfaction based on univariate analyses: OR = 0.96, p = 0.87; OR = 1.13, p = 0.61, respectively.
Using fixed entry, we included all of the covariates listed above along with gender and being white, as covariates in a multivariate logistic regression model with satisfaction again as the dichotomous outcome variable. The following factors showed a statistically significant contribution to the model (p ≤ 0.10): age (OR = 1.02, p = 0.02), recurrent pain (OR = 1.79, p = 0.03), waiting time in minutes (OR = 0.99, p < 0.001), undergoing imaging studies (OR = 1.91, p = 0.02), receiving analgesics (OR = 1.78, p = 0.0503), and pain relief (OR = 3.06, p < 0.001). The minimum p-value for all other predictors was 0.41.
DISCUSSION
Although most agree that ED use for those with chronic pain, like any chronic disease, is relatively high, this survey allows us to more precisely estimate the prevalence of ED use associated with chronic and recurrent pain. Given the U.S. adult population of approximately 225 million, our finding that 15% of those reached by phone met our inclusion criteria suggests that 34 million adults with chronic or recurrent pain make at least one visit to the ED every two years. Within this population, approximately 43%, or 15 million, experience recurrent pain, while 57%, or 19 million, have underlying chronic pain syndromes.
These estimates are roughly similar to calculations of ED use based on extrapolations from single site and multicenter studies. In 2005, U.S. EDs received 115.3 million total visits annually, with approximately 86.5 million visits by adults.12 From single site studies it is estimated that pain prompts approximately 70% of ED visits.4–6 A recent multicenter study found that underlying chronic pain conditions existed in 40% of ED patients presenting with pain (or 28% of all ED patients) and for one-half of these (or 14% of all ED patients), the ED visit resulted from an exacerbation of this chronic pain condition.7 These data suggest that 24 million ED visits occur annually among adults with chronic pain, while 12 million adult visits are due to exacerbations of chronic pain syndromes.
It is often suggested that ED use results from lack of insurance or poor access to primary care. In fact, most of our respondents had access to primary care, and the proportion of uninsured within our sample was similar to that of the general population. The age, gender and ethnicity distributions within our sample are also consistent with those of the chronic pain population. Our finding that more than three-quarters of respondents reported severe pain on presentation implies that ED visits are prompted by disease severity rather than other factors.
In contrast to the high levels of dissatisfaction found in our 2006 ACPA online survey, our respondents reported relatively high levels of satisfaction, associated with surprisingly high levels of reported pain relief, particularly when considering the chronic nature of our respondents’ pain. 8These findings highlight the recognized limitations of our previous on-line survey (i.e., only visitors to the ACPA website were invited to participate), and the importance of obtaining less biased sources of information when judging the quality of ED pain care.
Younger patients reported less satisfaction with ED pain care, and were more likely than older respondents to perceive that the ED staff considered them “drug seekers” while older patients were more likely to self-report fears of addiction. This may reflect both higher levels of social desirability bias in the responses of older patients, as well as a higher prevalence of aberrant drug-related behaviors among younger patients. Social desirability bias means that when patients know that they are being observed, they tend to respond in a way they believe is socially acceptable and desirable. In general we feel that this bias would foster responses that are more favorable toward ED providers, and we suspect it is more likely to be present among older respondents.
Our finding of relatively high satisfaction levels is consistent with several national surveys among those with chronic pain. In a 2003 random-digit-dial survey among 1,004 adults with chronic pain, 58% stated that they were “somewhat satisfied” or “very satisfied” with their pain treatment.10 In a 2004 national telephone survey conducted by Roper Public Affairs and Media on behalf of the ACPA, 70% of adults experiencing chronic pain indicated that they were “satisfied” (43%) or “very satisfied” with their pain management.11 Finally, in the 2005 ABC News/USA Today survey among 1,204 adults with chronic or recurrent pain, 59% indicated they received a “great deal” or “good amount” of pain relief as a result of seeing a physician.9 It is difficult to make direct comparisons between the surveys cited above and our survey as they use different populations and samples; however, respondents tended to report relatively high levels of satisfaction with pain treatment.
The receipt of imaging studies was an independent predictor of satisfaction, although the contribution of such studies to patient well-being is likely to be small, particularly given the frequency of ED visits and the long duration of our respondents’ pain syndromes. This suggests that both the ED staff and those with chronic pain may benefit from additional education efforts regarding the appropriate indications for imaging studies in the ED setting.
Although unrelated to satisfaction, over three-fourths of our respondents felt they needed additional information about their pain condition and considered referral to specialty-level pain care very important. Unfortunately, only one-half perceived that they had received sufficient information or referral, and this finding supports the need for increased education among ED staff and those with chronic pain, as well as improvements in access to pain medicine expertise.
LIMITATIONS
Limitations to our study should be mentioned. Retrospective judgments of pain intensity and waiting times are always difficult and our respondents’ perceptions may be influenced by a number of factors, including overall satisfaction with care. Also, our survey shares the weaknesses of other telephone surveys, including an increasing level of difficulty in reaching potential respondents, in part due to the rise in use of answering machines and caller-identification information. These challenges are balanced by the cost-effectiveness and efficiencies of telephone surveys methods. In addition, our survey instrument, although modeled on prior surveys tools, has not been formally validated. It was developed by a panel of experts in pain medicine and emergency medicine, as well as representatives from chronic pain consumer groups, thus should have face validity. We have provided the survey questions themselves to allow others to judge their appropriateness.
CONCLUSION
The most positive news from this survey is that people with chronic pain who come to the ED seeking relief from severe pain generally receive rapid and effective care. The more negative findings indicate these patients appear to be frustrated by a lack of information about managing their pain, as well as a lack of access to specialty-level care. Although ED staffs are perceived to provide compassionate care to this rather large population, managing chronic or recurrent pain over a long period requires much more than an ED can offer. In the current healthcare environment EDs are under tremendous pressure to treat growing numbers of patients with fewer and fewer resources. Although the ED is to be commended for efforts to treat those in the midst of a pain crisis, persons with chronic pain need support beyond the hospital’s walls.
Footnotes
This project was supported by the American Chronic Pain Association through an unrestricted grant from Cephalon, Inc.
Supervising Section Editor: Jeffrey Druck, MD
Submission history: Submitted October 28, 2009; Revision Received January 19, 2010; Accepted February 10, 2010
Full text available through open access at http://escholarship.org/uc/uciem_westjem
Address for Correspondence: Knox H. Todd, MD, MPH, Director, Pain and Emergency Medicine Institute, Beth Israel Medical Center, First Avenue at 16th Street, New York, NY 10003
Email: ktodd@bethisraelny.org
Conflicts of Interest: By the WestJEM article submission agreement, all authors are required to disclose all affiliations, funding sources, and financial or management relationships that could be perceived as potential sources of bias. The authors disclosed none.
REFERENCES
1. Blyth FM, March LM, Brnabic AJ, et al. Chronic pain in Australia: a prevalence study. Pain.2001;89:127–34. [PubMed]
2. Breivik H, Collett B, Ventafridda V, et al. Survey of chronic pain in Europe: prevalence, impact on daily life, and treatment. Eur J Pain. 2006;10:287–333. [PubMed]
3. Eriksen J, Jensen MK, Sjogren P, et al. Epidemiology of chronic non-malignant pain in Denmark.Pain. 2003;106:221–8. [PubMed]
4. Cordell WH, Keene KK, Giles BK, et al. The high prevalence of pain in emergency medical care. Am J Emerg Med. 2002;20:165–9. [PubMed]
5. Johnston CC, Gagnon AJ, Fullerton L, et al. One-week survey of pain intensity on admission to and discharge from the emergency department: A pilot study. J Emerg Med. 1998;16:377–82. [PubMed]
6. Tanabe P, Buschmann M. A prospective study of ED pain management practices and the patient’s perspective. J Emerg Nurs. 1999;25:171–7. [PubMed]
7. Neighbor ML, Puntillo KA, Homel P, et al. Chronic pain in the emergency department. Acad Emerg Med. 2007;14(Suppl):S112.
8. Todd K, Cowan P, Kelly N. Pain in the emergency department: an online survey of patient experience. J Pain. 2006;7(Suppl):S61.
9. ABC News/USA Today/Stanford University Medical Center. 2005. [Accessed 7/29/2009]. Available at: http://abcnews.go.com/Health/PainManagement/story?id=732395.
10. Americans Talk About Pain: A Survey Among Adults Nationwide Conducted for Research!America. Peter D. Hart Research Associates; Aug, 2003. [Accessed 7/27/09]. Available at:http://www.researchamerica.org/uploads/poll2003pain.pdf.
11. Americans Living With Pain Survey. Roper Public Affairs & Media; Apr, 2004. [Accessed 7/27/2009]. Available at:http://www.theacpa.org/documents/FINAL%20PAIN%20SURVEY%20RESULTS%20REPORT.pdf.
12. Nawar EW, Niska RW, Xu J. National Hospital Ambulatory Medical Care Survey: 2005 emergency department summary. Advance Data. 2007;386:1–32. http://www.ncbi.nlm.nih.gov/sites/entrez.[PubMed]