
| Author | Affiliation |
|---|---|
| Namkee G. Choi, PhD | The University of Texas at Austin, School of Social Work, Austin, Texas |
| C. Nate Nathan Marti, PhD | The University of Texas at Austin, School of Social Work, Austin, Texas |
| Diana M. DiNitto, PhD | The University of Texas at Austin, School of Social Work, Austin, Texas |
| Bryan Y. Choi, MD, MPH | Brown University, Department of Emergency Medicine, Providence, Rhode Island |
Introduction
Methods
Results
Discussion
Limitations
Conclusion
ABSTRACT
Introduction
Late middle-aged and older adults’ share of emergency department (ED) visits is increasing more than other age groups. ED visits by individuals with substance-related problems are also increasing. This paper was intended to identify subgroups of individuals aged 50+ by their risk for ED visits by examining their health/mental health status and alcohol use patterns.
Methods
Data came from the 2013 National Health Interview Survey’s Sample Adult file (n=15,713). Following descriptive analysis of sample characteristics by alcohol use patterns, latent class analysis (LCA) modeling was fit using alcohol use pattern (lifetime abstainers, ex-drinkers, current infrequent/light/moderate drinkers, and current heavy drinkers), chronic health and mental health status, and past-year ED visits as indicators.
Results
LCA identified a four-class model. All members of Class 1 (35% of the sample; lowest-risk group) were infrequent/light/moderate drinkers and exhibited the lowest probabilities of chronic health/mental health problems; Class 2 (21%; low-risk group) consisted entirely of lifetime abstainers and, despite being the oldest group, exhibited low probabilities of health/mental health problems; Class 3 (37%; moderate-risk group) was evenly divided between ex-drinkers and heavy drinkers; and Class 4 (7%; high-risk group) included all four groups of drinkers but more ex-drinkers. In addition, Class 4 had the highest probabilities of chronic health/mental problems, unhealthy behaviors, and repeat ED visits, with the highest proportion of Blacks and the lowest proportions of college graduates and employed persons, indicating significant roles of these risk factors.
Conclusion
Alcohol nonuse/use (and quantity of use) and chronic health conditions are significant contributors to varying levels of ED visit risk. Clinicians need to help heavy-drinking older adults reduce unhealthy alcohol consumption and help both heavy drinkers and ex-drinkers improve chronic illnesses self-management.
INTRODUCTION
Older adults (65+ years of age) consistently account for the largest proportion of emergency department (ED) visits/repeat visits, and they are expected to become an even larger presence in the ED when the “baby boomers” swell the ranks of older adults.1-4 Between 2006 and 2011, older adults’ ED visits increased by 2.3%, and visits by the 45–64 age group increased by 8.3%,5 signaling a steep increase in visits by older adults in the coming years. Data also show that ED visits by individuals with substance use disorders have been increasing (a 34% increase for alcohol-related disorders and 48% increase for other substance-related disorders between 2006 and 2011).5 Given that the boomers have had higher rates of substance use/misuse than their predecessors,6,7 the growing numbers of older adults who use/misuse substances are likely to crowd EDs, requiring the examination of substance use/misuse’s impacts on ED visits by late middle-aged and older adults. Using nationally representative data on individual health status and healthcare utilization, this study sought to identify subgroups of individuals aged 50+ for their ED visit risk based on alcohol use patterns, chronic health and mental health conditions, and previous ED visits.
People aged 50+ have lower rates of heavy alcohol use and alcohol abuse/dependence than younger adults, because both alcohol use and drinking quantity tend to decline with age and increasing chronic disease burden.8-13 However, even low-to-moderate alcohol use in late life can predispose older adults to adverse health outcomes, as aging- and disease-related physiological changes (e.g., smaller body mass and lower total body water content) lead to higher and longer-lasting blood alcohol content and neurotoxicity in older than in younger adults.14,15 Despite general findings of the beneficial health effects of low-to-moderate drinking, the overall net effect of alcohol consumption on health outcomes is detrimental, owing to the negative effect on cancers; infectious disease; cardiovascular, hepatic, endocrine, and gastrointestinal diseases; neuropsychiatric disease including alcohol-use disorders; and intentional and unintentional injuries.16-19
Epidemiologic data from the 2008–2012 National Survey on Drug Use and Health (NSDUH) showed that 11% of the 50–64 age group and 20% of the 65+ age group were lifetime abstainers, and 21% of the 50–64 age group and 28% of the 65+ age group were ex-drinkers (i.e., did not use alcohol in the preceding 12 months).20 Compared to lifetime abstainers and current drinkers, ex-drinkers have been found to have more physical and mental health problems and are likely to include “sick quitters” who stopped drinking heavily due to health problems that are caused by or deteriorated because of long-term alcohol use.21,22
In reality, a substantial proportion of those aged 50+, with or without chronic medical conditions, continue to engage in at-risk/harmful/hazardous drinking. The 2013 NSDUH show that 23% of the 50–54 years old, 16% of the 55–59 years old, 14% of the 60–64 years old, and 9% of the 65+ years old were binge (but not heavy) alcohol users (i.e., defined as 5+ drinks on the same occasion on at least 1 day in the past 30 days ); and 6%, 4%, 5%, and 2% in each respective group were heavy users (5+ drinks on the same occasion on each of 5 or more days in the past 30 days).8 A study based on the 2005–2007 NSDUH data also found that among alcohol users, 20% of those aged 50–64 and 15% of those aged 65+ endorsed alcohol abuse or dependence symptoms.23 Another study, based on the 2005–2008 National Health and Nutrition Examination Survey data and using the alcohol-related risk assessment algorithm, also found that in the context of their medical problems, functional status, and other health risks, 37% of drinkers aged 65+ were classified as engaging in harmful consumption (based on both frequency and amount of alcohol intake), and 53% engaged in either harmful or hazardous consumption.24 The study also found that male drinkers and Black drinkers had significantly greater odds of hazardous/harmful consumption than female and White drinkers.24
Other studies based on Medicare beneficiaries or primary care patients corroborate these epidemiologic findings. That is, 31% of community-dwelling, fee-for-service Medicare beneficiaries aged 65+ with at least one of seven chronic conditions (i.e., Alzheimer’s disease or other dementia, chronic obstructive pulmonary disease, depression, diabetes, heart failure, stroke, and hypertension) reported alcohol consumption, and 7% reported at-risk drinking (i.e., 30+ drinks per typical month or 4+ drinks in any single day).13 Nearly 35% of current drinkers aged 60+ seen at primary care settings engaged in at-risk drinking behaviors that included any of the following: (1) alcohol use despite high-risk comorbidities (e.g., liver disease, pancreatitis, high blood pressure, gout, heartburn, stomach pain, falling, nausea, memory impairment, depression); (2) alcohol use despite high-risk medication use (medications that may cause bleeding, dizziness, sedation and those for hypertension, ulcer disease, gastroesophageal reflux, and depression); and (3) at-risk alcohol use alone (e.g., binge drinking, driving under the influence).25
Older adults who misuse alcohol have higher rates of ED visits than their age peers who do not misuse alcohol. The National Institute on Alcohol and Alcohol Abuse and American Geriatrics Society guidelines use lower guidelines than the NSDUH for defining heavy drinking among older adults, i.e., 4+ drinks in any single day during a typical month in the past year. Compared to their age peers who drink within these guidelines, older-adult heavy drinkers had a 1.91 greater odds (95% CI [1.11–3.30]) of acute care ED utilization for ambulatory-care sensitive conditions.26 Regardless of age group, repeat ED users were also found to include a higher proportion of those with alcohol-related diagnoses than non-repeat users.27,28
Higher ED visit rates among older adults who misuse alcohol are attributable in part to alcohol’s adverse effects on chronic medical conditions, falls and other accidents resulting in fractures, self-inflicted injuries including suicide attempts, delirium, gastrointestinal problems, alcohol/alcohol-withdrawal induced mood disorders and agitation, lower adherence to prescribed therapy for chronic medical conditions, and lower rates of primary care and preventive care visits.4,26, 29-35 Older-adult alcohol and/or drug users who take multiple prescription and nonprescription medications are also at a high risk for potentially dangerous interaction effects between these medications and substance use.36,37 Those who concurrently use alcohol with opioid pain relievers (OPR) or benzodiazepines (BZD) are at an especially high risk for fatal/nonfatal overdose, more aberrant behaviors, accidents, and greater ED visits.38,39 The 2010 Drug Abuse Warning Network data showed that alcohol was involved in nearly 13% of OPR abuse-related ED visits and nearly 25% of BZD abuse-related visits among patients aged 55+.40
ED visits have negative health and mental health consequences for older adults.41,42 A systematic review found that between one-third and one-half of ED patients aged 65+ are admitted to a hospital, which is 2.5–4.6 times higher than the hospital admission rates among younger ED patients.31 One study also found that problem drinking was associated with worse self-perceived health among older patients in the year following an ED visit.43 Frequent ED visits by increasing numbers of older adults are also likely to further increase healthcare costs and drain healthcare resources.44 Since alcohol-related health crises can be prevented, identification of subgroups of late middle-aged and older adults who may be at a high risk of ED visits and frequent visits based on their health status and alcohol use/misuse patterns is important for helping older adults avoid such visits.
In this study, we used latent class analysis (LCA)45,46 to identify unobservable subgroups of individuals aged 50+ who may be at risk of ED visits based on their alcohol nonuse/use patterns, chronic health and mental health conditions, and previous ED use. The study contributes to the ED literature by examining ED visit risk levels incorporating health status and alcohol consumption patterns among the population group that comprises the largest share of ED users.
METHODS
Data Source and Sample
Data came from the 2013 National Health Interview Survey (NHIS). The annual, cross-sectional NHIS series is the principal source of information on the health of the civilian noninstitutionalized population of the United States.47 The 2013 NHIS public-use data file contains information on 41,336 households and 42,321 families, with 12,860 children and 33,557 adults interviewed as sample children and sample adults, respectively. All interviews were done face-to-face. Of the total 16,505 sample adults aged 50 years and older, the present study focused on 15,713 respondents, after excluding 619 (4.25%) who were not self-interviewed (i.e., proxy interviewed or interviewee status not known) and an additional 173 (1.01%) whose alcohol-use data were missing.
Measures: Latent Class Indicators
Alcohol nonuse/use pattern was categorized into lifetime abstainers, ex-drinkers, current infrequent/light drinkers, current moderate drinkers, and current heavy drinkers. The NHIS defines lifetime abstainers as those who have had less than 12 drinks of any alcoholic beverages (including liquor such as whiskey or gin, beer, wine, wine coolers, or any other type of alcoholic beverages) in their entire life. Ex-drinkers had had 12+ drinks in their lifetime but had not consumed any alcoholic beverages in the past year. Current drinkers had had 12+ drinks in their lifetime and at least one drink in the past year. Based on the frequency and number of drinks in the past year, current infrequent drinkers had 1–11 drinks total; current light drinkers had 3 or fewer drinks per week; current moderate drinkers had 4–14 drinks per week for men and 4–7 drinks per week for women; and current heavy drinkers had 15+ drinks per week for men or 8+ drinks per week for women.47 Since our bivariate and multivariate analyses showed no significant difference in the numbers of diagnosed chronic illnesses and other reports of chronic health conditions among current infrequent, light, and moderate drinkers, we combined these three groups in the LCA in this study.
Chronic health and mental health conditions (yes=1; no=0 for each) included: (1) chronic illnesses (hypertension [HP], heart disease [coronary heart disease, angina pectoris, myocardial infarction, and/or other health disease or condition], stroke, diabetes, any lung problems [asthma, chronic obstructive pulmonary disease-COPD, emphysema], arthritis [arthritis, rheumatoid arthritis, gout, lupus, fibromyalgia], and cancer as diagnosed by a doctor or other health professional); (2) chronic (in the past three months) fracture, bone/joint injuries that caused functional limitations; (3) chronic (in the past three months) depression/anxiety/other emotional problems that caused functional limitations; (3) chronic (in the past three months) experience of pain in neck, low back, face/jaw muscles and joints, head/migraine, and generalized joint pain that lasted a whole day or more; and (4) whether or not the respondent needed help with activities and instrumental activities of daily living (ADL/IADL).
Number of ED visits in the past 12 months was measured with the question, “…how many times have you gone to a hospital emergency room about your own health (this includes emergency room visits that resulted in a hospital admission)?” The response categories were 0, 1, 2–3, 4–5, 6–7, 8–9, 10–12, 13–15, 16 or more.”
Measures: Sample and Latent Class Membership Characteristics
Sample and latent class membership characteristics included demographics, self-rated health and mental health status, health-related behaviors, and healthcare service use (in the past 12 months).
Demographics were chronological age and age group (50–59, 60–69, 70–79, & 80+ years); gender (male vs. female); race/ethnicity (non-Hispanic white, non-Hispanic Black, Hispanic, non-Hispanic Asian, other); marital status (married/cohabiting vs. not married/cohabiting); education (college degree vs. no college degree); employment status (employed vs. not employed); and region of residence (Northeast, Midwest, South, and West).
Self-rated health was measured on a 5-point scale (1=poor, 5=excellent); and mental health status was measured with the six-item K6 for psychological distress (“feeling nervous; feeling hopeless; feeling restless or fidgety; feeling so sad or depressed that nothing could cheer you up; feeling that everything was an effort; and feeling down on yourself, no good, or worthless” during the past 30 days; 0=none of the time, 4=all of the time).48 Cronbach’s alpha for the study sample was .88. Due to individual item missing values, K6 scores were grouped into no symptoms (=0), any symptoms (≥1), and missing.
Health-related behaviors included (1) body mass index (BMI) calculated from the respondent-reported height and weight, without shoes, at the time of the survey (underweight, healthy weight, overweight, obese, missing); (2) leisure time physical activities (exercise, sports, physically active hobbies…) referring to engagement at least once a week in vigorous, low/moderate, or strength activities; and (3) any tobacco product use (current daily or some-day user, former user, never user) including cigarette smoking and/or other tobacco product use.
Healthcare service utilization in the past 12 months (yes=1; no=0 for each) included (1) insurance status (private insurance, Medicare, and Medicaid); (2) visit with a general doctor/primary care physician (general practice, family medicine, or internal medicine); (3) visit with a mental health service provider (psychiatrist, psychologist, psychiatric nurse, or clinical social worker); and (4) whether or not the ED was the respondent’s usual source of healthcare.
Data Analytic Approach
LCA is a method for identifying unobserved subgroups (latent classes) that consist of individuals that share similar characteristics across a variety of measures.45,46 In this study, we used LCA to identify latent subgroups of older adults based on alcohol consumption patterns, chronic physical and mental health conditions, and past-year ED visits. The LCA models were fit using Mplus 7.1349 using full information maximum likelihood estimation with robust standard errors, which makes use of all available data.50 The first step in fitting an LCA model is to determine the optimal number of classes that underlie the population. This was done by fitting a series of models beginning with a one-class model in which all respondent were treated as a single population, then sequentially increasing the number of classes until there was no improvement gained by adding an additional class. Simulation studies that examined the properties of fit indices51,52 and null hypothesis significance tests52 concluded that the Bayesian information criterion (BIC) and the sample-adjusted BIC were the best indicators of class recovery; however, the Lo-Mendell-Rubin (LMR) likelihood ratio test53 and the bootstrap likelihood ratio test performed similarly well. In another LCA simulation study, Clark and Muthén54 demonstrated that true parameter values are more likely to be in the 95% confidence when entropy, a measure of classification accuracy, was greater than .80. For this study, a series of models were fit and evaluated using LMR likelihood ratio test; entropy (>0.80)54; average class probabilities (>0.80)55; a scree plot of the BIC; and inspection of latent classes’ descriptive statistics. After fitting the LCA model, LCA membership was used as an independent variable in a series of generalized linear models using an identity link function for continuous outcomes and a logit link function for binary outcomes to assess class differences in demographic and other characteristics. All estimates presented in this study are weighted, with the exception of sample sizes.
RESULTS
Sample Characteristics by Alcohol Nonuse/Use Patterns
As alcohol consumption pattern was one of the key indicators for LCA, data in Tables 1 and 2 describe the characteristics of the five alcohol nonuse/use groups. Table 1 shows sociodemographic and health behavior characteristics of the study sample by alcohol nonuse/use pattern. It shows that 20% were lifetime abstainers, 20% were ex-drinkers, 26% were current infrequent/light drinkers, 14% were current moderate drinkers, and 19% were current heavy drinkers. Lifetime abstainers and ex-drinkers were older than the three current drinker groups; however, of all five groups, lifetime abstainers had the highest proportion of women, racial/ethnic minorities, and never smokers.
| N (%) | All 15,713 (100) | Lifetime abstainer 3,505 (20.02) | Ex-drinker 3,474 (20.37) | Current infrequent/light drinker 3,759 (26.18) | Current moderate drinker 2,069 (14.37) | Current heavy drinker 2,906 (19.05) |
|---|---|---|---|---|---|---|
| Sociodemographics | ||||||
| Chronological age (M,SE) | 63.58 (0.11) | 66.40a (0.25) | 65.50b (0.22) | 61.32c (0.19) | 61.97d (0.24) | 62.89e (0.24) |
| Age group (%) | ||||||
| 50–59 years | 41.49 | 32.72 | 33.97 | 49.27 | 47.93 | 43.21 |
| 60–69 years | 31.51 | 28.99 | 32.40 | 32.13 | 31.22 | 32.56 |
| 70–79 years | 17.58 | 22.69 | 20.34 | 13.41 | 15.14 | 16.83 |
| 80+ years | 9.42 | 15.60 | 13.29 | 5.20 | 5.71 | 7.40 |
| Male (%) | 46.70 | 28.47 | 50.22 | 49.76 | 69.12 | 40.95 |
| Race/ethnicity (%) | ||||||
| Non-Hispanic White | 75.45 | 61.74 | 72.88 | 79.79 | 84.94 | 79.51 |
| Non-Hispanic Black | 10.47 | 14.37 | 13.32 | 8.34 | 6.09 | 9.54 |
| Hispanic | 9.20 | 14.49 | 9.48 | 7.93 | 6.15 | 7.37 |
| Non-Hispanic Asian | 4.20 | 8.55 | 3.10 | 3.47 | 2.65 | 2.97 |
| Other | 0.68 | 0.85 | 1.23 | 0.47 | 0.17 | 0.61 |
| Married/cohabiting (%) | 64.33 | 59.00 | 58.61 | 69.89 | 72.21 | 62.46 |
| College degree (%) | 30.69 | 22.22 | 19.48 | 40.19 | 43.98 | 28.48 |
| Employed (%) | 51.16 | 40.60 | 38.42 | 62.09 | 61.37 | 53.14 |
| Health behaviors | ||||||
| Body mass index (%) | ||||||
| <18.5 (underweight) | 1.41 | 1.84 | 1.71 | 1.11 | 1.16 | 1.23 |
| 18.5–24.99 (healthy) | 29.91 | 31.18 | 27.31 | 29.31 | 33.50 | 29.48 |
| 25–29.99 (overweight) | 36.19 | 33.53 | 33.96 | 37.69 | 42.01 | 34.92 |
| 30+ (obese) | 29.44 | 28.91 | 34.62 | 29.33 | 21.55 | 30.55 |
| Missing | 3.05 | 4.53 | 2.40 | 2.56 | 1.79 | 3.82 |
| Any type of leisure time physical activity at least once a week (%) | 63.34 | 49.12 | 55.84 | 71.48 | 76.04 | 65.53 |
| Vigorous activity | 32.09 | 21.05 | 23.55 | 40.79 | 44.24 | 31.71 |
| Moderate/light activity | 54.34 | 40.43 | 48.43 | 61.38 | 65.61 | 57.12 |
| Strengthening activity | 21.71 | 12.61 | 15.70 | 27.79 | 30.59 | 22.63 |
| Tobacco use (%) | ||||||
| Current user | 18.84 | 8.89 | 20.02 | 18.30 | 25.15 | 24.02 |
| Former user | 36.14 | 16.78 | 43.65 | 40.44 | 44.01 | 36.62 |
| Never user | 45.02 | 74.33 | 36.34 | 41.26 | 30.84 | 39.35 |
All group differences are significant at p<0.001. M, mean; SE, standard error of the mean a–eF(4,297)=99.21 for chronological age (Bonferroni-corrected): c=d<b<a; d=e; e<a<b<c.
| N (%) | All 15,713 (100) | Lifetime abstainer 3,505 (20.02) | Ex-drinker 3,474 (20.37) | Current infrequent/light drinker 3,759 (26.18) | Current moderate drinker 2,069 (14.37) | Current heavy drinker 2,906 (19.05) |
|---|---|---|---|---|---|---|
| Health status | ||||||
| Self-rated health (M,SE) | 3.48 (0.01) | 3.32a (0.02) | 3.19b (0.03) | 3.66c (0.02) | 3.80d (0.03) | 3.49e (0.03) |
| No. of diagnosed chronic illnesses (M,SE) | 1.65 (0.01) | 1.68a (0.03) | 2.02b (0.03) | 1.43c (0.03) | 1.38d (0.03) | 1.72e (0.03) |
| Hypertension (%) | 49.24 | 52.79 | 55.62 | 43.42 | 43.60 | 50.95 |
| Heart disease (%) | 19.94 | 20.41 | 27.06 | 16.60 | 16.06 | 19.32 |
| Stroke (%) | 5.07 | 6.53 | 7.79 | 3.02 | 3.29 | 4.79 |
| Diabetes (%) | 16.60 | 20.93 | 23.08 | 13.06 | 8.27 | 16.25 |
| Asthma (%) | 11.49 | 10.16 | 12.90 | 10,90 | 10.20 | 13.15 |
| COPD/emphysema (%) | 6.58 | 5.13 | 10.84 | 4.71 | 4.53 | 7.62 |
| Arthritis (%) | 39.76 | 38.60 | 47.24 | 35.83 | 34.79 | 42.14 |
| Cancer (%) | 16.43 | 13.68 | 17.85 | 16.05 | 17.10 | 17.81 |
| Functional limitations due to chronic fractures of bone/joint/other injury (%) | 6.36 | 5.60 | 7.38 | 5.65 | 4.87 | 8.17 |
| Chronic depression/anxiety/emotional problems (%) | 2.35 | 2.38 | 3.21 | 2.00 | 1.82 | 2.28 |
| Chronic pain (%) | 58.96 | 54.70 | 64.76 | 56.35 | 56.87 | 62.39 |
| Need help with ADL/IADL (%) | 6.92 | 9.94 | 10.93 | 3.81 | 3.17 | 6.58 |
| Psychological distress (%) | ||||||
| No symptom | 47.82 | 55.41 | 43.88 | 47.47 | 48.75 | 43.84 |
| Any symptom | 50.45 | 41.98 | 54.56 | 50.97 | 49.64 | 54.86 |
| Missing data | 1.73 | 2.61 | 1.56 | 1.56 | 1.62 | 1.30 |
| Healthcare use in the past 12 months | ||||||
| Emergency department use (%) | 19.04 | 19.72 | 24.87 | 15.41 | 16.14 | 19.24 |
| Hospitalization (%) | 11.30 | 12.06 | 14.83 | 9.18 | 8.12 | 12.04 |
| Saw general doctor (%) | 79.04 | 77.07 | 80.48 | 79.38 | 78.98 | 79.17 |
| Saw mental health provider (%) | 6.50 | 3.76 | 8.44 | 7.31 | 6.57 | 6.16 |
All group differences, except asthma (p=0.007), cancer (p=0.004), and chronic depression/anxiety/emotional problems (p=0.063), are significant at p<0.001. M, mean; SE, standard error of the mean; COPD, chronic obstructive pulmonary disease; ADL, activities of daily living; IADL, instrumental activities of daily living a–eF(4,297)=95.13 for self-rated health (Bonferroni-corrected): b<a<e<c<d. F(4,297)=67.08 for number of diagnosed chronic illnesses (Bonferroni-corrected): c=d<a=e<b.
Table 2 shows health status and healthcare use characteristics by alcohol nonuse/use pattern. Ex-drinkers had the poorest health and mental health indicators. A significantly higher proportion of lifetime abstainers (the oldest of the five groups) than current infrequent/light drinkers and current moderate drinkers also had chronic illnesses and needed help with ADL/IADL, but they were least likely of all five groups to report any psychological distress symptoms. Current infrequent/light drinkers and current moderate drinkers were similar to each other in health and mental health indicators and had the fewest chronic illnesses of all groups. Compared to these two groups of current drinkers, a larger proportion of current heavy drinkers had reported chronic illnesses, needed help with ADLs/IADLs, and reported psychological distress symptoms. Heavy drinkers were also mostly likely (8.17%) to have reported functional limitations due to chronic bone/joint fractures or other injuries.
With respect to past-year healthcare use, 77% of lifetime abstainers and about 80% of the other groups visited a general doctor/primary care physician. Lifetime abstainers had the smallest portion of mental health service users. Almost 25% of ex-drinkers, about 20% of lifetime abstainers and current heavy drinkers, and about 16% of current infrequent/light drinkers and current moderate drinkers visited an ED in the past 12 months.
Determination of Number and Interpretation of Latent Classes
Fit indices, entropy, LMR, and average class probabilities for models with two through five classes are presented in Table 3. After evaluating all five LCA models (i.e., models with 1 through 5 latent classes), a four-class model was selected for subsequent analyses as the LMR test indicated no significant difference between the 4-class and 5-class models which indicates that the additional complexity of a 5-class model relative to a 4-class model did not improve the model fit; other indices did not appreciably differ across models. The Figure shows item proportions for each of the four latent classes (i.e., the proportions of individuals in a putative class that possesses given characteristics). On the basis of the class characteristics in the Figure, classes were characterized as follows: Class 1: lowest risk, Class 2: low risk, Class 3: moderate risk, and Class 4: high risk.
| No. of latent classes | BIC | Entropy | LMR-LRT | Minimum class probability |
|---|---|---|---|---|
| 2 | 235902.0 | 1.00 | 307764.1 (p<0.001) | 1.00 |
| 3 | 225724.6 | 0.995 | 293451.7 (p<0.001) | 0.996 |
| 4 | 219578.7 | 0.997 | 274874.9 (p<0.001) | 0.996 |
| 5 | 211715.4 | 0.998 | 265012.6 (p=0.140) | 0.996 |
BIC, Bayesian information criterion; LMR, Lo-Mendell-Rubin; LRT, adjusted likelihood ratio test
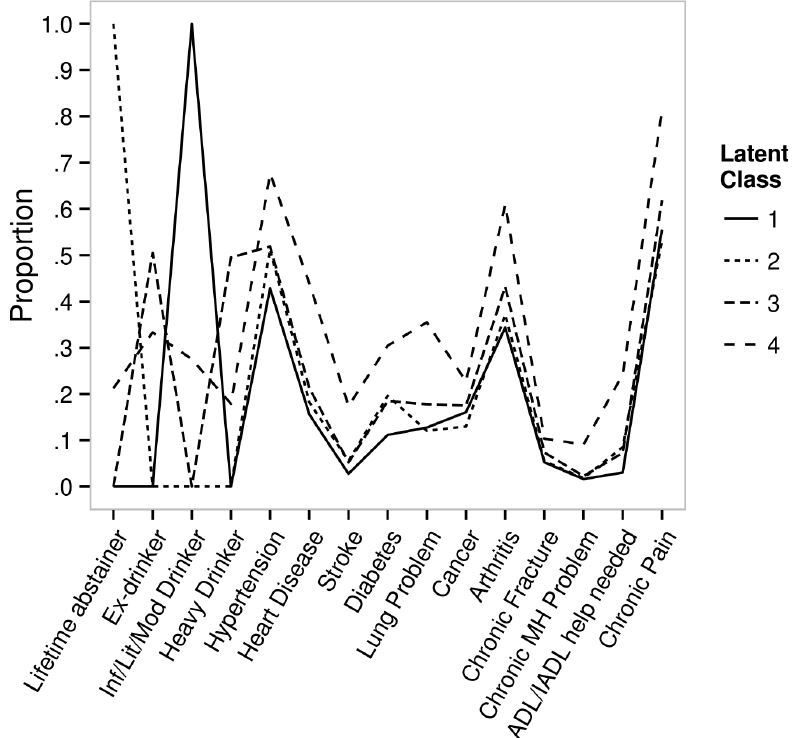
Table 4 shows model parameters for the four classes (Class 1: 35% of the sample, Class 2: 21%; Class 3: 37%; and Class 4: 7%) in the probability scale and the ascending order of ED visit risks from Class 1 to Class 4. All pairwise comparisons between classes were either non-estimable (NE) due to perfect prediction or were significantly different at p<0.001. Class 1 members were almost exclusively infrequent/light/moderate drinkers (i.e., probability >0.99); Class 2 members were almost exclusively lifetime abstainers (i.e., probability >0.99); and Class 3 members were evenly divided between ex-drinkers (probability =0.505) and heavy drinkers (probability =0.495). Class 4 members included all four drinking groups but more heavily ex-drinkers (probabilities =0.333 for ex-drinkers; 0.275 for infrequent/light/moderate drinkers; 0.212 for lifetime abstainers; and 0.179 for heavy drinkers) and were also almost exclusively those who had repeat ED visits in the past year. As expected, Class 1 had the lowest probability and Class 4 had the highest probability of all chronic illnesses, chronic mental health problems, chronic pain, need for ADL/IADL help.
| Indicators | Class 1 (lowest risk) (0.35; n=5,527) | Class 2 (low risk) (0.21; n=3,242) | Class 3 (moderate risk) (0.37; n=5,802) | Class 4 (high risk) (0.07; n=1,142) |
|---|---|---|---|---|
| Lifetime abstainer | 0.000 | >0.99 | 0.000 | 0.212 |
| Ex-drinker | 0.000 | 0.000 | 0.505 | 0.333 |
| Infrequent/light/moderate drinker | >0.99 | 0.000 | 0.000 | 0.275 |
| Heavy drinker | 0.000 | 0.000 | 0.495 | 0.179 |
| Hypertension | 0.428 | 0.513 | 0.519 | 0.677 |
| Heart disease | 0.156 | 0.182 | 0.213 | 0.440 |
| Stroke | 0.028 | 0.055 | 0.052 | 0.174 |
| Diabetes | 0.112 | 0.196 | 0.185 | 0.304 |
| Lung problem | 0.128 | 0.120 | 0.178 | 0.355 |
| Cancer | 0.161 | 0.130 | 0.175 | 0.227 |
| Arthritis | 0.344 | 0.372 | 0.432 | 0.610 |
| Chronic fracture | 0.052 | 0.055 | 0.074 | 0.103 |
| Chronic depression/anxiety/other emotional problem | 0.016 | 0.018 | 0.023 | 0.091 |
| Chronic pain | 0.555 | 0.531 | 0.619 | 0.810 |
| ADL/IADL help needed | 0.030 | 0.085 | 0.073 | 0.242 |
| ED visit-none | 0.881 | 0.859 | 0.847 | 0 |
| ED visit-once | 0.116 | 0.132 | 0.151 | 0.003 |
| ED visit- 2–3 times | 0 | 0 | 0 | 0.735 |
| ED visit- 4+ times | 0 | 0 | 0 | 0.262 |
All paired contrasts between classes are significant at p<0.001 or non-estimable due to perfect prediction. Note: Emergency department (ED) visits were treated as a continuous variable in the latent class analysis model. The ED visit indicator proportions shown above were obtained using participant’s most likely class membership for display purposes. ADL, activities of daily living; IADL, instrumental activities of daily living
In sum, Class 3 members were ex-drinkers and heavy drinkers who also had higher probabilities of chronic disease burden than Classes 1 and 2 members. Class 4 members also included higher proportions of ex-drinkers and heavy drinkers than Classes 1 and 2 members. In addition, compared to the other three classes, Class 4 members had the highest probabilities of all chronic physical, functional, and mental health conditions and a history of repeat ED visits.
Latent Class Membership Characteristics
Table 5 shows that relative to the other three classes, Class 1 members (lowest risk group) were younger and included higher proportions of men, non-Hispanic Whites, married/cohabiting persons, college graduates, employed persons, Northeast residents, those with excellent self-rated health, those doing weekly physical activities, and those with private insurance. Class 1 members also included a higher proportion of overweight people, but a lower proportion of obese people. Relative to the other three classes, Class 2 members (low-risk group) were older and included higher proportions of women, Hispanics, Asians, Southerners, those with no psychological distress symptoms, and those who never used tobacco products. Relative to the other three classes, Class 3 members (moderate risk group) included a highest proportion of Midwesterners. Relative to the other three classes, Class 4 members (high-risk group) included higher proportions of non-Hispanic Blacks (20%), not married/cohabiting persons (49%), obese persons (39%), current smokers (25%), and Medicare- (53%) and Medicaid- (18%) covered persons and lower proportions of college graduates (16%) and those who did any weekly physical activity (47%). Class 4 members were most likely to have visited a general doctor (90%) and to report the ED as their usual healthcare source when sick (3.2%).
| N | Class 1 (lowest risk) (0.35; n=5527) | Class 2 (low risk) (0.21; n=3242) | Class 3 (moderate risk) (0.37; n=5802) | Class 4 (high risk) (0.07; n=1142) |
|---|---|---|---|---|
| Sociodemographics | ||||
| Chronological age (M,SE) | 61.55 (0.16)a | 66.30 (0.25)b | 64.24 (0.18)c | 64.28 (0.41)d |
| Age group (%) | ||||
| 50–59 years | 48.50 | 32.70 | 38.53 | 41.46 |
| 60–69 years | 32.21 | 29.40 | 32.23 | 29.27 |
| 70–79 years | 14.06 | 22.83 | 18.85 | 16.32 |
| 80+ years | 5.23 | 15.07 | 10.39 | 12.94 |
| Male (%) | 56.82 | 28.78 | 46.02 | 41.34 |
| Race/ethnicity (%) | ||||
| Non-Hispanic White | 81.82 | 61.92 | 77.05 | 61.11 |
| Non-Hispanic Black | 7.25 | 14.14 | 10.53 | 19.23 |
| Hispanic | 7.36 | 14.30 | 8.32 | 10.40 |
| Non-Hispanic Asian | 3.22 | 8.85 | 3.16 | 2.36 |
| Other | 0.36 | 0.80 | 0.94 | 0.91 |
| Married/cohabiting (%) | 71.40 | 60.19 | 61.43 | 49.42 |
| College degree (%) | 42.39 | 23.10 | 24.61 | 15.78 |
| Employed (%) | 62.58 | 41.86 | 47.03 | 31.84 |
| Region of residence (%) | ||||
| Midwest | 22.74 | 18.01 | 24.15 | 24.00 |
| South | 33.27 | 47.34 | 36.20 | 39.68 |
| West | 22.00 | 19.55 | 21.72 | 19.06 |
| Northeast | 21.99 | 15.10 | 17.93 | 17.26 |
| Self-rated health (%) | ||||
| Poor | 2.19 | 4.85 | 4.17 | 21.02 |
| Excellent | 25.45 | 17.82 | 17.83 | 7.42 |
| Psychological distress (%) | ||||
| No symptom | 48.95 | 57.42 | 45.37 | 26.15 |
| Any symptom | 49.45 | 39.94 | 53.27 | 71.98 |
| Missing | 1.61 | 2.64 | 1.36 | 1.88 |
| Body mass index (%) | ||||
| <18.5 | 1.05 | 1.85 | 1.32 | 2.81 |
| 18.5–24.99 | 30.59 | 31.59 | 28.77 | 27.25 |
| 25–29.99 | 39.57 | 33.78 | 34.97 | 29.45 |
| 30+ | 26.47 | 28.03 | 31.73 | 38.95 |
| Missing | 2.32 | 4.75 | 3.22 | 1.55 |
| Any type of leisure time physical activity at least once a week (%) | 73.53 | 49.84 | 62.21 | 46.83 |
| Vigorous activity | 42.49 | 21.83 | 28.97 | 16.16 |
| Moderate/light activity | 63.30 | 41.00 | 53.92 | 40.92 |
| Strengthening activity | 28.95 | 12.66 | 19.84 | 14.53 |
| Tobacco product use (%) | ||||
| Current user | 20.57 | 8.39 | 21.31 | 25.15 |
| Former user | 41.39 | 16.55 | 40.12 | 39.17 |
| Never user | 38.05 | 75.05 | 38.57 | 35.68 |
| Private insurance (%) | 69.72 | 52.39 | 57.66 | 42.05 |
| Medicare (%) | 32.03 | 48.22 | 44.07 | 52.70 |
| Medicaid (%) | 2.97 | 8.81 | 6.23 | 17.97 |
| Saw/talked with a general doctor (%) | 78.75 | 76.00 | 79.10 | 89.79 |
| Saw/talked to a mental health provider (%) | 6.50 | 3.35 | 6.10 | 18.45 |
| Emergency department was the place most often went when sick (%) | 0.34 | 0.44 | 0.53 | 3.21 |
All group differences are significant at p<0.001. M, mean; SE, standard error of the mean a–eF (3,298)=100.90 for chronological age (Bonferroni-corrected): a<b,c,d; b>c,d; c=d.
DISCUSSION
This study identified four classes of individuals aged 50+ with regard to their ED visit risk levels by examining their alcohol consumption patterns and health status. The findings show that alcohol consumption patterns are a significant indicator for ED visit risk, with infrequent/light/moderate drinkers and lifetime abstainers presenting significantly lower risk probabilities than ex-drinkers and heavy drinkers. As expected, in addition to being infrequent/light/moderate drinkers, Class 1, the lowest-risk group, is also the youngest and the healthiest by all indicators.
In contrast to Class 1, Class 2 members were the oldest of all four classes and had significantly lower socioeconomic status (SES; i.e., more racial/ethnic minorities and fewer college graduates and employed persons). Class 2 was exclusively lifetime abstainers, and despite their older age and low SES had lower rates of chronic health conditions, functional limitations, and mental health problems than Classes 3 and 4. Previous studies show that lifetime abstainers are often genetically predisposed to or have chosen abstention because of their religious beliefs, culture, or family environment and personal values and beliefs about alcohol or other substance use and can thus avoid substance-induced/influenced risky behaviors.56-58 Other recent studies also show that lifetime abstainers tend to have a more favorable cardiovascular profile and better overall mental health than ex-drinkers or heavy or binge drinkers.37,59
The high probability of ex-drinkers in Classes 3 and 4, the two higher risk groups, with significantly poorer health/mental health than current infrequent/light/moderate drinkers and lifetime abstainers, supports the “sick quitter” assumption and the possibility that ex-drinkers were likely to include former bingers and heavy drinkers. For example, Ng Fat et al.60 found that worsening health or preexisting poor health and poor psychosocial health were associated with ceasing alcohol consumption at ages 42 and 50. Class 4 members have the highest burden of chronic diseases (especially cardiovascular diseases), chronic pain, and chronic mental health problems. Nevertheless, a substantial proportion of them engage in unhealthy behaviors as shown in their rates of heavy drinking, obesity, smoking, and no physical activity. Although older adults’ medical conditions causing chronic pain tend to reduce alcohol consumption over time, some rely on alcohol to manage pain, which leads to more alcohol consumption and/or alcohol-related problems.61-63
Unhealthy behaviors among Class 4 members may also stem from their significant SES disadvantages, which may not facilitate adoption of healthy behaviors and effective self-management of chronic medical conditions. Although a majority of Class 4 members appear to have a usual place of healthcare other than the ED, ED visits were likely for health crises resulting from high disease burden and unhealthy behaviors even for those with primary care access.
The findings have the following clinical and research implications. First, primary care physicians and other aging-service providers should provide their patients at high risk for ED visits with more psychoeducation or other such interventions that will encourage reducing problematic alcohol consumption and engaging in other healthy behaviors. Almost all interventions for treatment-seeking older-adult substance abusers demonstrate positive outcomes that are on par with those among younger cohorts.64 Brief advice or brief interventions at primary-care settings for non-treatment-seeking older-adults with alcohol-related problems have also had positive effects; however, long-term effects of these brief interventions have been mixed.64 More research on longer-term, age-specific interventions is needed.
Second, all older adults with chronic illnesses are likely to benefit from better self-management of chronic illnesses by participating in evidence-based programs such as Stanford’s Chronic Disease Self-Management Program, which has been found to reduce ED visits and hospitalizations among participants.65 Primary care and ED physicians should refer their patients to face-to-face or web-based chronic disease self-management programs.
Third, access to preventive care in primary care settings and mental health services needs to be improved for those at high risk of ED visits. Especially given the high-risk group’s low SES, transportation and other barriers to accessing primary care should be examined.
Fourth, given the mixed evidence about brief interventions in EDs, trauma care centers, and in-patient hospital care settings with regard to their effects on treatment and healthcare utilization outcomes, more research is needed to refine treatment practice and enhance treatment outcomes.66,67
Finally, in addition to individual-level interventions, efforts to improve preventive healthcare access and healthy behaviors require mezzo- and macro-level interventions such as neighborhood-level public health interventions and higher Medicaid and health insurance reimbursement for preventive services.
LIMITATIONS
Our study has some limitations due to data constraints. First, data on ED visits did not include the circumstances leading to these visits, which would have provided a richer contextual description. Second, since ED discharge diagnosis was also missing, potential interaction effects of alcohol, prescription drugs, and over-the-counter medications and alcohol’s effects on falls and other injuries on ED visit risk could not be factored in. Third, the LCA indicators, including past-year ED visits, were self-reported and possibly subject to underreporting due to poor recall or social desirability bias. Fourth, NHIS does not collect data on illicit drug use/misuse. Given the continuing increase in drug-use disorders among ED visitors,5 future research should include both alcohol and drug use/misuse.
CONCLUSION
Alcohol nonuse/use and quantity of use contribute significantly to varying levels of ED visit risk among individuals aged 50+. In the face of projected increases in ED visits by this age group, the findings underscore the importance of clinical practice that takes into account past and current alcohol use/misuse and provides psychoeducation and other interventions to increase healthy behaviors. In particular, clinicians need to help heavy-drinking older adults reducing unhealthy alcohol consumption and help both heavy drinkers and ex-drinkers improve chronic illnesses self-management. More research on effective treatment practices in primary care and other healthcare settings for older adults with alcohol-related problems is needed. On mezzo- and macro-levels, improving access to preventive care in primary care setting and mental health treatment, especially for older adults with low SES and high chronic disease burden and poor mental health, is a necessity.
Footnotes
Section Editor: Wirachin Hoonpongsimanont, MD, MS
Full text available through open access at http://escholarship.org/uc/uciem_westjem
Address for Correspondence: Namkee Choi, Ph.D, The University of Texas at Austin, 1925 San Jacinto Blvd, Austin, TX 78712-0358. Email: nchoi@austin.utexas.edu. 12 / 2015; 16:1146 – 1158
Submission history: Revision received June 4, 2015; Submitted September 21, 2015; Accepted September 23, 2015
Conflicts of Interest: By the WestJEM article submission agreement, all authors are required to disclose all affiliations, funding sources and financial or management relationships that could be perceived as potential sources of bias. The authors disclosed none.
REFERENCES
1. Pines JM, Mullins PM, Cooper JK, et al. National trends in emergency department use, care patterns, and quality of care of older adults in the United States. J Am Geriatr Soc. 2013;61:12-7.
2. Roberts DC, McKay MP, Shaffer A. Increasing rates of emergency department visits for elderly patients in the United States, 1993 to 2003. Ann Emerg Med. 2008;51:769-74.
3. Wajnberg A, Hwang U, Torres L, et al. Characteristics of frequent geriatric users of an urban emergency department. J Emerg Med. 2012;43:376-81.
4. Samaras N, Chevalley T, Samaras D, et al. Older patients in the emergency department: a review. Ann Emerg Med. 2010;56:261-9.
5. Skinner HG, Blanchard J, Elixhauser A. Trends in emergency department visits, 2006–2011: Statistical Brief #179. Healthcare Cost and Utilization Project (HCUP) Statistical Briefs. Available at: https://www.hcup-us.ahrq.gov/reports/statbriefs/sb179-Emergency-Department-Trends.pdf. Accessed Sept 2014.
6. Gfroerer J, Penne M, Pemberton M, et al. Substance abuse treatment need among older adults in 2020: the impact of the aging baby-boom cohort. Drug Alcohol Depend. 2003;69:127-35.
7. Colliver JD, Compton WM, Gfroerer JC, et al. Projecting drug use among aging baby boomers in 2020. Ann Epidemiol. 2006;16:257-65.
8. Results from the 2013 National Survey on Drug Use and Health: Summary of National Findings. 2014. Available at: http://www.samhsa.gov/data/sites/default/files/NSDUHresultsPDFWHTML2013/Web/NSDUHresults2013.pdf.
9. McEvoy LK, Kritz-Silverstein D, Barrett-Connor E, et al. Changes in alcohol intake and their relationship with health status over a 24-year follow-up period in community-dwelling older adults. J Am Geriatr Soc. 2013;61:1303-8.
10. Moos RH, Brennan PL, Schutte KK, et al. Older adults’ health and late-life drinking patterns: a 20-year perspective. Aging Ment Health. 2010;14:33-43.
11. Newsom JT, Huguet N, Ramage-Morin PL, et al. Health behaviour changes after diagnosis of chronic illness among Canadians aged 50 or older. Component of Statistics Canada Catalogue no. 82–003-XPE. Health Rep. 2012;23:3-7.
12. Platt A, Sloan FA, Costanzo P. Alcohol-consumption trajectories and associated characteristics among adults older than age 50. J Stud Alcohol Drugs. 2010;71:169-79.
13. Ryan M, Merrick EL, Hodgkin D, et al. Drinking patterns of older adults with chronic medical conditions. J Gen Intern Med. 2013;28:1326-32.
14. Ferreira MP, Weems MKS. Alcohol consumption by aging adults in the United States: Health benefits and detriments. J Am Diet Asso. 2008;108:1668-76.
15. Kapogiannis D, Kisser J, Davatzikos C, et al. Alcohol consumption and premotor corpus callosum in older adults. Eur Neuropsychopharm. 2012;22:704-10.
16. Bujanda L. The effects of alcohol consumption upon the gastrointestinal tract. Am J Gastroenterol. 2000;95:3374-82.
17. Rehm J. The risks associated with alcohol use and alcoholism. Alcohol Res Health. 2011;34:135-43.
18. Roerecke M, Rehm J. Alcohol intake revisited: risks and benefits. Curr Atheroscler Rep. 2012;14:556-62.
19. Chikritzhs TN, Naimi TS, Stockwell TR, et al. Mendelian randomisation meta-analysis sheds doubt on protective associations between ‘moderate’ alcohol consumption and coronary heart disease. Evid Based Med. 2015;20:38.
20. Choi NG, DiNitto DD, Marti CN, et al. Sociodemographic characteristics and health status of lifetime abstainers, ex-drinkers, bingers, and nonbingers among baby boomers and older adults. Subst Use Misuse.
21. Jefferis BJ, Manor O, Power C. Social gradients in binge drinking and abstaining: Trends in a cohort of British adults. J Epidemiol Community Health. 2007;61:150-3.
22. Kerr WC, Ye Y. Relationship of life-course drinking patterns to diabetes, heart problems, and hypertension among those 40 and older in the 2005 U.S. National Alcohol Survey. J Stud Alcohol Drugs. 2010;71:515-25.
23. Blazer DG, Wu LT. The epidemiology of alcohol use disorders and subthreshold dependence in a middle-aged and elderly community sample. Am J Geriatr Psychiatry. 2011;19:685-94.
24. Wilson SR, Knowles SB, Huang Q, et al. The prevalence of harmful and hazardous alcohol consumption in older U.S. adults: Data from the 2005–2008 National Health and Nutrition Examination Survey (NHANES). J Gen Intern Med. 2014;29:312-9.
25. Barnes AJ, Moore AA, Xu H, et al. Prevalence and correlates of at-risk drinking among older adults: the project SHARE study. J Gen Intern Med. 2010;25:840-6.
26. Merrick ES, Hodgkin D, Garnick DW, et al. Older adults’ inpatient and emergency department utilization for ambulatory-care-sensitive conditions: relationship with alcohol consumption. J Aging Health. 2011;23:6-111.
27. Liu SW, Nagurney JT, Chang Y, et al. Frequent ED users: are most visits for mental health, alcohol, and drug-related complaints?. Am J Emerg Med. 2013;31:1512-5.
28. Moe J, Bailey AL, Oland R, et al. Defining, quantifying, and characterizing adult frequent users of a suburban Canadian emergency department. CJEM. 2013;15:214-26.
29. Bazargan-Hejazi S, Bazargan M, Hardin E, et al. Alcohol use and adherence to prescribed therapy among under-served Latino and African-American patients using emergency department services. Ethn Dis. 2005;15:267-75.
30. Bell AJ, Talbot-Stern JK, Hennessy A. Characteristics and outcomes of older patients presenting to the emergency department after a fall: a retrospective analysis. Med J Aust. 2000;173:179-82.
31. Blow FC, Brockmann LM, Barry KL. Role of alcohol in late-life suicide. Alcohol Clin Exp Res. 2004;28(5 Suppl):48S-56S.
32. Carter MW, Reymann MR. ED use by older adults attempting suicide. Am J Emerg Med. 2014;32:535-40.
33. Girard DD, Partridge RA, Becker B, et al. Alcohol and tobacco use in the elder emergency department patient: assessment of rates and medical care utilization. Acad Emerg Med. 2004;11:378-82.
34. Merrick EL, Hodgkin D, Garnick DW, et al. Unhealthy drinking patterns and receipt of preventive medical services by older adults. J Gen Intern Med. 2008;23:1741-8.
35. Onen SH, Onen F, Mangeon JP, et al. Alcohol abuse and dependence in elderly emergency department patients. Arch Gerontol Geriatr. 2005;41:191-200.
36. Fraser AG. Pharmacokinetic interactions between alcohol and other drugs. Clin Pharmacokinet. 1997;33:79-90.
37. Immonen S, Valvanne J, Pitkälä KH. Older adults’ own reasoning for their alcohol consumption. Int J Geriatr Psychiatry. 2011;26:1169-76.
38. Gudin JA, Mogali S, Jones JD, et al. Risks, management, and monitoring of combination opioid, benzodiazepines, and/or alcohol use. Postgrad Med. 2013;125:115-30.
39. Nielson S, Lintzeris N, Bruno R, et al. Benzodiazepine use among chronic pain patients prescribed opioids: associations with pain, physical and mental health, and health service utilization. Pain Med. 2015;16:356-66.
40. Jones CM, Paulozzi LJ, Mack KA. Alcohol involvement in opioid pain reliever and benzodiazepine drug abuse-related emergency department visits and drug-related deaths – United States, 2010. Centers for Disease Control and Prevention (CDC). MMWR Morb Mortal Wkly Rep. 2014;63(40):881-5.
41. Aminzadeh F, Dalziel WB. Older adults in the emergency department: a systematic review of patterns of use, adverse outcomes, and effectiveness of interventions. Ann Emerg Med. 2002;39:238-47.
42. McCusker J, Healey E, Belavance F, et al. Predictors of repeat emergency department visits by elders. Acad Emerg Med. 1997;4:581-8.
43. Friedmann PD, Jin L, Karrison T, et al. The effect of alcohol abuse on the health status of older adults seen in the emergency department. Am J Drug Alcohol Abuse. 1999;25:529-42.
44. Ondler C, Hegde GG, Carlson JN. Resource utilization and health care charges associated with the most frequent ED users. Am J Emerg Med. 2014;32:1215-9.
45. Hagenaars JA, McCutcheon AL. Applied latent class analysis. 2002.
46. McCutcheon AL. Latent class analysis. 1987.
47. National Health Interview Survey, 2013. Public-use data file and documentation. 2013. Available at: http://www.cdc.gov/nchs/nhis/quest_data_related_1997_forward.
48. Kessler RC, Barker PR, Colpe LJ, et al. Screening for serious mental illness in the general population. Arch Gen Psychiatry. 2003;60:184-9.
49. Muthén L, Muthén B. Mplus user’s guide: Statistical analysis with latent variables. 1998–2012.
50. Graham JW. Missing data analysis: Making it work in the real world. Annu Rev Psychol. 2009;60:549-76.
51. Tofghi D, Enders CK. Identifying the correct number of classes in mixture models. Advances in latent variable mixture models. 2007:317-41.
52. Nylund KL, Asparouhov T, Muthén BO. Deciding on the number of classes in latent class analysis and growth mixture modeling: A Monte Carlo simulation study. Struct Equ Modeling. 2007;14:535-69.
53. Lo Y, Mendell NR, Rubin DB. Testing the number of components in a normal mixture. Biometrika. 2011;88:767-78.
54. Clark SL, Muthén B. Relating latent class analysis results to variables not included in the analysis. 2009. Available at: http://statmodel2.com/download/relatinglca.pdf.
55. Geiser C. Data analysis with Mplus. 2012.
56. Bernards S, Graham K, Kuendig H, et al. “I have no interest in drinking”: A cross-national comparison of reasons why men and women abstain from alcohol use. Addiction. 2009;104:1658-68.
57. Michalak L, Trocki K, Bond J. Religion and alcohol in the U.S. National Alcohol Survey, how important is religion for abstention and drinking?. Drug Alcohol Depend. 2007;87:268-80.
58. Vaughn MG, Fu Q, Wernet SJ, et al. Characteristics of Abstainers from Substance Use and Antisocial in the United States. J Crim Justice. 2011;39:212-7.
59. Marti CN, Choi NG, DiNitto DM, et al. Associations of Lifetime Abstention and Past and Current Alcohol Use with Late-Life Mental Health: A Propensity Score Analysis. Drug Alcohol Depend. 2015;149:245-51.
60. Ng Fat L, Cable N, Shelton N. Worsening of health and a cessation or reduction in alcohol consumption to special occasion drinking across the three decades of life course. Alcohol Clin Exp Res. 2015;39:166-74.
61. Brennan PL, Schutte KK, SooHoo S, et al. Painful medical conditions and alcohol use: a prospective study among older adults. Pain Med. 2011;12:1049-59.
62. Brennan PL, SooHoo S. Pain and use of alcohol in later life: prospective evidence from the health and retirement study. J Aging Health. 2013;25:656-77.
63. Moos RH, Brennan PL, Schutte KK, et al. Older adults’ health and late-life drinking patterns: a 20-year perspective. Aging Ment Health. 2010;14:33-43.
64. Kuerbis A, Sacco P. A review of treatments for substance abuse among the elderly and recommendations for future directions. Subst Abuse Res Treat. 2013;7:13-37.
65. Ahn S, Basu R, Smith ML, et al. The impact of chronic disease self-management programs: healthcare savings through a community-based intervention. BMC Public Health. 2013;13:1141.
66. Bray JW, Cowell AJ, Hinde JM. A systematic review and meta-analysis of health care utilization outcomes in alcohol screening and brief intervention trials. Med Care. 2011;49:287-94.
67. Field CA, Baird J, Saitz R, et al. The mixed evidence of intervention in emergency departments, trauma care centers, and inpatient hospital settings: what should we do?. Alcohol Clin Exp Res. 2010;34:2004-10.