
| Author | Affiliation |
|---|---|
| F. Abron Franklin, II, PhD, MPH | Satcher Health Leadership Institute, Department of Community Health and Preventive Medicine, Morehouse School of Medicine, Atlanta, GA |
| Thomas A. LaVeist, PhD | Johns Hopkins University Bloomberg School of Public Health, Department of Health Policy and Management, Baltimore, MD |
| Daniel W. Webster, ScD, MPH | Johns Hopkins University Bloomberg School of Public Health, Department of Health Policy and Management, Baltimore, MD |
| William K. Pan, DrPH, MPH | Johns Hopkins University Bloomberg School of Public Health, Department of International Health, Baltimore, MD |
ABSTRACT
Introduction:
Alcohol is more likely than any other drug to be involved in substance-related violence. In 2000 violence-related and self-directed injuries accounted for an estimated $37 billion and $33 billion in productivity losses and medical treatment, respectively. A review of emergency department data revealed violence and clinically identified trauma-related injuries have the strongest correlation among alcohol-dependent injuries. At the environmental level there is a relationship between alcohol outlet density and violent crime. A limited number of studies have examined the relationship between alcohol outlet type and the components of violent crime. The aim of this study is to examine the relationship between the aggregate components of violent crime and alcohol outlet density by type of outlet.
Methods:
For this study we used Washington, D.C. census tract data from the 2000 census to examine neighborhood characteristics. Alcohol outlet, violent crime, and population-level data for Washington, D.C. were drawn from various official yetpublicly available sources. We developed an analytic database to examine the relationship between alcohol outlet category and four types of violent crime. After estimating spatial correlation and determining spatial dependence, we used a negative binomial regression analysis to assess the alcohol availability-violent crime association, while controlling for structural correlates of violence.
Results:
Independent of alternative structural correlates of violent crime, including the prevalence of weapons and illicit drugs, community-level alcohol outlet density is significantly associated with assaultive violence. Outlets were significantly related to robbery, assault, and sexual offenses. In addition, the relationship among on-premise and off-premise outlets varied across violent crime categories.
Conclusion:
In Washington, D.C., alcohol outlet density is significantly associated with the violent crimes. The science regarding alcohol outlet density and alcohol-related harms has clearly identified the use of limiting outlet density to reduce the associated adverse health consequences. Moreover, the disproportionate burden among poor urban and minority communities underscores the urgency to develop context-appropriate policies to regulate the functioning of current alcohol outlet establishments and to prevent the proliferation of future outlets.
INTRODUCTION
Data from the National Crime Victimization Survey (NCVS) indicate that alcohol is more likely than any other drug to be involved in substance-related violence. In 1998 approximately 25% of the victims of violent crime reported that their offender had been consuming alcohol prior to committing a violent act.1 In 2006 approximately one third of the victims perceived an offender who had been drinking.2 Compared to other categories of violent crime, alcohol-related violence is most prevalent in homicidal violence.3 From an economic perspective, in 2000 violence-related and self-directed injuries accounted for an estimated $37 billion and $33 billion in productivity losses and medical treatment, respectively.4 A review of emergency department data revealed violence and clinically identified trauma-related injuries have the strongest correlation among alcohol-dependent injuries.5
Although studies have identified the positive association between alcohol consumption and the perpetration of violent crime, the underlying mechanisms behind the alcohol-violence relationship are not fully understood.6,7 At the individual level, research suggests the alcohol-violence connection results from an interaction between an individual’s natural personality trait, such as impulsiveness or aggression, and the situational context.8–10 Accordingly, the selective nature of an individual’s disinhibition (i.e., lack of constraint) is also dependent upon contextual factors and, all other factors being equal, situational norms with the least institutional support are more apt to become disinhibited.10
At the environmental level, research has identified an association between outlet densities and the geographical distribution of assaultive violence.6,7,11–17 Outlet densities have also been associated with drinking norms, cirrhosis-related mortality, fatal and severe traffic crashes, and alcoholism.15,18 Compared to communities with lower densities of alcohol outlets, communities with higher densities of outlets experience higher rates of alcohol-related problems.19 The degree of alcohol availability in a community impacts the social, physical, and economic well being of its residents.20
Empirical evidence shows that both alcohol outlets and violent crime are disproportionately concentrated in poor urban minority neighborhoods.20–23 Compared to race, ethnicity or other community characteristics, among racially segregated communities alcohol outlets are a stronger predictor of homicide and assaultive violence.20 A descriptive study characterizing the spatial patterns of alcohol outlets in Washington, D.C. found a heavy concentration of off-premise outlets distributed among African-American communities.3 Violence and alcohol use significantly contribute to the leading causes of death between the ages of 1–35.24,25 Given the disproportionate levels of alcohol outlet densities and violence among urban racial/ethnic communities, spikes in violent crime, and the substantial social and economic burden associated with the alcohol availability-violent crime relationship, a further examination of this association is warranted.
The present research adds to the literature by examining the alcohol outlet density type-assaultive violence association across categories of violent crime and among a predominantly racial/ethnic urban population distribution. Previous studies, with a similar premise, have done so with either a limited number of African-Americans or have identified results contrary to the larger body of work in this area.14,26 The goal of this study is to assess the relationship between alcohol outlet density and violent crime among communities with a predominant racial/ethnic urban population distribution; examine the types of assaultive violence included in the alcohol availability-violent crime association; and explore the alcohol outlet-violent crime relationship between alcohol outlet types (i.e., off-premise vs. on-premise).
METHODS
Study Site
Data used for this study pertain to the city of Washington, D.C. Based on the 2000 decennial census, Washington, D.C. had a total population of 572,059. The District of Columbia consisted of 188 census tracts and 5,674 census blocks. Citywide 16.7% of the families and 20.2% of the individuals lived below the poverty level. The median household income was $40,127 and 78% of the population was a high school graduate or higher. The population was 30.8% white, 60% African-American, 7.9% Hispanic or Latino, .3% American Indian and Alaska Native and 0.1% Native Hawaiian and Other Pacific Islander.
In this study, the unit of analysis is the census tract, which serves as a proxy for community neighborhoods.27–30 The population in a census tract ranges from 1000–4000 persons. The research draws on population data from various secondary sources to develop an analytic database. We constructed indicators of community structural characteristics using 2000 decennial census data and used municipal-level population data to identify alcohol outlets and violent crime events.
Data Collection and Measures
Dependent Variables. Violent crime is composed of four offenses: murder and non-negligent manslaughter (i.e., homicide), sexual assault (i.e., sexual offenses), robbery, and assault (i.e., aggravated assault). Overall or “violent crime” was an aggregate of all four offenses. We obtained crime and arrest data for the city of Washington D.C. from the Metropolitan Police Department for 2006.
Independent Variables. For 2006, the Alcohol Beverage Regulation Administration (ABRA) provided the identification and physical location of alcohol outlets. In Washington, D.C., there are four primary types of alcoholic licenses: class “A” licenses are for package stores, which permit the sale of beer, wine, and liquor for consumption off the premises; class “B” licenses are generally reserved for grocery stores to sell only beer and wines for consumption off the premises; class “C” licenses are for the consumption of beer, wine, and liquor on the premises; and class “D” licenses function the same as class “C” licenses, except for sale of liquor. In this study we grouped alcohol outlets into the categories of on-premise outlets, off-premise outlets, and overall, or total, number of outlets.
Structural Covariates. Social disorganization theories suggest that socioeconomic conditions, minority composition, and the physical environment characterize a community’s structural ecology and its influence on violent crime.6,31,32 In accord with the theoretical literature regarding the structural correlates of violence, the measures considered for characterizing community features were taken from census-based indicators.6,7,13,33,34 We constructed approximately seven census-based correlates of crime using Census 2000 Data Engine Software. To avoid issues of multicollinearity among census-based indicators of economic distress, we used the index of objective neighborhood disadvantage to avoid collinear overlap. Similar indexes have been used in violence and neighborhood research.14,35,36 Of the seven community structural variables, an index of objective neighborhood disadvantage35,36 (mother-only households, homeownership, college-educated residents, and household poverty) was used. The index of neighborhood disadvantage divides each of the four component percentages by 10, adds the prevalence of poverty and of mother-only households, and subtracts the prevalence of home ownership and college-educated residents among the census tracts; and then divides by four. Therefore, a unit increase in the scale is equivalent to an increase of 10 percentage points in each of the components: the prevalence of poor households, mother-only households, onon-owner occupied units, and adults without a college degree. The index ranges from advantaged neighborhoods in which many adults have college degrees and own their homes and few households are poor or mother-only, on the low end, to disadvantaged neighborhoods in which few adults have college degrees, many rent rather than own their homes, and many households are poor and female-headed, on the high end. Two indicators of population density (household crowding or occupancy per room and person per square mile) and an indicator of racial / ethnic composition (i.e., African-American) were included in the model. Disorder was assessed as the number of occupied households.36–38 Because of the connection between hand guns, illicit drugs, and violent crimes, weapons-related and illicit drug-related arrests were included as community indicators of gun and drug violence.39 Except where expressed as percentages, all variables are population-based rates geocoded to their respective census tract location.
Analytic Strategy
We conducted pairwise correlations between community structural characteristics, alcohol outlet density, and violent crime. To avoid the risk of a type I error or a multiple comparison fallacy, the Sidak correction method was used for adjusting significance levels to take multiple comparisons into account.40,41 Moran’s Index (Moran’s I) was used to estimate spatial correlation among violent crime outcome variables.42,43 The spatial correlation was modestly positive (0.267); however, diagnostics of full models for spatial dependence (i.e., spatial lag and spatial error estimates) did not identify significant spatial dependence in either of the likelihood estimations.
We used studentized deleted residuals to determine if any observations had an undue influence on the coefficient estimates because of an extreme discrepant value or outlier. An additional indication of undue influenced was employed using Cook’s Distance, which estimates leverage and discrepancy combined. After adjusting for outlying and influential observations and small total population counts (i.e., population <100), the data used in this study included an analytic sample of 80% of the census tracts. The population of the census tract is used as an offset variable. By using the offset, the study models the effects of the predictors on the count of violence (or any outcome) per population. This neutralizes the potential impact of the different scales and the differences in the populations at risk of violence.
Because of the skewed distribution of the data, the study’s analytical framework is premised on a Poisson probability distribution.44 Consequently, we used a negative binomial multivariate regression analysis to assess the relationship between alcohol outlet density and violent crime among urban communities to examine the types of assaultive violence included in the alcohol availability-violent crime associationm and explore the alcohol outlet-violent crime association between alcohol outlet types (i.e., off-premise vs. on-premise). To develop the most parsimonious model, we removed population characteristics that were either statistically insignificant or marginally contributed to improving model fit from the final model.
RESULTS
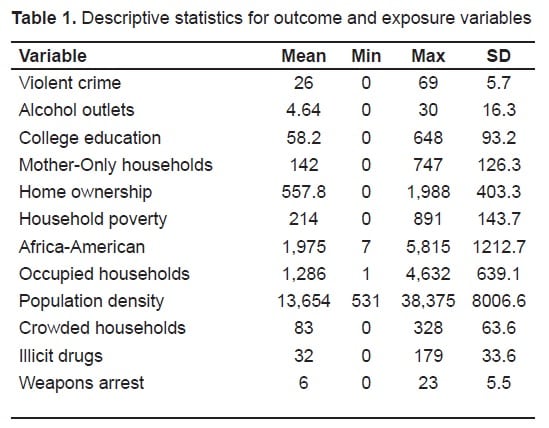
Table 1 presents descriptive statistics for the outcome variable of violent crime, alcohol outlets, and the structural covariates of violent crime. In 2006 there were approximately 1,400 alcohol outlets in Washington, D.C, 30% of them off-premise outlets. On average, there were 26 crimes and 4.64 outlets per census tract.
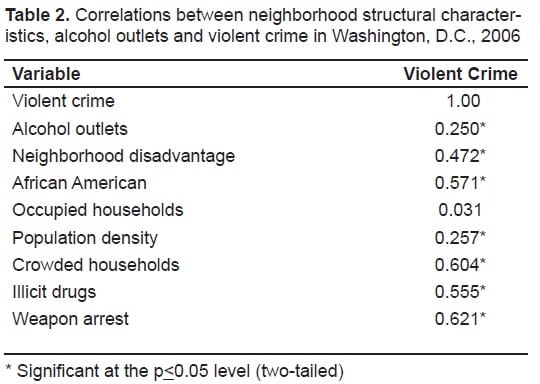
Positive correlations between community structural characteristics, alcohol outlet density and violent crime in Washington, D.C. are in Table 2. Alcohol outlets are significantly correlated with violent crime, (0.250;p<0.05). Other notable community features strongly correlated with violent crime include neighborhood disadvantage (0.472;p<0.05) and racial composition (i.e., African-American), (0.571;p<0.05), which suggests that race and class may independently impact the alcohol availability-assaultive violence association.
Positive correlations between community structural characteristics, alcohol outlet density and violent crime in Washington, D.C. are in Table 2. Alcohol outlets are significantly correlated with violent crime, (0.250;p<0.05). Other notable community features strongly correlated with violent crime include neighborhood disadvantage (0.472;p<0.05) and racial composition (i.e., African-American), (0.571;p<0.05), which suggests that race and class may independently impact the alcohol availability-assaultive violence association.
The results from the negative binomial multivariate regression analysis are in Table 3. The findings demonstrate a significantly positive association between assaultive violence and the physical availability of alcohol. Interpretation of the outlet coefficient (eb=1.04;p<0.05) indicates that for every additional alcohol outlet, assaultive violence increases by a factor of 4.0% while holding all other variables in the model constant. Notable structural indicators significantly associated with violent crime include African-American population (eb=1.25;p<0.05); population density (eb=1.26;p<0.05); and the number of occupied households (eb=0.478;p<0.05). Although neighborhood disadvantage is significantly correlated with violent crime, in the complete model it remains positively associated; yet it is insignificant. After controlling for economic disadvantage and additional structural correlates of violent crime, the physical availability of alcohol is consistently and significantly associated with assaultive violence. The relationship between weapons and illicit drug-related arrests and assaultive violence is in the positive direction. However, neither illicit drugs nor weapons (i.e., gun availability) are significantly associated with violent crime.
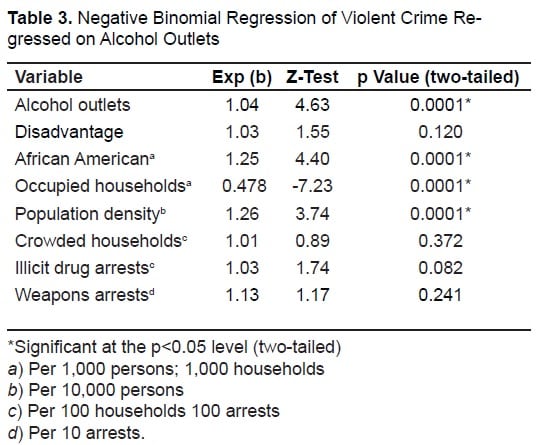
Table 4 shows the results of the category of assaultive violence included in the positive alcohol availability-violent crime association. Alcohol outlet density is significantly related to robbery (eb=1.05p<0.05) and its relationship with homicide is in the positive direction (eb=1.02;p=0.543), although statistically insignificant. Neither illicit drug-related arrests nor weapons-related arrests are significantly associated with homicide, robbery, or sexual offenses. However, illicit drugs are significantly related to violent assaults (eb=1.06;p<0.05). Alcohol outlets are significantly and positively associated with assaults (eb=1.03;p<0.05) and sexual offenses (eb=1.04;p<0.05). After calculating the effect size, the difference in effect of alcohol outlets between the violent outcomes of robbery, assault, and sexual offenses is minimal, approximately (∼1%).
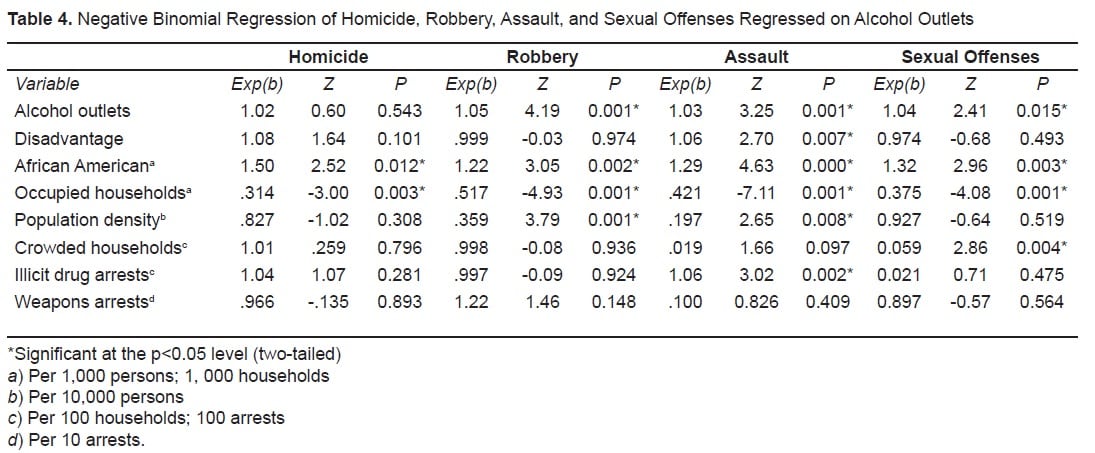
Table 5 shows the results of assaultive violence categories across on-premise and off-premise alcohol outlets. The results are similar to the effects of the total number of outlets. Neither on-premise nor off-premise outlets were significantly related to violent homicide. Although, in the comparison, the direction of the relationship between off-premise outlets and homicidal violence is positive (eb=1.07;p=0.312) and, alternatively, the direction of the relationship between on-premise outlets and homicide is in the negative (eb=0.958;p=0.253) direction. Both types of outlets, on-premise (eb=1.04;p<0.05) and off-premise (eb=1.09;p=0.05), are significantly and positively related to robbery. Neither type of outlet is significantly associated with assaults or sexual offenses. The lack of a significant association with sexual offenses may be a result of a limited number of observations specific to this category.
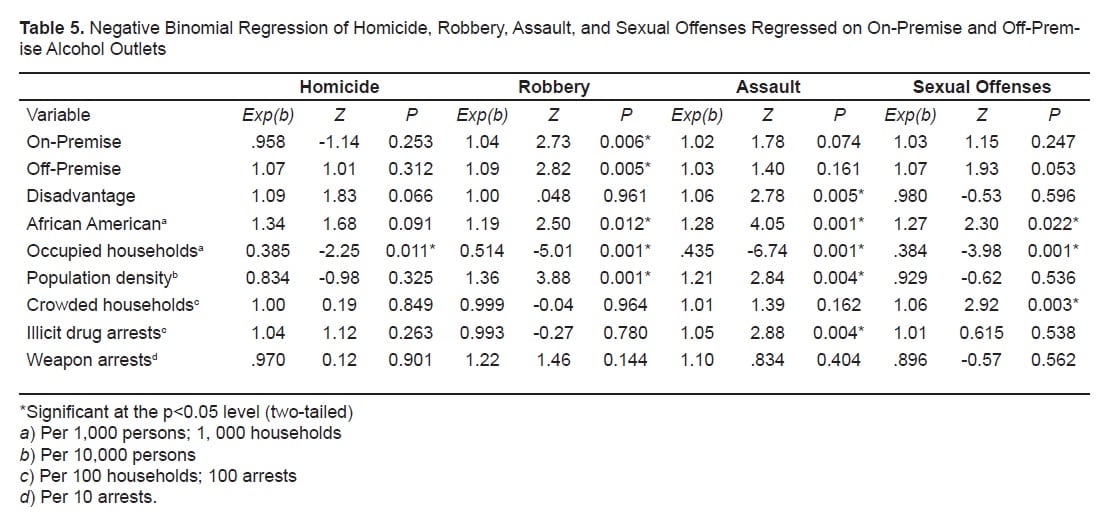
Illicit drug arrests are significantly associated with violent assaults (eb=1.05;p<0.05). Independent of the varying strengths of association across the on-premise off-premise outlet comparison, a calculation of effect size demonstrated a minimal difference (∼1%) between the total outlet and the on/off-premise categories.
DISCUSSION
Independent of alternative structural correlates of violent crime, including the prevalence of weapons and illicit drugs, the number of alcohol outlets in a community is significantly associated with assaultive violence. The number of alcohol outlets in a census tract was significantly related to robbery, assault, and sexual offenses. The relationship with alcohol outlets and homicide is in a positive direction, but statistically insignificant. A comparison between on-premise outlets and off-premise outlets and violent crime revealed significant association between both types of outlets and robbery. On premise and off-premise outlets are positively, but non-significantly, associated with assault, homicide, and sexual offenses. The minimal difference in effect of on-premise outlets between robberies and assaults may be a consequence of the limited number of observations.
In context of the alcohol outlet density-violent crime association literature,6,7,11–17 the findings from this current study are in accord with the fundamental association between alcohol outlet density and violent crime. Unlike the larger body of work, yet similar to a limited number of studies,3,14,26 the results from this study engage a focus on the aggregate components of violent crime (i.e. homicide, robbery, assault, and sexual offense) across alcohol outlet type (i..e on-premise and off-premise).The initial work done on this topic, and in the same study site, provided a descriptive study characterizing the spatial patterns of alcohol outlets and found that off-premise consumption outlets were heavily concentrated among African-American communities.3 A second study, in Miami, Florida, focused on the relationship between alcohol outlet density and the violent crimes of robbery and assault among racial/ethnic populations (i.e. African-American and Latino).14 This study found a significant association between outlet density and the violent crimes of robbery and assault among the Latino population, but not the African-American population. The latter finding was likely a consequence of the predominate Latino study site. A final study, also in the District of Columbia, examined the stratified relationship of on-premise and off-premise outlets with assaults and found a significant association between on-premise outlets and assaults.26 The lack of an association between off-premise outlets and assaults is contrary to the literature.6,45,46
In comparison to the latter two studies, the findings from the current research either identified a relationship between total outlets (i.e. on-premise and off-premise) and the violent crimes of robbery and assault14 or identified a significant association between on-premise outlets and a violent crime component, yet a lack of an association between off-premise outlets and a violent crime component.26 In contrast yet complementary, the current research found a significant association between alcohol outlet density and the violent crimes of robbery and assault among a predominantly African-American population.14 A similarly distinguishable finding is the association between on-premise outlets and the violent crime of robbery.26 The lack of an association between off-premise outlets and assault is likely a result of a large proportion (i.e. 70%) of the observations consisting of on-premise outlets. Given that total outlets are consistently associated with assaults and past research has found the same,6,45,46 this relationship may be a reflection of the location characteristics of the facility, regardless of outlet type. More severe types of violent crime, such as assault and homicide, tend to occur in more socially deprived communities.30,33,47
The findings pose unique and dangerous implications for minority concentrated or economically disadvantaged communities, unique because the most deprived communities have substantially higher densities of alcohol outlets, compared to the least deprived communities; yet the least deprived communities are associated with the heaviest alcohol consumption.22 As indicated in the results of this study, net of additional correlates of crime, alcohol outlet density is significantly associated with violent outcomes.13,48,49 Although violence is a dangerous outcome for any community, the results suggest that the effects may differ depending on the socioeconomic context and the type of alcohol outlet facility. The magnitude and sustainability of alcohol-related effects, such as violence, tend to be disproportionately greater among economically disadvantaged populations,30,33,46,47 which may ultimately result in dangerous outcomes of an equivalent magnitude.50,51
LIMITATIONS
The study findings should be considered in light of the following limitations. The cross-sectional nature of the study design precludes any insight to the causal direction of the alcohol availability-violent crime relationship. The number of observations (i.e., census tracts) limits an extensive characterization of the dependent and independent variables, which impedes a further specification of the alcohol assaultive violence dynamic. Although less of a concern for frequently occurring crimes such as assault and robbery, violent crime outcomes were aggregated over a one-year period and the stratified associations should be viewed with caution. The violent crime outcomes were aggregated over a one-year period. The latter is further challenged by the use of secondary data, which, in many instances, has been collected for administrative purposes and not basic research. Although individual outcomes cannot be inferred from group-level measures, alcohol-related outcomes are an independent by-product of the structural context and the individual.18
CONCLUSION
In Washington, D.C., alcohol outlet density is significantly associated with the violent crimes of assault and robbery. Arguably, the established science regarding the disproportionate exposure to and consequences of alcohol outlet densities among poor urban and minority communities underscores the urgency for and utility of effective policies designed to regulate outlet densities. Notwithstanding the urgency, it is equally important to understand that policies designed to regulate outlet densities cannot treat all communities as if the alcohol outlet density-violent crime relationship has an equivalent effect across all communities. The findings compel further research to examine community structural characteristics and their differential translation of effective and accommodating policy prescriptions.
Footnotes
Supervising Section Editor: Monica H. Swahn, PhD
Submission history: Submitted March 1, 2010; Revision Received April 26, 2010; Accepted April 27, 2010
Full text available through open access at http://escholarship.org/uc/uciem_westjem
Address for Correspondence: Frank A. Franklin, II, PhD, MPH, Satcher Health Leadership Institute, Department of Community Health and Preventive Medicine, Morehouse School of Medicine, 720 Westview Drive, SW, NCPC Suite 238, Atlanta, GA 30310-1495
Email: FFranklin@msm.edu
Conflicts of Interest: By the WestJEM article submission agreement, all authors are required to disclose all affiliations, funding sources, and financial or management relationships that could be perceived as potential sources of bias. The authors disclosed none.
REFERENCES
1. Greenfeld LA. Alcohol and Crime: An Analysis of National Data on the Prevalence of Alcohol Involvement in Crime. Washington, D.C: U.S. Department of Justice; 1998.
2. Bureau of Justice Statistics Criminal Victimization in the United States, 2006 Statistical Tables.Washington, D.C.: US Department of Justice, Office of Justice Programs, BJS; 2010. Report No.: NCJ 223436. (Criminal Victimization in the Unite States Series;vol.
3. Dawkins MP, Farrell WC, Johnson JH. Spatial Patterns of Alcohol Outlets in the Washington, D.C. Black Coummunity. Proceedings of the Pennsylvania Academy of Science. 1979;53:89–97.
4. Corso PS, Mercy JA, Simon TR, Finkelstein EA, Miller TR. Medical Costs and Productive Losses Due to Interpersonal and Self-Directed Violence in the United States. Am J of Preven Med.2007;32(6):474–82.
5. Cherpitel CJ. Alcohol and Injuries Resulting From Violence: a Comparison of Emergency Room Samples From Two Regions of the U.S. J Addict. Dis. 1997;16(1):25–40. [PubMed]
6. Gorman DM, Speer PW, Labouvie EW, Subaiya AP. Risk of Assaultive Violence and Alcohol Availability in New Jersey. Am. J Pub Heal. 1998;88(1):97–100.
7. Gorman DM, Speer PW, Gruenewald PJ, Labouvie EW. Spatial Dynamics of Alcohol Availability, Neighborhood Structure and Violent Crime. J Stud Alcohol. 2001;62(5):628–36. [PubMed]
8. Zhang L, Wieczorek WF, Welte JW. The Nexus Between Alcohol and Violenct Crime. Alcohol Clin Exp Res. 1997;21:1264–71. [PubMed]
9. Parker RN, Auerhah K. Alcohol, Drugs, and Violence. Ann Rev of Socio. 1998;24:291–311.
10. Parker RN, Auerhah K. Smith MD, Zahn MA. A Sourcebook of Social Research. Thousand Oaks, CA: Sage; 1999. Drugs, Alcohol, and Homicide: Issues in Theory and Research; pp. 176–91.
11. Escobedo LG, Ortiz M. The Relationship Between Liquor Outlet Density and Injury and Violence in New Mexico. Accid Anal Prev. 2002;34(5):689–94. [PubMed]
12. Gyimah-Brempong Kwabena. Alcohol Availability and Crime: Evidence From Census Tract Data.Southern Economic J. 68(1):2–21.
13. Lipton R, Gruenewald P. The Spatial Dynamics of Violence and Alcohol Outlets. J Stud Alcohol.2002;63(2):187–95. [PubMed]
14. Nielsen AL, Martinez R, Lee MT. Alcohol, Ethnicity, and Violence: The Role of Alcohol Availability for Latino and Black Aggravated Assaults and Robberies. Sociol Quarterly.2005;46(3):479–502.
15. Scribner R, Cohen D, Kaplan S, Allen SH. Alcohol Availability and Homicide in New Orleans: Conceptual Considerations for Small Area Analysis of the Effect of Alcohol Outlet Density. J Stud Alcohol. 1999;60:310–6. [PubMed]
16. Scribner RA, Mackinnon DP, Dwyer JH. The Risk of Assaultive Violence and Alcohol Availability in Los-Angeles-County. Am J of Pub Heal. 1995;85(3):335–40.
17. Speer PW, Gorman DM, Labouvie EW, Ontkush MJ. Violent Crime and Alcohol Availability: Relationships in an Urban Community. J Pub Heal Policy. 1998;19(3):303–18.
18. Scribner RA, Cohen DA, Fisher W. Evidence of a Structural Effect for Alcohol Outlet Density: a Multilevel Analysis. Alcohol Clin Exp Res. 2000;24(2):188–95. [PubMed]
19. Watts RK, Rabow J. Alcohol Availability and Alcohol Related Problems in 213 California Cities.Alcoholism: Clinical and Experimental Research. 1983;7(1):47–58.
20. Alaniz ML. Alcohol Availability and Targeted Advertising in Racial/Ethnic Minority Communities. Alcohol Health and Research World. 1998;22(4):286–9. [PubMed]
21. Gorman DM, Speer PW. The Concentration of Liquor Outlets in an Economically Disadvantaged City in the Northeastern United States. Subst Use Misuse. 1997;32(14):2033–46. [PubMed]
22. Pollack CE, Cubbin C, Ahn D, Winkleby M. Neighbourhood Deprivation and Alcohol Consumption: Does the Availability of Alcohol Play a Role? Internat J of Epidemi. 2005;34:772–80.
23. LaVeist TA, Wallace JM., Jr Health Risk and Inequitable Distribution of Liquor Stores in African American Neighborhood. SocSci Med. 2000;51(4):613–7.
24. NCHS (National Center for Health Statistics) 2000. Health, United States. Public Health Service;
25. Toomey TL, Wagenaar AC. Policy Options for Prevention: The Case of Alcohol. J of Pub Heal Policy. 1999;20(2):192–213.
26. Roman CG, Reid SE, Bhati AS, Tereshchenko B. Alcohol Outlets as Attractors of Violence and Disorder. Washington, D.C: The Urban Institute; 2008. (Research for Safer Communities;vol.
27. Krivo LJ, Peterson RD. Extremely Disadvantaged Neighborhoods and Urban Crimes. Social Forces. 1996;75:619–50.
28. Livingston M. A Longitudinal Analysis of Alcohol Outlet Density and Assault. Alcohol-Clini and Experi Research. 2008;32(6):1074–9.
29. Gruenewald PJ. The Spatial Ecology of Alcohol Problems: Niche Theory and Assortative Drinking. Addiction. 2007;102(6):870–8. [PubMed]
30. Peterson RD, Krivo LJ, Harris MA. Disadvantage and Neighborhood Violent Crime: Do Local Institutions Matter? J of Research in Crime and Delinquency. 2000;37(No. 1):31–63.
31. Sampson RJ, Groves WB. Community Structure and Crime: Testing Social-Disorganization Theory. Am J of Sociol. 1989;94:774–802.
32. Stark R. Deviant Places: A Theory of the Ecology of Crime. Criminology. 1987;25(No 4):893–909.
33. Sampson RJ, Raudenbush SW, Earls F. Neighborhoods and Violent Crime: a Multilevel Study of Collective Efficacy. Science. 8-15-1997;277(5328):918–24. [PubMed]
34. Wilson WJ. The Truly Disadvantaged: The Inner City, The Underclass, and Public Policy. Chicago, IL: University of Chicago Press; 1987.
35. Mincy RB, Sawhill IV, Wolf DA. The Underclass: Definition and Measurement. Science.1990;248:450–3. [PubMed]
36. Ross CE, Mirowsky J. Neighborhood Disadvantage, Disorder, and Health. J Health Soc. Behav.2001;42(3):258–76. [PubMed]
37. Hill TD, Angel RJ. Neighborhood Disorder, Psycholoical Distress, and Heavy Drinking. Social Science and Medicine. 2005;61:965–75. [PubMed]
38. Ross CE, Jang SJ. Neighborhood Disorder, Fear, and Mistrust: the Buffering Role of Social Ties With Neighbors. Am J Community Psychol. 2000;28(4):401–20. [PubMed]
39. Parker KF, Maggard SR. Structural Theories and Race-Specific Drug Arrests: What Structural Factors Account for the Rise in Race-Specific Drug Arrests Over Time? Crime & Deliquency.2005;51(4):521–47.
40. Feise RJ. Do Multiple Outcome Measures Require P-Value Adjustment? BMC Medical Research Methodology. 2002;2(8)
41. Sidak Z. Rectangular Confidence Region for the Means of Multivariate Normal Distributions. J of the Am Statis Assoc. 1967;62(626):633.
42. Anselin L. Local Indicators of Spatial Association-LISA. Geographical Analysis. 1995;27(2):93–115.
43. Moran P. The Interpretation of Statistical Maps. J Royal Statistical Society. 1948;10(Series B):243–51.
44. Gardner W, Mulvey EP, Shaw EC. Regression Analyses of Counts and Rates: Poisson, Overdispersed Poisson, and Negative Binomial Models. Psychological Bulletin. 1995;118(3):392–404. [PubMed]
45. Alaniz ML, Cartmill RS, Parker RN. Immigrants and Violence: The Importance of Neighborhood Context. Hispanic J of Behavi Sci. 1998;20:155–74.
46. Gruenewald PJ, Freisthler B, Remer L, LaScala EA, Treno A. Ecological Models of Alcohol Outlets and Violent Assaults: Crime Potentials and Geospatial Analysis. Addiction. 2006;101(5):666–77.[PubMed]
47. Kawachi I, Kennedy BP, Wilkinson RG. Crime: Social Disorganization and Relative Deprivation.Soc Sci Med. 1999;48(6):719–31. [PubMed]
48. Gorman DM, Zhu L, Horel S. Drug “Hot-Spots’, Alcohol Availability and Violence. Drug and Alcohol Rev. 2005;(24):507–13. [PubMed]
49. Tatlow JR, Clapp J, Hohman MM. The Relationship Between the Geographic Density of Alcohol Outlets and Alcohol-Related Hospital Admissions in San Diego County. J Com Heal. 2000;25(1):79–88.
50. Caetano R, Clark CL. Trends in Alcohol-Related Problems Amon Whites, Blacks, and Hispanics: 1984–1995. Alcohl: Clini and Experi Research. 1998;22:534–8.
51. Jones-Webb R. Alcohol-Related Problems Among Black, Hispanic and White Men: The Contribution of Neighborhood Poverty. J of Studies on Alcohol. 1997;58(5):539–45.