
| Author | Affiliation |
|---|---|
| M. Gabriela Sava, PhD | Clemson University, Department of Management, Clemson, South Carolina |
| Ronald G. Pirrallo, MD | University of South Carolina School of Medicine Greenville, Department of Emergency Medicine, Greenville, South Carolina |
| Brian C. Helsel, PhD | University of Kansas Medical Center, Department of Internal Medicine, Kansas City, Kansas |
| Jingyuan Tian, MS | Clemson University, Department of Management, Clemson, South Carolina |
| Patricia Carbajales-Dale, MS | Clemson University, Center for Geospatial Technologies, Clemson, South Carolina |
| Kuang-Ching Wang, PhD | Clemson University, Department of Electrical and Computer Engineering, Clemson, South Carolina |
| John Bruch, MD | University of South Carolina School of Medicine Greenville, Department of Internal Medicine, Greenville, South Carolina |
| Ronald W. Gimbel, PhD | Clemson University, Department of Public Health Sciences, Clemson, South Carolina |
Introduction
Methods
Results
Discussion
Limitations
Conclusion
ABSTRACT
Introduction
The purpose of this study was to characterize the at-risk diabetes and prediabetes patient population visiting emergency department (ED) and urgent care (UC) centers in upstate South Carolina.
Methods
We conducted this retrospective study at the largest non-profit healthcare system in South Carolina, using electronic health record (EHR) data of patients who had an ED or UC visit between February 2, 2016–July 31, 2018. Key variables including International Classification of Diseases, 10th Revision codes, laboratory test results, family history, medication, and demographic characteristics were used to classify the patients as healthy, having prediabetes, having diabetes, being at-risk for prediabetes, or being at-risk for diabetes. Patients who were known to have diabetes were classified further as having controlled diabetes, management challenged, or uncontrolled diabetes. Population analysis was stratified by the patient’s annual number of ED/UC visits.
Results
The risk stratification revealed 4.58% unique patients with unrecognized diabetes and 10.34% of the known patients with diabetes considered to be suboptimally controlled. Patients identified as diabetes management challenged had more ED/UC visits. Of note, 33.95% of the patients had unrecognized prediabetes/diabetes risk factors identified during their ED/UC with 87.95% having some form of healthcare insurance.
Conclusion
This study supports the idea that a single ED/UC unscheduled visit can identify individuals with unrecognized diabetes and an at-risk prediabetes population using EHR data. A patient’s ED/UC visit, regardless of their primary reason for seeking care, may be an opportunity to provide early identification and diabetes disease management enrollment to augment the medical care of our community.
INTRODUCTION
Evidence continues to support preventive services as one solution to reducing patient morbidity and mortality and decreasing healthcare system demands and costs.1,2 Appropriately, healthcare system decision-makers have shifted their focus toward preventive screening, early detection, and management of chronic diseases such as diabetes. The US Centers for Disease Control and Prevention (CDC) reports 30.3 million Americans (9.4%) have diabetes and another 84.1 million (33.9%) have prediabetes.3 South Carolina ranks seventh highest in the nation for an adult population with diabetes, and approximately 1 in 6 African-Americans living in South Carolina have diabetes.4 In addition, the emergency department (ED) and urgent care (UC) patient population is known to have a high prevalence of diabetes risk factors and undiagnosed diabetes.5 As an episodic and unscheduled access point into the US healthcare system, an ED or UC visit is an ideal location for acute disease management and public health surveillance of a community’s burden with diabetes.
Prior research demonstrates that ED diabetes surveillance protocols using only random, blood glucose measurements have been successful.6-10 Patient characteristics, such as demographics,11 body mass index (BMI), family history, comorbidities, and laboratory measures of impaired glucose tolerance, hemoglobin A1c (HbA1c), cholesterol, and triglycerides, can be used to refine a screening decision for diabetes. Confirmatory testing such as fasting plasma glucose, oral glucose tolerance testing, or HbA1C should be considered for definitive diabetes diagnosis.
The adoption of a healthcare systemwide, patient electronic health record (EHR) makes it possible to use dynamic and continuous patient data inquiry for real-time clinical decision-making. Decision-making heuristics and algorithms are being advanced to help notify and advise clinicians of an at-risk patient. In addition, as ED clinicians continue to expand their scope of practice toward early detection and morbidity reduction, exampled by successful human immunodeficiency virus12 and opioid-misuse screening,13 understanding the characteristics of an at-risk population is paramount.
In a proof-of-concept data exploration and risk classification study, we sought to describe the at-risk population for prediabetes and diabetes and those with suboptimally controlled diabetes in the general ED and UC population in upstate South Carolina. Using clinical classification rules based on variables commonly collected in a patient’s EHR and the American Diabetes Association (ADA) Standards of Medical Care in Diabetes,14 we described the characteristics of the broad at-risk diabetes patient population that may not otherwise interact with the healthcare system. Additionally, we geographically mapped the at-risk population to reveal where resources such as primary care clinics or chronic disease management programs access should be focused and allocated.
METHODS
This was a retrospective descriptive study of a single healthcare system’s EHR containing data on patients who presented to the ED or UC centers of the study location, a health system in South Carolina between February 2, 2016–July 31, 2018. The health system provides comprehensive healthcare for the 11 counties in upstate South Carolina serving a population of 1.4 million and is the region’s largest health system. The study location’s department of emergency medicine includes seven hospital-based EDs and six UC centers. The hospital-based EDs range from rural access hospitals to an academic American College of Surgeons-verified Level I trauma center that, in total, serve more than 360,000 emergent patients annually. The six UC centers are open 16 hours each weekday with 14 hours of weekend hourly coverage seeing approximately 100,000 patients annually. The health system’s institutional review board determined this study not to constitute human subjects research.
Population Health Research Capsule
What do we already know about this issue?
Prior research demonstrates that emergency department (ED) diabetes surveillance protocols using random blood glucose measurements have been successful.
What was the research question?
Our goal was to characterize the at-risk diabetes and prediabetes patient population visiting ED and urgent care (UC) centers in upstate South Carolina.
What was the major finding of the study?
A single ED/UC unscheduled visit can identify individuals with unrecognized diabetes and an at-risk prediabetes using electronic health records data.
How does this improve population health?
A patient’s ED/UC visit, independent of the reason, may be an opportunity to provide early identification and diabetes disease management enrollment.
Study Population
For all patients 18 years of age and older, their ED and UC visits were considered a sentinel event to query diabetes-specific screening variables included in the EHR. For patients with multiple visits, only the most recent visit was considered for their risk classification and labeling. Data were extracted from the EHR based on a predetermined set of variables selected by the researchers. These variables contained a preset data code that healthcare system report writers aggregated to generate the final subject dataset for analysis. All reports generated by the report writers were merged using a patient identifier as a linking pin and then de-identified for our analysis. The healthcare system report writers were blinded to the study purpose and hypothesis development.
The anonymized data used to define the risk classification included the following: a) patient demographics; b) insurance status; c) ED/UC visit acquired or previously entered laboratory results: glucose, HbA1C, triglycerides, high-density lipoprotein cholesterol; (d) presence of 12 classes of diabetes-related medication, oral or injectable; (e) problem list, entered by the healthcare providers; (f) self-reported diabetes-related family history; and g) diabetes-related diagnosis and International Classification of Diseases, 10th Revision (ICD-10) codes. We performed data processing and classification using Microsoft Excel 2016 (Microsoft Corporation, Redmond, WA) and Stata package v 14.2 (StataCorp, College Station, TX).
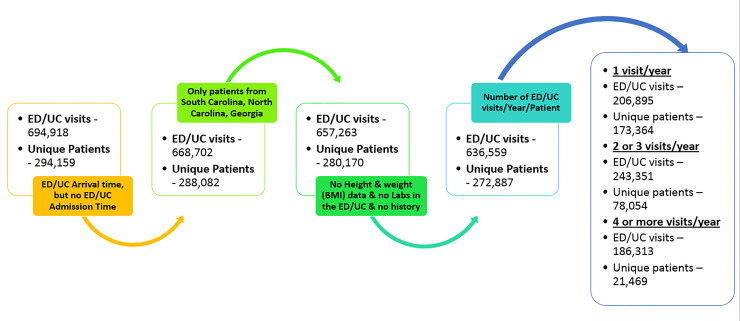
Figure 1 describes the data processing elimination rules used to identify the patient subpopulations with one, two or three, or more than four ED/UC visits/year. Patients with incomplete information regarding ED/UC admission date, BMI, laboratory results, past medical history, and patients who resided in other states than South Carolina, North Carolina, and Georgia were sequentially eliminated from the original data pool. To further homogenize the patient population for analysis, we grouped patients into one of three categories based on their total number of ED visits within our time horizon. These subpopulations were used to further define the risk classification of the patients and to explore the differences as a function of ED/UC utilization.
Risk Classification Rules
Using only EHR information, we classified each patient based on modified ADA screening guidelines14 and the study location’s definitions for diabetes chronic disease management. Previous diabetes diagnosis, ICD-10 diabetes-related codes, diabetes-related problems on the patient problem list, family history, past laboratory values, or hypoglycemic medications were all considered equivalent for labeling purposes. We determined final patient risk classifications using the decision-making process presented in Figure 2.
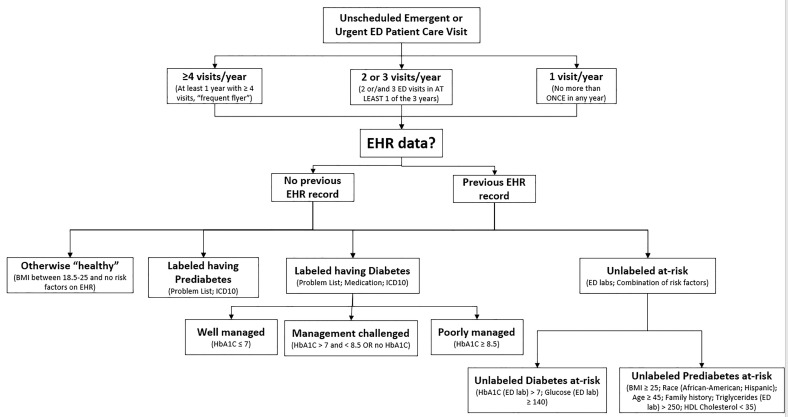
The four main classes of patients and their classification rules included the following:
Otherwise “healthy”: no prediabetes or diabetes diagnosis or characteristics that indicate a negligible risk of acquiring the disease.
Classification rules:
IF patient has BMI < 25 and NO risk factors as per the ADA screening guidelines.14
Labeled having prediabetes: diagnosis present.
Classification rules:
IF patient has (1) the ICD-10 code R73 present OR (2) problem list indicates the diagnosis.
Labeled having diabetes: diagnosis present and disease management recorded.
Classification rules:
IF patient has (1) one of the ICD-10 codes E08, E09, E10, E11, E13, O24 present OR (2) problem list indicates the diagnosis OR (3) diabetes medication prescribed, oral or injectable.
3.1. Well managed: HbA1C value present and ≤ 7%.
Classification rules:
IF HbA1C test value ≤ 7% (1) during the ED/UC visit OR (2) from the EHR.
3.2. Management challenged: no HbA1C value or value between 7% and 8.5%.
Classification rules:
IF the patient HbA1C test value is between 7% and 8.5% (1) during the ED/UC visit OR (2) from the EHR OR (3) no record of the test exists.
3.3. Poorly managed: HbA1c ≥ 8.5%.
Classification rules:
IF the patient HbA1C test value ≥ 8.5% (1) during the ED/UC visit OR (2) from the EHR.
Unlabeled at-risk: undiagnosed prediabetes or diabetes with at-risk characteristics.
4.1. Unlabeled diabetes at-risk: tests values during the ED/UC visit outside the normal range.
Classification rules:
IF the patient (1) HbA1C test value > 7% during the ED/UC visit OR (2) glucose test value ≥ 140 milligrams per deciliter (mg/dL).
4.2. Unlabeled prediabetes at risk: combination of diabetes risk factors as per ADA screening guidelines.11
Classification rules:
IF the patient satisfies one of the following: (1) BMI ≥ 25 and race – African-American OR (2) BMI ≥ 25 and race – Hispanic OR (3) BMI ≥ 25 and Age ≥ 45 OR (4) BMI ≥ 25 and family history indicates: diabetes, diabetes type I, diabetes type II, gestational diabetes, diabetic kidney disease or metabolic syndrome OR (5) BMI ≥ 25 and triglycerides ≥ 25 mg/dL test values from ED/UC or EHR OR (6) BMI ≥ 25 and HDL cholesterol < 35 mg/dL test values from ED/UC.
IF a patient has no BMI, but one of the following combinations of risk factors: (1) race – African-American and age ≥ 45 OR (2) race – African-American and family history indicates diabetes-related diagnosis OR (3) race – African-American and triglycerides ≥ 250 mg/dL test values from ED/UC or HER OR (4) race – African-American and HDL cholesterol < 35 mg/dL test values from ED/UC OR (5) race – Hispanic and age ≥ 45 OR (6) race – Hispanic and family history indicates diabetes-related diagnosis OR (7) race – Hispanic and triglycerides ≥ 250 mg/dL test values from ED/UC or EHR OR (8) race – Hispanic and HDL cholesterol < 35 mg/dL test values from ED/UC.
Testing the Risk Classification Results Against the National Averages
Based on the classification described in Figure 2, we classified the proportion of patients captured by each category of interest. A post hoc test of appropriateness of the ED/UC sample data comparing the subpopulation of diabetes prevalence to national averages included a Z-test statistic. Nationally 7.17% of the population has diabetes, 2.23% have undiagnosed diabetes, and 33.90% are individuals with prediabetes.3
Risk Classification Mapping for Upstate South Carolina At-risk Population
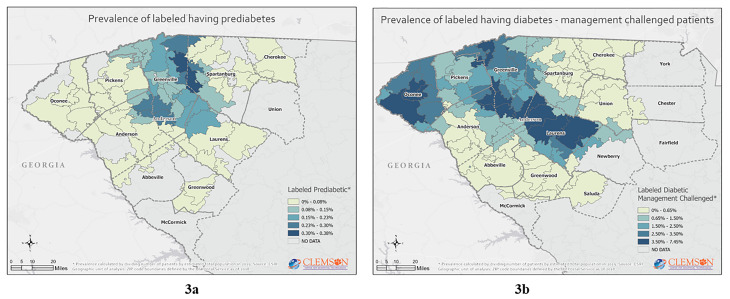
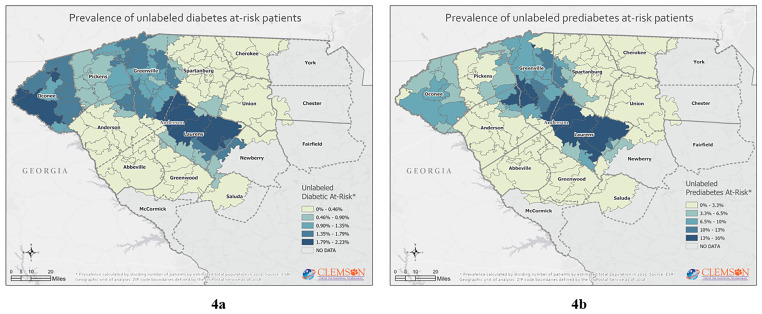
For mapping purposes, the ZIP codes used were self-reported by the patients during their ED/UC visit. No verification of the address was made to attest whether the patient resided at that address. We removed ZIP codes that corresponded to post office boxes, specific companies, or organizations. Patient data were then geocoded using ZIP code boundaries defined by the US Postal Service for 2018 and compiled by TomTom (TomTom International N.V., Amsterdam, Netherlands) in Esri format (Environmental Systems Research Institute, Redlands, CA).15 We calculated prevalence for each category by dividing the number of patients by estimated total population in that ZIP code for 2018. Population estimates were obtained from 2019–2024 Esri updated demographics.16 Once calculated, prevalence rates for each ZIP code in upstate South Carolina were represented using equal interval or natural breaks classification function of the distribution of the data. All maps presented were obtained using Esri’s ArcGIS software. Further, we analyzed the prevalence of labeled and unlabeled patients with diabetes as a function of race/ethnic background, which is known to be an important discriminating factor.11
RESULTS
Using the classification process described in Figure 2 and the risk classification rules, the following summary risk classification was obtained for each of the three subpopulations of interest (Table 1) and race/ethnic backgrounds. (Table 2).
Table 1Demographic and classification characteristics of the emergency department (ED) / urgent care (UC) patients.
| Variable | 1 ED/UC visit/year | 2 or 3 ED/UC visits/year | ≥ 4 ED/UC visits/year | Total |
|---|---|---|---|---|
| Number of unique patients | 173,364 (63.53) | 78,054 (28.60) | 21,469 (7.87) | 272,887 (100) |
| Gender | ||||
| Male | 80,457 (46.41)† | 33,420 (42.82) | 8,342 (38.86) | 122,219 (44.79)‡ |
| Female | 92,873 (53.57) | 44,629 (57.18) | 13,126 (61.14) | 150,628 (55.20) |
| Other | 34 (0.02) | 5 (<0.01) | 1 (<0.01) | 40 (0.01) |
| Race/Ethnicity | ||||
| White | 129,557 (74.73) | 58,517 (74.97) | 15,715 (73.20) | 203,789 (74.68) |
| African-American | 29,948 (17.27) | 15,098 (19.34) | 4,918 (22.91) | 49,964 (18.31) |
| Hispanic | 8,900 (5.13) | 2,894 (3.71) | 517 (2.41) | 12,311 (4.51) |
| Other§ | 4,959 (2.86) | 1,545 (1.98) | 319 (1.49) | 6,823 (2.50) |
| Age (years) | ||||
| < 20 | 7,427 (4.28) | 2,310 (2.96) | 389 (1.81) | 10,126 (3.71) |
| 20–39 | 64,304 (37.09) | 28,266 (36.21) | 7,692 (35.83) | 100,262 (36.74) |
| 40–59 | 56,348 (32.50) | 24,604 (31.52) | 6,806 (31.70) | 87,758 (32.16) |
| 60–79 | 36,796 (21.22) | 17,174 (22.00) | 4,744 (22.10) | 58,714 (21.52) |
| > 80 | 8,489 (4.90) | 5,700 (7.30) | 1,838 (8.56) | 16,027 (5.87) |
| Insurance | ||||
| Medicare** | 38,143 (22.00) | 21,225 (27.19) | 7,385 (34.40) | 66,753 (24.46) |
| Medicaid†† | 13,038 (7.52) | 8,288 (10.62) | 3,963 (18.46) | 25,289 (9.27) |
| Self-pay | 441 (0.25) | 230 (0.29) | 90 (0.42) | 761 (0.28) |
| Commercial‡‡ | 98,709 (56.94) | 40,871 (52.36) | 8,379 (39.03) | 147,959 (54.22) |
| Unknown | 23,033 (13.29) | 7,440 (9.53) | 1,652 (7.69) | 32,125 (11.77) |
| Risk Classification | ||||
| (1) Otherwise “healthy” | 92,744 (53.50) | 36,432 (46.68) | 8,014 (37.33) | 137,190 (50.27) |
| (2) Labeled having prediabetes | 529 (0.31) | 597 (0.76) | 304 (1.42) | 1,430 (0.52) |
| (3) Labeled having diabetes | 14,682 (8.47) | 10,143 (12.99) | 4,480 (20.87) | 29,305 (10.74) |
| (3.1) Well managed | 667 (0.38) | 529 (0.68) | 244 (1.14) | 1,440 (0.53) |
| (3.2) Management challenged | 13,442 (7.75) | 9,183 (11.76) | 4,027 (18.76) | 26,652 (9.77) |
| (3.3) Poorly managed | 705 (0.41) | 580 (0.74) | 274 (1.28) | 1,559 (0.57) |
| (4) Unlabeled at-risk | 65,452 (37.75) | 30,963 (39.67) | 8,732 (40.67) | 105,147 (38.53) |
| (4.1) Unlabeled diabetes at-risk | 8,349 (4.82) | 3,303 (4.23) | 853 (3.97) | 12,505 (4.58) |
| (4.2) Unlabeled prediabetes at-risk | 57,103 (32.94) | 27,660 (35.44) | 7,879 (36.70) | 92,642 (33.95) |
*Data are reported as n (%).
†% in columns 2, 3 and 4 are a calculated function of the total number of unique patients identified for each of the three subpopulations.
‡% in column 5 are a calculated function of the total number of unique patients identified in the data set.
§“Other” category includes American Indian or Alaska Native, Asian, biracial or multiracial, unknown, Native Hawaiian or other Pacific Islander, Patient refused, Other.
**Medicare and Medicare Advanced.
††Medicaid, Medicaid managed care organization, and pending Medicaid.
‡‡Commercial, Blue Cross, Liability, Managed Care, Tricare, Worker’s Comp, Other.
Table 2Prevalence of labeled and unlabeled patients with diabetes as a function of race/ethnicity.
| Total | % Per race category§§ | (3) % Labeled having diabetes*** | (4.1) % Unlabeled diabetes at-risk | Total diabetes patients | |
|---|---|---|---|---|---|
| Number of unique patients | 272,887 | 29,305 | 12,505 | 41,810 | |
| White | 203,789 | 74.68% | 10.39% | 4.75% | 15.13% |
| African-American | 49,964 | 18.31% | 13.05% | 5.20% | 18.25% |
| Hispanic | 12,311 | 4.51% | 8.37% | 5.15% | 13.52% |
| Others | 6,823 | 2.50% |
§§% are calculated as a function of the total number of unique patients.
***% calculated as a function of the race/ethnic categories of interest.
The Z-test statistic that compared the sample proportions to the national averages for all three subpopulations were significant (P-values < 0.05): labeled having diabetes, 95% confidence interval [CI], 10.62%–10.85%; unlabeled diabetes at-risk, 95% CI, 4.50%–4.66%; labeled having prediabetes, 95% CI, 34.29%–34.65%. Thus, the proportion of disease identified in the sample, for each category, is greater in upstate South Carolina than the reported national levels.
The mapping further identified the areas of highest prevalence of our at-risk population of interest, Figures 3 and 4.
DISCUSSION
This proof-of-concept study supports the idea that an ED/UC unscheduled visit can identify individuals with diabetes and at risk for diabetes in the population using EHR data. Our risk stratification revealed 4.58% unique patients with unrecognized diabetes, with 10.34% of the known individuals with diabetes considered to be suboptimally controlled. As expected, the patients posing diabetes management challenges had more ED/UC visits. Yet the percentage of unrecognized individuals with diabetes was similar across the patients with 1–3 or more ED/UC visits per year, around 4%. In addition, 33.95% of the patients had prediabetes risk factors identified during their ED/UC visit.
The prevalence of diabetes is known to be related to race/ethinicity11 of the population. Our data sample from upstate South Carolina demonstrates a disproportionate prevalence in the race categories, with 74.68% of our patients being White.11 And while our data are from an undifferentiated population that includes healthy and at-risk diabetes patients, our prevalence results of the disease identify similar race/ethnicity disparities compared to the national level. For example, our sample included 4.51% Hispanic, of whom 8.37% were labeled having diabetes and 5.15% were unlabeled patients at risk for diabetes. Our results may reflect other geographic and cultural characteristic present in South Carolina.
A patient’s ED or UC visit, regardless of their primary reason for seeking care, may be an opportunity to provide early identification and disease management enrollment to augment the healthcare safety net of the community. Collaboration with and referral to chronic disease management programs may be facilitated with the recognition that most of the patients in this community have some form of insurance, 87.95%.
When comparing the proportions obtained in the ED/UC sample data vs the national averages, we observed that indeed the sample proportions are higher. Even though the national averages tend to underestimate the disease prevalence for the areas with increased number of cases, the clinical definitions used to label our patients are more conservative than the ones used to generate the national averages.3 Thus, our estimate is conservative.
Not surprising, the mapping suggests that social determinants of health may influence where the at-risk prediabetes and diabetes population resides. Linkages with our dataset to other public health surveillance, economic, educational, and demographic data sources may further inform decision-makers on the best interventions to pursue.17 Our data suggest no single demographic-, geographic- or socioeconomic-focused intervention will likely be successful to reduce diabetes prevalence in upstate South Carolina.
The automated identification by the EHR system of an at-risk patient, based on his/her characteristics, could inform the healthcare provider to start an early detection or diseases management improvement process for that individual patient. The future ED/UC role may include identification of the at-risk patients who could benefit from an unscheduled preventive screening for diabetes, ordering a screening HbA1c test, and then referring these patients to a diabetes prevention program or self-management program. This initial ED/UC visit integrated with a referral and follow-up procedure may improve patient care access with minimal ED resource utilization. This study did not evaluate whether integrating such a screening program into the ED/UC system would potentially adversely affect patient flow or assess clinician adoption even with an EHR warning.
LIMITATIONS
As a retrospective, risk-stratification study, several limitations should be noted. First, the data were collected from the EHR of a single healthcare system in a region of the country with a known high prevalence of the target disease, diabetes. Patients may have been members of another healthcare system that did not share data with the study location. The results obtained may not be generalizable to other geographic regions of the United States. Second, our classification and labeling of the patients was based on limited clinical, demographic, pharmaceutical, and laboratory information, with no confirmatory or fasting tests performed in a non-acute setting. Race and ethnicity were gleaned from the EHR that is generated upon patient registration and are self-reported. We did not use the current ADA standard glycemic values for diabetes; rather, we set the threshold higher due to the unscheduled acute setting. Additionally, it is recognized that hypoglycemic medications are used to treat diseases other than diabetes.
Finally, and as with any large dataset, missing and misaligned data points recorded in the EHR from multiple databases were not tested for bias. We focused our analysis only on the last known ED/UC visit, augmented with historical medical data, with 0.067% of the patients categorized in multiple classes and kept in the dataset.
CONCLUSION
This proof-of-concept model shows the potential of incorporating clinical decision-making rules via advanced data analytics algorithms into the ED/UC EHR to identify an at-risk population for diabetes. The geographic information system mapping of EHR clinical data with other public datasets may further inform decision-makers of where and how interventions should be crafted to address this complex disease. The proposed preventive screening program may be most beneficial in areas where limited healthcare access exists, but where community healthcare agents are well established. This will ensure that the proposed follow-up mechanism of the referral from the ED/UC to a community-based diabetes program will be successful. Future work will need to address the development of a clinician-adoptable, real-time predictive model and evaluate patient post-visit resources required to improve the health of individuals and our community in a region of the country with a high prevalence of diabetes.
Footnotes
Section Editor: Jacob Manteuffel, MD
Full text available through open access at http://escholarship.org/uc/uciem_westjem
Address for Correspondence: M Gabriela SAVA, PhD, Clemson University, Wilbur O. and Ann Powers College of Business, 420D Powers Hall, 225 Walter T Cox Blvd, Clemson, SC, 29634. Email: msava@clemson.edu. 5 / 2021; 22:636 – 643
Submission history: Revision received August 3, 2020; Submitted December 8, 2020; Accepted December 23, 2020
Conflicts of Interest: By the WestJEM article submission agreement, all authors are required to disclose all affiliations, funding sources and financial or management relationships that could be perceived as potential sources of bias. M. Gabriela Sava, Ronald G. Pirrallo, Kuang-Ching Wang and John Burch have been awarded the 2018 Greenville Health System Health Sciences Center Seed Grant. No other author has professional or financial relationships with any companies that are relevant to this study. There are no other conflicts of interest or sources of funding to declare.
REFERENCES
1. Fries JF, Koop CE, Beadle CE, et al. Reducing health care costs by reducing the need and demand for medical services. N Engl J Med. 1993;329(5):321-5.
2. Maciosek MV, Coffield AB, Flottermesch TJ, et al. Greater use of preventive services in U.S. health care could save lives at little or not cost. Health Aff. 2010;29(9):1656-60.
3. National Diabetes Statistics Report. 2017.
4. Diabetes in South Carolina, Fact Sheet. 2016. Available at: https://www.scdhec.gov/sites/default/files/Library/ML-025328.pdf. Accessed April 15, 2019.
5. Ginde AA, Cagliero E, Nathan DM, et al. Point-of-care glucose and hemoglobin A1c in emergency department patients without known diabetes: implications for opportunistic screening. Acad Emerg Med. 2008;15(12):1241-7.
6. Hng TM, Hor A, Ravi S, et al. Diabetes case finding in the emergency department, using HbA1c: an opportunity to improve diabetes detection, prevention, and care. BMJ Open Diabetes Res Care. 2016;4(1):1-4.
7. BarDayan Y, Zilberman I, Boaz M, et al. Prevalence of undiagnosed hyperglycaemia in patients presenting to the department of emergency medicine with no known history of diabetes. Int J Clin Pract. 2016;70(9):771-4.
8. Charfen MA, Ipp E, Kaji AH, et al. Detection of undiagnosed diabetes and prediabetic states in high-risk emergency department patients. Acad Emerg Med. 2009;16(5):394-402.
9. Gomez-Peralta F, Abreu C, Andreu-Urioste L, et al. Point-of-care capillary HbA1c measurement in the emergency department: a useful tool to detect unrecognized and uncontrolled diabetes. Int J Emerg Med. 2016;9(1):7.
10. Silverman RA, Schleicher MG, Valente CJ, et al. Prevalence of undiagnosed dysglycemia in an emergency department observation unit. Diabetes Metab Res Rev. 2016;32(1):2-86.
11. Cheng YJ, Kanaya AM, Araneta MRG, et al. Prevalence of diabetes by race and ethnicity in the United States, 2011–2016. JAMA. 2019;322(24):2389-98.
12. Haukoos JS, Hopkins E, Byyny RL. Patient acceptance of rapid HIV testing practices in an urban emergency department: assessment of the 2006 CDC recommendations for HIV screening in health care settings. Ann Emerg Med. 2008;51(3):303-9.
13. D’Onofrio G, O’Connor PG, Pantalon MV, et al. Emergency department-initiated buprenorphine/naloxone treatment for opioid dependence: a randomized clinical trial. JAMA. 2015;313(16):1636-44.
14. Classification and diagnosis of diabetes: standards of medical care in diabetes. Diabetes Care. 2018;41(Suppl 1):S13-S27.
15. United States ZIP Code Boundaries. 2018. Available at: https://www.arcgis.com/home/item.html?id=0a2fde8aa7404187917488bafcbc77e6. Accessed April 19, 2020.
16. Demographics. 2020. Available at: https://doc.arcgis.com/en/esri-demographics/data/updated-demographics.htm. Accessed April 19, 2020.
17. Young K. Black barbershops could ID undiagnosed diabetes. 2020. Available at: https://www.jwatch.org/fw116286/2020/01/28/black-barbershops-could-id-undiagnosed-diabetes. Accessed April 19, 2020.