
| Author | Affiliation |
|---|---|
| R. Myles Riner, MD | Director of Provider Relations, CEP America |
INTRODUCTION
Researchers and consultants have promoted expansion of Medi-Cal managed-care (MCMC) to additional Medi-Cal beneficiaries currently covered under the Medi-Cal Fee-for-Service (FFS) program to achieve greater cost efficiency and quality of care. Proponents have also promoted MCMC as a cost-effective way to expand state-subsidized health insurance for many of the State’s 6.5 million uninsured,1 even though claims of this cost effectiveness have been disputed.2 This paper presents data that challenge the cost effectiveness of MCMC, and suggests that cost savings may actually represent cost shifting to the Medi-Cal FFS system. This in turn places an unfair burden on emergency physicians and other fee-for-service Medi-Cal providers. This cost shifting appears to have been facilitated by the unique manner in which MCMC has been implemented, allowing health plans to not enroll or dis-enroll the most costly beneficiaries without a concomitant adjustment in the state’s per-member-per-month capitation payments. Because of the highly skewed distribution of the cost of care, shifting even a small number of high-cost patients from a MCMC health plan into the Fee-for-Service program allows these plans to falsely promote the reduced monthly cost of care per enrollee as the result of cost-effective care management.
Of the 6.62 million Medi-Cal enrollees in the fiscal year 2007–08, 3.33 million were enrolled in MCMC, which receives $6.06 billion of the $33.98 billion total Medi-Cal budget. Even a small overestimate in the monthly cost per member used to calculate capitation rates has a large aggregate financial impact, easily reaching hundreds of millions of dollars annually. Ever since the Medi-Cal program began shifting its beneficiaries into MCMC in 1994, numerous claims have been made regarding the beneficial fiscal impact of the managed-care model on program expenditures.3Organizations such as the California Legislative Analyst’s Office4 and the Little Hoover Commission have touted the ability of MCMC to contain costs. Based on these assertions, MCMC proponents have recently introduced state legislation (SB 1332) to expand MCMC enrollment for aged, blind and disabled (ABD) populations, many of whom are prime candidates for dis-enrollment and carve-out cost shifting once per member per month (PMPM) capitation payments are set. However, there is little evidence that substantiates anticipated savings in the Medi-Cal program. In Appendix A (all appendixes are available online as a related file athttp://repositories.cdlib.org/uciem/westjem/vol10/iss2/art17/), the author assesses the validity of the claims in support of, and challenging, managed-care cost effectiveness in California and elsewhere in the country.
The Skewing of Cost Distribution in Medi-Cal
Selection bias in managed-care is a systematic assignment of beneficiaries to a health plan based on health needs. The Medi-Cal program employs a methodology for setting capitation rates based on the average per capita cost of the eligibility cohort or population to which each beneficiary belongs. If, however, the population actually enrolled is healthier and therefore less expensive than the estimates for the eligible population as a whole (risk-averse selection), the plan benefits. Economists have studied the distribution of healthcare costs within populations and consistently found, both over time and across patient groups, that medical spending tends to be highly concentrated among a small percentage of patients, rather than spread evenly through the population.5,6 This skewed cost distribution means that the departure of even a small number of high-cost patients can have a large impact on the average cost of care for the remaining population. This perverse disincentive also potentially discourages health plans from including the most qualified specialists in their provider networks, lest this attract potential enrollees with more complicated health problems. Appendix B reviews the relevant literature on the distribution of costs in healthcare populations.
Focusing on the Medi-Cal population, Thomas MaCurdy et al.7 found that, “Medi-Cal spending is extremely concentrated among a small segment of the enrollee population. An enormous share of all expenditures goes to a small number of cases; 60 percent of all Medi-Cal expenditures went to benefits for only five percent of the enrollees.” The same study noted a near absence of expenditures for services associated with the least expensive 25% of the Medi-Cal population.
The per capita cost method of calculating capitation rates used by Medi-Cal is similar to the methodology employed, and then abandoned, by the Medicare program during the 1990s. Then, actuaries discovered that the introduction of managed-care into the Medicare program led to the “favorable selection” of healthier and less expensive beneficiaries into health plans, and subsequent overpayments to these plans.8 Since the same conditions appear to exist in MCMC as did in Medicare, this should cause concern over the possibility that MCMC plans might be receiving an inappropriately higher allocation of limited Medi-Cal program funds. Appendix C reviews the Medicare experience with risk adjustment of Medicare managed-care capitation rates.
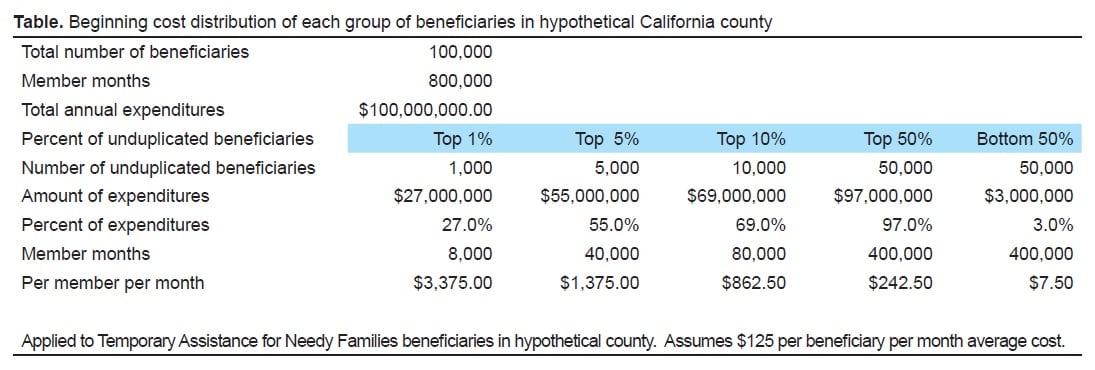
To understand the impact of the skewing of costs in the Medi-Cal population, it may help to consider a hypothetical TANF (Temporary Aid to Needy Families) population of 200,000 Medi-Cal patients in a medium-sized California county. Assume an average cost of $125 PMPM, with eight months of average enrollment during the year, and total annual expenditures of $200 million. Next, assume that the patients are randomly assigned to two groups of 100,000 each, one enrolled in MCMC, and the other in the FFS program. Applying the distribution found by Berk and Monheit in 1996, and assuming a $125 average PMPM cost, the distribution of expenses for this hypothetical TANF patient population would appear as in the table in Exhibit Exhibit1.1. (Additional supporting tables for this illustration are in Appendix D).
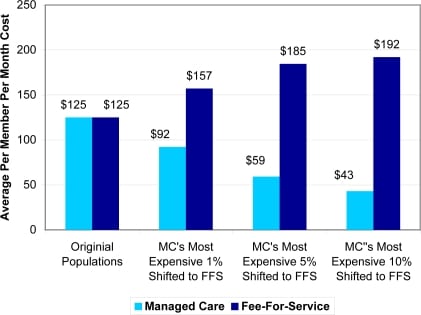
The shift of the most expensive 1% of patients (for example, those with chronic illnesses) out of MCMC and into FFS causes the average PMPM cost of the remaining population to decline 26% or $32, from $125 to $92 (Figure 1). Shifting the most expensive 10% reduces the PMPM cost of the remaining population to $43. The shifting of the most expensive 1% of patients to FFS causes the average PMPM cost of the expanded FFS population to increase by $32, from $125 to $157. Shifting the most expensive 10% increases the PMPM cost under FFS to $192. As this illustration demonstrates, the shifting of a very small number of high-cost beneficiaries from managed-care to FFS can drastically alter the average cost of both populations. To an observer unfamiliar with this phenomenon, it would be easy to mistakenly conclude that managed-care does hold down costs.
Aggregate payments to the managed-care program reflect the loss of member months as the most expensive patients are dis-enrolled. The PMPM rates, however, are not recalculated to reflect the reduced average cost of the population, and this significantly improves plan profitability, even though capitation rates paid to MCMC plans are reduced by 5% to build in some of the anticipated cost savings. For example, using a capitation rate set at $118.75, which is predicated on 95% of the original average PMPM cost of the population, the shifting of even the most expensive 1% of 100,000 beneficiaries originally enrolled in managed-care to FFS would result in an overpayment of $2.6 million a month, or $31.6 million a year. Unfortunately, these plans bank these unearned profits while the burden for the care of these patients is shifted to FFS providers at rates that are among the lowest in the country.9
Causes of Non-Enrollment in Mandatory Managed-care Enrollment Populations
During calendar year 2005, 1,120,964 Medi-Cal beneficiaries assigned to aid codes for which enrollment into a MCMC plan is mandatory were initially enrolled under the FFS model (47%), or subsequently moved from MCMC into FFS (53%). These are disturbing figures that may not have been appropriately considered in the determination of PMPM costs or capitation rates. Certainly, the previous illustration suggests that the cost-shifting impact of selection bias that eliminates one-fourth of all potential MCMC enrollees is likely to be huge. The reasons a mandatory beneficiary may not be enrolled, or may have dis-enrolled from a health plan, are described in Appendix E, and include logistical problems such as the patient changing counties or being homeless, pregnancy, chronic diseases such as HIV/AIDS or cardiomyopathy, current cancer therapy, consideration for organ transplant, or pending major surgical procedures. All of these would be expected to drive up the cost of care for these prospective MCMC beneficiaries.
There appear to be policy loopholes and incentives allowing or encouraging pregnant women to never enroll into MCMC plans, or to dis-enroll when they become pregnant or near delivery. (In 2005, 71% of deliveries were under FFS.) As a consequence, some MCMC plans had higher rates of deliveries relative to the rates of initial enrollment of pregnant women in MCMC than other plans, even though the administrative and demographic characteristics of the enrollees were equivalent. Having identified this discrepancy, Mercer and Associates,10 the actuarial consultant for the Department of Health Care Services, recommended that the Medi-Cal program implement a maternity supplemental payment to the plans to cover the cost of all deliveries to level the playing field. The department recently followed this recommendation, providing approximately $7000 in supplemental payments to MCMC plans for each delivery (which, perversely, may reverse the incentive and encourage MCMC providers to provide prenatal care under FFS and enroll these pregnant women into MCMC as they near term).
Low Rates of Managed-care Enrollment in Voluntary Populations
The rules determining enrollment of Medi-Cal beneficiaries into MCMC plans are based on the “Plan Model Type” of their county of eligibility. There are three major types of MCMC plans: 1) County Organized Health System (COHS), where there is one health plan run by a public agency and governed by an independent board. Nearly all Medi–Cal enrollees residing in the COHS are required to receive care from this system; 2) the Geographic Managed Care (GMC) system allows Medi–Cal beneficiaries to choose to enroll in one of many commercial health maintenance organizations (HMOs) operating in a county; and 3) the Two–Plan Model, which consists of counties where the department contracts with only two managed-care plans, one locally developed and operated, the other a commercial HMO, selected through a competitive bidding process. In the 12 “Two-plan” model counties and the two GMC counties, certain aid codes are considered “voluntary” for managed-care enrollment. Typically, beneficiaries in aid codes for the aged, blind and disabled are considered voluntary. Additionally, newborn babies with birth complications receiving care from the California Children’s Services (CCS), are often enrolled in aged, blind and disabled aid codes; and in that way, are not enrolled into MCMC. A disabled or presumptively disabled premature newborn is assigned to a disabled aid code. The premature beneficiary is then considered enrolled in FFS, not into MCMC. These enrollment rules enable many MCMC plans to manipulate enrollment and selectively limit their exposure to high-cost patients.
According to the Department of Health Care Services, enrollment data for beneficiaries assigned to voluntary aid codes reveal that a large proportion of the population is not enrolled into managed-care. To further complicate matters, only a small proportion of the mandatory population has enrolled into a MCMC delivery system. For example, while foster-care aid codes are considered mandatory, only 10 to 12 percent of this population enrolls into managed-care plans. Foster care children are much more likely to be afflicted with psychological disorders or behavioral problems and display PMPM costs that are as much as twice that of other children of similar age, gender, and ethnicity (source: DHCS Medical Care Statistics Section).
Capitation rates based on the average cost of a given population are effective when all members of the population enroll in a plan, but become less accurate and appropriate as increasing numbers dis-enroll. In the voluntary aid code population, where 85% of the potentially eligible beneficiaries may never enroll, the difference between the cost of the potentially eligible population and the population that actually enrolls is likely very great. This is especially true if the sickest members of the population never enroll, but remain in the FFS model. The recent decision to require quarterly re-enrollment of beneficiaries in California offers MCMC plans yet another avenue to selectively manipulate enrollment.
The Impact of “Carve-Out” or Excluded Services
Another argument for the greater cost efficiency of MCMC is the slower rate of increases in Medi-Cal capitation rates compared to other indicators of health cost inflation. Data show, for example, that Medi-Cal capitation rates have risen more slowly than the medical care component of the Consumer Price Index, or employer health-insurance premiums. Alluding to the implied cost effectiveness of MCMC, Mark Smith,11 president of the California Health Care Foundation, told a 2007 conference audience, “The growth of Medi-Cal Capitation Rates has been substantially less than commercial premiums.” While the figures may be accurate, the comparison itself is misleading. Not only does this comparison ignore the underlying age and health status differences of the populations being compared; it also ignores the difference in scope of services associated with these reported cost increases.
The Medi-Cal program places a wide range of services, known as “carve-outs,” outside the scope of its capitation payments to the managed-care plans for the purposes of rate setting and contractual service obligations. Medi-Cal patients who need these services must obtain them under traditional FFS arrangements and not through their plans. Carve-outs may include: CCS (California Children’s Services) payments; Rural Health Clinics/FQHC’s (Federally Qualified Health Clinic) wrap-around payments; Long-Term Care in Skilled Facilities; Nursing, drugs and services to patients receiving treatment for mental illness; treatment for HIV; and surgeries for organ transplantation. This process limits the exposure of the MCMC program to higher cost services, more expensive specialty care, and less predictable overhead.
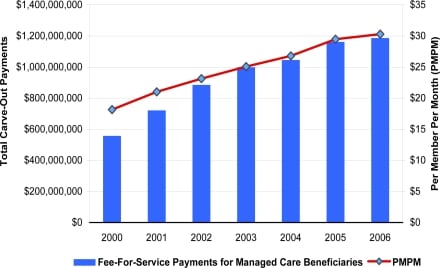
While capitation payments made to MCMC plans may not have increased as much as employer-based insurance premiums, the cost of the carved-out services that are excluded from capitation agreements with MCMC plans certainly have. Between 2000 and 2006, FFS payments for MCMC patients rose by 113%. Some of this increase reflects the 27% expansion of MCMC enrollment during this period. However, the PMPM cost of carved-out services also rose by 67%, indicating that on a per-person basis, carve-out costs rose by an average of 9.5% annually. In calendar year 2006, Fee-for-Service carve-out payments made by the Medi-Cal program on behalf of MCMC enrollees totaled slightly less than 1.2 billion dollars12 (Figure 2). Of these, $616 million, or 52%, were related to the CCS and the Genetically Handicapped Persons Program (GHPP). (See below).
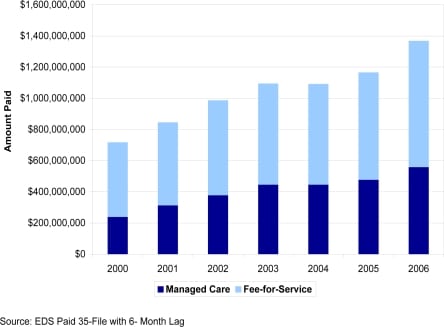
CCS is a statewide program that treats children with certain physical limitations and chronic health conditions or diseases. GHPP provides health coverage for Californians 21 and older who have specific genetic diseases, including cystic fibrosis, hemophilia, sickle cell disease, and certain neurological and metabolic diseases. GHPP also serves children under 21 with GHPP-eligible medical conditions who are not financially eligible for CCS. While it may have been assumed that services paid for by California Children’s Services (CCS) would remain static or fall in counties where managed-care has been introduced, MCMC plans have aggressively utilized CCS to provide care for premature and compromised infants, driving fee-for-service CCS payments for Managed Care beneficiaries from $230.2 million in the fiscal year 1999–2000 to $517.8 million in the fiscal year 2004–2005 (Figure 3).
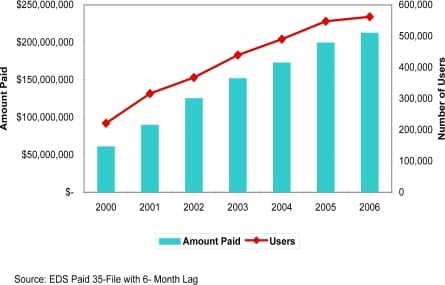
A FQHC is a community-based health organization that provides comprehensive primary care, dental and mental health/substance abuse services to underserved, underinsured and non-insured populations. FQHC carve-out payments represent 41% of the total cost of MCMC carve outs not related to CCS/GHPP. Under the federal Medicaid statute, when a contract between a managed-care organization and a FQHC results in the FQHC receiving less than the amount of reimbursement due under the FQHC prospective payment system (PPS), the state must make a supplemental “wrap-around” payment to the FQHC to make up for the difference the FQHC is owed. Between 2000 and 2006 there has been a dramatic increase in the use of FQHC providers by MCMC patients. During this period MCMC wrap-around payments increased by 211%, while the number of managed-care beneficiaries utilizing FQHCs increased by 154% (Figure 4).
The rapid increase in FQHC utilization by MCMC beneficiaries, which greatly outpaces the growth in MCMC enrollment, is worrisome for three reasons:
-
It suggests that there are inadequate numbers of non-clinic affiliated physicians and physician groups to enable the plans to form a primary care network for Medi-Cal beneficiaries.
-
Visits by managed-care patients to FQHC providers create millions of dollars in additional FFS carve-out expenditures that would not exist if the health plans were able to contract with non-FQHC affiliated physicians and physician groups.
-
While Medi-Cal would still be required to pay the higher FQHC rate for services incurred at clinics under a FFS scenario, it would do so without, in addition, paying a portion of a capitation rate to a health plan for these subcontracted primary care services. For the care of these patients, MCMC is ‘double dipping’ into a limited funding pool.
CONCLUSION
In light of the indicators of cost shifting identified in this review, the assertion that the MCMC program is cost effective is highly suspect. A number of questions need to be answered before program administrators can claim with confidence that billions of dollars in Medi-Cal funds are being properly allocated, and that expansion of these programs to cover other beneficiaries is indicated. These questions include but are not limited to:
-
What is the distribution of costs for mandatory enrollment code beneficiaries that remain in, or are excluded or dis-enrolled from, MCMC?
-
What is the risk-adjusted distribution of costs for voluntary enrollment codes that elect to enroll in MCMC vs. FFS?
-
When adjusted for risk, how do costs compare between MCMC and FFS enrollees?
-
What is the actual medical loss ratio for MCMC plans, after full consideration of all contracting plan and subcontracting provider group tiers in the MCMC model?
-
What percentage of pregnant managed-care enrollees are dis-enrolled prior to delivery?
-
What are the true costs of carved-out services?
-
Do certain mandatory aid code categories with higher relative cost risk have a lower rate of enrollment in MCMC?
-
How do risk-adjusted capitation payments affect Medicaid enrollment patterns, carve-outs, and provider networks?
The data presented here indicate that the MCMC program is subject to perverse incentives that adversely impact the Medi-Cal safety net. It is widely acknowledged that the average expenditure per enrollee in the Medi-Cal Program (California’s version of Medicaid) is one of the lowest in the nation. FFS providers, especially those obligated under Emergency Medical Treatment and Active Labor Act (EMTALA) to provide emergency care, believe they have had to bear the increasing burden of caring for those patients who are maneuvered out of MCMC enrollment, in return for FFS payments that inevitably fail to cover the provider’s costs. The data presented suggest that expansive carve-outs, enrollment loopholes, and dis-enrollment incentives misdirect limited Medi-Cal program funds to plans and provider groups, rather than to the FFS providers that actually provide a disproportionate share of services to high-cost Medi-Cal beneficiaries. The magnitude of this shift easily approaches several hundred million dollars per year. This undermines the potential benefits of applying the managed-care concept to those that need management the most, and under-compensates providers that actually render services to these patients under fee-for-service.
Alternatively, aligning incentives through appropriate risk-adjustment of capitation rates by paying much higher cap rates 1) to cover services that are currently carved out, 2) for patients that are currently exempted from managed care, and 3) for higher cost patients that are currently being selectively not enrolled or dis-enrolled, and then closing these loopholes, could provide sufficient incentive for plans and capitated provider groups to actually focus on the cost-effective and innovative case management of these patients. This approach might also encourage plans to enhance their network of qualified providers to accomplish this goal, and reduce the program’s reliance on EMTALA-obligated FFS emergency care providers and expensive emergency department visits to meet these patients’ needs.
Footnotes
Supervising Section Editor: Mark I. Langdorf, MD, MHPE
Submission history: Submitted July 07, 2008; Revision Received January 12, 2009; Accepted January 14, 2009.
Full text available through open access at http://escholarship.org/uc/uciem_westjem
Address for Correspondence: R. Myles Riner, MD, FACEP, Director of Provider Relations for CEP America, 268 Princeton Ave., Mill Valley, CA 94941
Email: mriner@inreach.com
Conflicts of Interest: By the WestJEM article submission agreement, all authors are required to disclose all affiliations, funding sources, and financial or management relationships that could be perceived as potential sources of bias. Dr. R. Myles Riner is affiliated with CEP America as the Director of Provider Relations, and is responsible for managed-care contracting, problem payer management, and government regulatory agency relations. He is also a past president of the California Chapter of the American College of Emergency Physicians (CAL/ACEP), and a member of the ACEP Reimbursement Committee. There were no funding sources for the development of this article.
REFERENCES
1. The Little Hoover Commission A Smarter way to care: Transforming Medi-Cal for the Future. May, 2007.
2. Duggan M. Does Contracting Out Increase the Efficiency of Government Programs? Evidence from Medicaid HMOs. Journal of Public Economics. 2004;88:2549– 2572.
3. The Lewin Group Medicaid Managed Care Cost Savings – A Synthesis of Fourteen Studies. Jul, 2004.
4. Legislative Analyst’s Office Analysis of the 2004–05 Budget Bill. Feb, 2004.
5. Berk ML, Monheit AC. The Concentration of Health Care Expenditures, Revisited.Health Affairs. 2001;20:9–18. [PubMed]
6. Cohen SB, Yu W. Agency for Healthcare Research and Quality; 2006. The Persistence in the Level of Health Care Expenditures over Time: estimates for the US Population, 2002–2003. Medical Expenditure Panel Survey Statistical Brief #124.
7. MaCurdy T, Chan R, Chun R, Johnson H, O’Brien-Strain M. Public Policy Institute of California; Jun, 2005. Medi-Cal Expenditures: Historical Growth and Long-Term Forecasts.
8. Thiede-Call K, Dowd B, Feldman R, Maciejewski M. Selection Experiences in Medicare HMOs: Pre-Enrollment Expenditures. Health Care Financing Review. 1999;Volume 20:197–209.
9. Centers for Medicare & Medicaid Services, Center for Medicaid and State Operations Jun 22, 2007. Fiscal Year 2004 National MSIS Tables.
10. California Department of health Services Mercer Government Human Services Consulting. Sep, 2006. Capitation Rate Development Process and Reimbursement Review; p. 3.
11. Smith M. Quality, Affordability and Transparency: A New Era for Medi-Cal?. Annual Quality Conference; Sacramento, CA. Mar 19, 2007. Lecture presented at: California Department of Health Services and Delmarva Foundation for Medical Care, Inc.
12. California Department of Health Care Services State of California; Medical Care Statistics Section: FFS Expenditures Summary Table, CY2006.
Appendix A
Evaluating Claims of Managed Care Cost Effectiveness
In 2004 the health care consulting firm, The Lewin Group, reviewed 14 selected papers on Medicaid Managed Care on behalf of the Association of Health Insurance Plans (AHIP) and concluded, “…the managed care model achieves access and quality improvementswhile at the same time yielding Medicaid program savings.” In a 2007 report the Little Hoover Commission lamented the fact that, “Less than half of Medi-Cal’s members are enrolled in managed care plans, despite research that shows managed care can lower costs and improve care, even for people with complex health needs”2. An enthusiastic Vernon Smith, former Medicaid Director for Michigan and now a Principal with he health care consulting firm, Health Management Associates, even declared, “…costs under managed care are less than fee-for-service, even though managed care provides a much greater value, even if the costs were the same. It is guaranteed.”
Over the past decade, the siren song of managed care savings has proven irresistible to policy-makers, and recommendations to expand the managed care presence within Medicaid (and Medi-Cal) have become the central features of many reform proposals. In 2004 the California Legislative Analyst’s Office (LAO) reviewed the Governor’s “Agenda for Long-Term Reform of the Medi-Cal Program”. This proposal recommended that managed care coverage be made mandatory for families and children in counties where these services are now provided primarily on a fee-for-service basis, and urged that aged, blind, and disabled beneficiaries in these counties be encouraged to volunteer for enrollment in managed care, as well. The LAO estimated savings of $33 million annually “based on the assumption that the state will pay capitation rates to health plans equivalent to 95 percent of what it would cost the state to provide medical services to these beneficiaries under the fee-for-service system.”3 The potential for greater control over expenditures has been the major rationale for the expansion of managed care in Medicaid programs throughout the United States. The number of Medicaid (and Medi-Cal) beneficiaries shifted into managed care continues to grow, even as the managed care model is being discarded by increasing numbers of purchasers in the commercial health insurance market. Writing in 2004, researchers noted that, “Between 1990 and 2002, Medicaid enrollment in HMOs grew from more than one million beneficiaries to more than seventeen million. Although total enrollment in HMOs nationally also grew during this time (by close to forty million), enrollment peaked in 1999 and has declined in each subsequent year.”4
For commercial insurance plans, the Medicaid market presents an opportunity to replace covered lives that have been lost as employer-based coverage continues to decline. A paper by James C. Robinson entitled, “The Commercial Health Industry in an Era of Eroding Employer Coverage”1 published in Health Affairs reported that employer-based coverage peaked in 2000 at 164.4 million-62 percent of the non-elderly population, and fell by almost five million in the subsequent four years. Robinson described the decline in employer-based coverage as a deliberate choice by insurers willing to accept losses in enrollment, rather than lower premiums or increased medical loss ratios. “These changes in performance”, according to Robinson, “reflect a changed understanding of the health insurance industry as a mature sector whose earnings growth rather than enrollment growth is the primary metric of success. Wall Street fostered and has celebrated this change of focus.” However, there is also the threat that declines in employer-based coverage could become too precipitous. As result, Robinson noted, “Shrinking employment-based enrollment, a dwindling supply of acquisition targets, and the specter of renewed price competition are driving the commercial industry toward diversification. Medicaid and Medicare represent the only segment of the health insurance world that is growing.”
As the managed care presence within Medicaid expanded, claims of greater efficiency and cost savings accruing to Medicaid programs as result of the implementation of managed care did not go unchallenged. A growing number of researchers questioned the underlying assumptions and supporting empirical evidence behind those claims. Writing in Health Affairs, attorney and patient advocate, Kip Sullivan, noted that the lowermedical costs of health plans could not be directly compared to the medical costs of fee-for-service beneficiaries, since the total costs of health plans also include margins for administrative overhead and profit.6 Additionally, Sullivan noted, factors that have nothing to do with efficiency, such as the risk profile of the respective populations, may explain why health plan premiums may be slightly lower than fee-for-service premiums.
Analyzing Medi-Cal claims data; University of Maryland researcher Mark Duggan found no savings at all resulting from Medi-Cal’s implementation of managed care. Instead he found that the switching of beneficiaries from fee-for-service to managed care was associated with a substantial increase in government spending but no corresponding improvement in infant health outcomes.7 According to Duggan’s research findings, the state paid participating Medi-Cal managed care plans 17 percent more for the enrolled population than the cost would have been assuming fee-for-service enrollment during the period 1993 through 1999. Other research, in addition to Mark Duggan’s, suggests that Medi-Cal Managed Care (MCMC) did not have the beneficial impact on quality of care described by its proponents. A 2001 study compared prenatal and maternal care in the Medi-Cal managed care counties of San Mateo and Santa Barbara with the fee-for-service county of Ventura. It found that prenatal care use was consistently lower in the MCMC counties, although prenatal care provision in all three counties is well below the national standard. One-day-stay deliveries rose to almost 50 percent of deliveries in the MCMC counties. As a result, program cost savings associated with MCMC enrollment appeared to primarily result from reduced provision of prenatal care and shorter delivery length of stay.8 A 2007 study found that MCMC enrollment was associated with reduced quality of prenatal care and increased low birth weight, prematurity, and neonatal death.9
Investigation of the specific sources underlying the claims of managed care efficiency and costs savings reveals that they are frequently unsupported by solid empirical evidence, and arise from educated guesswork and conjecture. For example the web site of the California Medical Assistance Commission (CMAC), which negotiated the Department of Health Care Services’ contracts with managed care plans, advises readers that:
In fiscal year 2006–07, the estimated State General Fund due to managed care rate negotiations is estimated to be . Since fiscal year 1995–96, the accumulated State General Fund annual savings associated with managed care rate negotiations is estimated to be in excess.10
The figures above were provided on the CMAC web site without source or attribution. However, in the calendar year 2006, total capitation payments to Medi-Cal Managed Care plans totaled over $5.3 billion11. The $300 million figure for savings represents an additional five percent. Since managed care capitation rates were calculated to be 95% of predicted fee-for-service expenditures, we can see that the savings figure of $300 million is likely an assumption based on this design feature, and not the result of a post-hoc analysis. An assumption, however, is not an empirical basis for an assertion. Here the potential for adverse selection again becomes significant. If the most expensive beneficiaries have not enrolled, or have dis-enrolled, (removing them from the pool of beneficiaries used to calculate the capitation rate) the actual cost of providing care for the remaining beneficiaries would be less, in which case the CMAC savings figure would be overstated, or completely imaginary.
In other instances, where actual empirical studies are cited, claims of managed care savings arise from a more selective and less than rigorous interpretation of the data. The cost savings basis for the Little Hoover Commission’s recommendation to expand Medi-Cal Managed Care, for example, rests upon two specific sources. The first is a 2004 study entitled “Preventing Unnecessary Hospitalizations in Medi-Cal: Comparing Fee-for-Service with Managed Care.”12, conducted for the California HealthCare Foundation, by researchers from the University of California, San Francisco. According to their research, among non-elderly Medi-Cal enrollees the rate of avoidable hospitalizations was a third lower in managed care, which the researchers said suggested that managed care was associated with 7,000 fewer hospitalizations a year, accounting for $66 million in avoided hospitalization costs.
A review of this paper, however, uncovers a number of disturbing methodological deficiencies. The UCSF researchers compared relatively complete fee-for-service data to managed care data that the DHCS advised was incomplete. Additionally, this team failed to control for a number of important confounding variables. Most notably, these include differences in the scope of services for which beneficiaries in the respective populations were eligible, and differences in the underlying clinical status of the respective populations. Without a doubt, most researchers would consider the failure to risk-adjust1populations for whom health outcomes are being compared to be a towering and insurmountable obstacle to drawing any credible conclusion.
The second study cited by the Little Hoover Commission as evidence of the managed care model’s greater cost effectiveness is The Lewin Group’s aforementioned paper, “Medicaid Managed Care Cost Savings – A Synthesis of Fourteen Studies”. Reporting the results of other studies is meta-research, rather than research, and was undertaken on behalf of an insurance industry interest group (AHIP) for the purpose of advocacy and public relations. Lewin itself, Mercer and Associates, Schaller Anderson, and other consultants, all of which, it should be disclosed, have many Medicaid health plans as their clients, conducted many of the underlying studies cited in this paper. As the New England Journal of Medicine recently observed, “Although the science in a submitted manuscript should be judged on its merits, one cannot fully appreciate a study’s meaning without acknowledging the subtle biases in design and interpretation that may arise when a sponsor stands to gain from the report.”13
The financial relationship between the authors and the object of their research does not in itself invalidate their findings. It does, however, justify a more thorough review of the underlying studies, a process that reveals significant variation in methodologies and findings, as well as conclusions frequently accompanied with carefully phrased caveats. One of the fourteen studies cited by Lewin is the UCSF study on avoidable hospitalizations, whose methodological deficiencies are discussed several paragraphs back. Another study entitled “How Managed Care Affects Medicaid Utilization: A Synthetic Differences Zero-Inflated Count model” is based on a sample of only 152 individuals. As noted by Lewin, the article entitled “Reforming Medicaid: The Experience of Five Pioneering States with Mandatory Managed Care and Eligibility Expansions”, states flatly, “The States were unable to realize their high hopes for savings from managed care”. This passage is found in a section of the paper entitled, “The States’ Costs under Managed Care Did Not Decline”. Lewin’s conclusions to the contrary, these fourteen research studies are too mixed, nuanced and conditional in their findings to justify the type of sweeping conclusion of great cost efficiencies in managed care drawn by the Little Hoover Commission.
While some states have reported apparent cost savings resulting from their implementation of Medicaid Managed Care, the ability of others to realize the same level of success is highly dependent upon the adoption of many of the same guiding principles, program designs, and policies as those states that have achieved positive results. The highly regarded Arizona Health Care Cost Containment System (AHCCCS), for example, utilizes a competitive bidding process by prospective participating health plans as part of its rate setting process. Competitive bidding, however, has never been part of California’s health plan application process. Reviewing the AHCCCS in 1997, Nelda McCall wrote, “Both the state and the participating plans in AHCCCS have demonstrated that credible data on eligibility, enrollment, networks, cost, use of services, and, for long-term care beneficiaries, medical and functional assessments can be captured and play an important role in managing the program. Organizations that cannot provide data on plan operations and on the use and cost of services should be excluded from participation, because without such data they cannot be a cost-effective partner for the state.”14However, a study by Kaelin et al of ten states that implemented risk adjustment in their Medicaid Managed Care programs did find that these States “believed the efficiency of the payment programs improved and plans had more incentive to focus on providing quality care as opposed to selection strategies”.15
The rate-setting methodologies employed by each State also impact the cost-effectiveness of Medicaid managed care. A study describing the results of a nationwide survey of Medicaid managed care payment methods published in 1999, “Medicaid Managed Care Payment methods and Capitation Rates”, concluded that, “there is considerable variation among states in how rates are set.”16 They noted that only two states, Colorado and Maryland, had in 1999 implemented health-based risk-adjustment systems for their Medicaid population. The authors found that many other factors also affect the cost effectiveness of managed care. These include the number of participating plans and level of competition, the amount of excess provider capacity, and the willingness of hospitals to accept lower rates from plans. Furthermore, the delegated model of managed care in California allows MCMC plans to contractually delegate not just care responsibility, but also risk and claims payment responsibility, to second and even third tier entities. With each successive level of delegation, there is less and less of the State’s capitated payment available for actual health care services to the enrollee; and thus greater incentive for these at-risk provider groups to use risk-aversive selection and carve-out loopholes to maximize profits and limit costs.
Therefore generalized statements about the benefits of the managed care model cannot be made without knowing whether the implementing State’s program design and unique policies help promote or undermine the objectives and rationale of the program.
REFERENCES
Appendix B
Distribution of Costs throughout Health Care Populations: Review of the Relevant Literature
A wide body of literature confirms the existence of selection bias in patterns of health plan enrollment and dis-enrollment. Much of this research resulted from efforts to study the outcome of the introduction of private health plan enrollment to Medicare program beneficiaries. Other research focusing on the commercial insurance sector explores the shift of beneficiaries from traditional to high deductible, high co-pay health plans. Lastly there have been several studies that have found selection bias to exist within the Medi-Cal program itself.
Research focusing on the concentration and skewing of expenditures within health care populations include: The Concentration of Health Expenditures: an Update (1992) and The Concentration of Health Care Expenditures, Revisited (2001) by Marc L. Bark and Alan C. Monet, The Persistence in the Level of Health Expenditures over Time: Estimates for the U.S. Population, 2002–2003 (2006) by Cohen, Steven B, and The High Concentration of U.S. Health Care Expenditures, by Mark W. Stanton.
Bark and Monet found that in 1987 the top 1 percent of spenders accounted for 30 percent of aggregate health spending. Updating their research through 1996, they found that the skewed concentration of health care expenditures remained stable, with only slight changes in the percent of spending generated by the top one and five percent of spenders occurring between the two studies. They indicated “A comparison of the payment-based spending estimates in 1987 and 1996 reveals a remarkable stability in the concentration of expenditures over the past decade. In 1996 we find that the top 1 percent of the population accounted for 27 percent of aggregate expenditures, while our adjusted 1987 estimate is 28 percent. We also find that the top 5 percent of spenders accounted for more than half of health spending in both years, while the top 10 percent accounted for more than two-thirds. These tabulations also are generally quite similar to those derived from data for 1970, 1977, and 1980.”
Using information from the household component of the Medical Expenditure Panel Survey (MEPS-HC), Steven Cohen and William Yu found that in 2002, 1 percent of the population accounted for 22 percent of total health expenditures, and the lower 50 percent of the population ranked by their expenditures accounted for only 3 percent of the total.2
REFERENCES
Appendix C
The Medicare Experience with Risk Adjustment
Legal authority for HMO participation in the Medicare program can be traced to the HMO Act of 1972 and the Tax Equity and Fiscal Responsibility Act of 1982 (TEFRA). TEFRA introduced payments on a “risk-sharing” basis between Medicare and the HMOs. Under these arrangements, interim payments were made, and the costs incurred each year by the HMO were compared with the adjusted average per capita costs (AAPCC), and with estimates of the costs beneficiaries would have incurred under traditional fee-for-service Medicare. Carlo Baraboo, author of “Milestones in Medicare Managed Care”, noted that, “Aspic’s were computed for each county of the United states, with separate rates for the disabled and elderly, and certain adjustment factors were applied to better approximate fee-for-service (FFS) costs: age, sex, institutional status, and Medicaid status. However, there was still no direct health status adjuster. As would become evident, the lack of a health status adjuster meant that there was still not a perfect fit in the payment methodology.”
After a period of decline in the late 1980s, Medicare HMO enrollment began once again to grow in the early 1990’s reflecting the rise of the managed care model overall. There was a concurrent increase, however, in concern that the AAPCC-calculated rate methodology encouraged selection bias in the enrollment patterns of the Medicare population. A number of studies focusing on Medicare’s managed care experience during the nineteen nineties found evidence that adverse selection of high-cost beneficiaries away from managed care had increased program expenditures
Table.
Distribution of Health Expenditures for the U.S. Population, By Magnitude of Expenditures2
| Percent of US Population Ranked By Percentile | Percent of Expenditures (1996) |
|---|---|
| Top 1% | 27% |
| Top 2% | 38% |
| Top 5% | 55% |
| Top 10% | 69% |
| Top 30% | 90% |
| Top 50% | 97% |
Kathleen Thieve-Call, Bryan Dowd, Roger Feldman and Matthew Maciejewski found that favorable selection was associated with enrollment into Medicare risk HMOs.2 Using pre-enrollment Medicare reimbursements as an indicator of beneficiary health status, it was determined that beneficiaries joining an HMO in 1994 were healthier than those remaining in FFS. Further, it was noted that favorable selection declines as HMO market share and HMO growth rate increases, but it does not disappear until the HMO market share reaches 100 percent.
A GAO report in 20003 entitled “Medicare + Choice Payments Exceed Cost of Fee-For-Service Benefits, Adding Billions to Spending”, noted that aggregate payments to Medicare + Choice plans in 1998 totaled about $5.2 billion (21 percent), or approximately $1,000 per enrollee, more than payments to the traditional Fee-For-Service program (FFS). Further, the analysis concluded that excess payments, not managed care efficiencies, enabled plans to attract beneficiaries. Managed care plans offered a more comprehensive benefit package than the one available to FFS beneficiaries, while charging modest to no premiums. Nearly all of the 210 plans analyzed in this study received capitated payments during 1998 that exceeded the actual costs for services rendered because their enrollees were healthier than average beneficiaries.
In response to these reports and many others with similar findings, the Balanced Budget Act of 1997 directed the US Health And Human Services Agency to implement a new payment method for Medicare managed care plans, known as Risk-Adjustment that would reflect the underlying health status of the Medicare beneficiaries enrolled in each plan. The new payment methodology was to be phased in over five years. “There is widespread agreement among health care experts that risk-adjusted payments will pay plans more fairly and reduce incentives for plans to enroll only healthier beneficiaries,” said HHS Secretary Donna Shalala in January 1999 as she announced the implementation of the new payment methodology.4
Not surprisingly, Medicare Managed Care plans objected to the implementation of risk adjustment. In an article by Laura Steiner in the Journal of Law, Medicine & Ethics, 27, no. 1 (1999): 105–06, the author noted that: “Charles Kahn, lobbyist and president of the Health Insurance Association of America, said that the risk-adjustment methodology is fundamentally flawed because it is based on length of hospitalization, and one of the goals of managed care is to reduce hospital stays. The chief lobbyist for Blue Cross Blue Shield of Florida, Melissa Raefus, commented that HMOs encourage preventive health care measures, such as regular check-ups and early treatment of illness, to reduce more costly hospitalization. The risk-adjustment methodology based on length of hospital stay would penalize HMOs that use a preventative approach to health care. Former HCFA administrator Bruce Vladeck acknowledged that basing cost categories on length of hospitalization is not ideal. According to Vladeck, HCFA is forced to use this method, because the managed care industry will not give it more extensive data on patient treatment. Vladeck remarked, “To me, the HMOs complaining that the risk adjustment is flawed is the moral equivalent of murdering your parents and then complaining you’re an orphan.” Most plans eventually did learn to accommodate to risk adjustment in the Medicare Managed Care program, and it is generally believed that risk adjustment has encouraged plans to focus more on providing quality care (and accurate data gathering), and less on selection strategies.
REFERENCES
Appendix D
Impact of Dis-enrollment / Non-enrollment – An Illustration
Supporting Tables
Exhibit 2 Table.
Impact of Dis-enrollment of Most Expensive Beneficiaries on Average Cost of Remaining Managed Care Population
| Percent of Population | Number of Unduplicated Beneficiaries | Amount of Expenditures | Member Months | PMPM Cost |
|---|---|---|---|---|
| Entire Population | 100,000 | $100,000,000 | 800,000 | $125.00 |
| Less Most Expensive 1% | 99,000 | $73,000,000 | 792,000 | $92.17 |
| Less Most Expensive 5% | 95,000 | $45,000,000 | 760,000 | $59.21 |
| Less Most Expensive 10% | 90,000 | $31,000,000 | 720,000 | $43.06 |
Exhibit 3 Table.
Impact of Dis-enrollment of Most Expensive Beneficiaries from Managed Care and Back into Fee-For-Service
| Percent of Population | Number of Unduplicated Beneficiaries | Amount of Expenditures | Member Months | PMPM Cost |
|---|---|---|---|---|
| Original Population (FFS) | 100,000 | $100,000,000 | 800,000 | $125.00 |
| Adding Most Expensive 1% from MC | 101,000 | $127,000,000 | 808,000 | $157.18 |
| Adding Most Expensive 5% from MC | 105,000 | $155,000,000 | 840,000 | $184.52 |
| Adding Most Expensive 10% from MC | 110,000 | $169,000,000 | 880,000 | $192.05 |
Exhibit 4 Table.
Change in Average Per-Member, Per-month Cost of the Managed Care Population, and Resulting Over-payment, as the Most Expensive Beneficiaries are Shifted to Fee-For-Service
| Expenditure | Original Population | MC’s Most Expensive 1% Shifted to FFS | MC’s Most Expensive 5% Shifted to FFS | MC’s Most Expensive 10% Shifted to FFS |
|---|---|---|---|---|
| Capitation Payment at 95% Original PMPM ($125) | $118.75 | $118.75 | $118.75 | $118.75 |
| PMPM for Remaining Population | $125.00 | $92.17 | $59.21 | $43.06 |
| Overpayment (PMPM) | $(6.25) | $26.58 | $59.54 | $75.69 |
| Remaining Beneficiaries | 100,000 | 99,000 | 95,000 | 90,000 |
| Aggregate Monthly Overpayment | $(625,000) | $2,631,250 | $5,656,250 | $6,812,500 |
| Aggregate Annual Overpayment | $(7,500,000) | $31,575,000 | $67,875,000 | $81,750,000 |
Appendix E
Reasons for Not Enrolling, or Dis-enrolling Medi-Cal Managed Care Beneficiaries
Time to enroll
Sixty to ninety days may be required to contact a beneficiary following the date he or she becomes eligible for Medi-Cal and complete their enrollment into a health plan.
Logistical difficulties contacting beneficiaries
Errors in the beneficiary’s address information or a beneficiary’s transient or “homeless” residential status may result in an inability to make contact for the purpose of health plan enrollment.
Other Health Care Coverage
Beneficiaries in mandatory aid codes with other health care coverage are not eligible to enroll in a Medi-Cal health plan.
Medical Exemption
Granted through Medi-Cal’s enrollment contractor HCO (Health Care Options). The types of dis-enrollment requests handled by HCO include Medical Exemption Requests (MERS), Emergency Dis-enrollment Exemption Requests (EDER), Retroactive Dis-enrollment requests (RETRO), and the Plan Dis-enrollment Request (PID). Medi-Cal Managed Care policy regarding exemptions allows dis-enrollment for any of the following medical reasons2:
-
Pregnancy,
-
Under evaluation for organ transplants or approved for and awaiting transplant,
-
Receiving chronic renal dialysis treatment,
-
HIV positive or diagnosed with AIDS,
-
Diagnosed with cancer and currently receiving a course of accepted therapy (such as chemotherapy or radiation),
-
Approved for a major surgical procedure by the Medi-Cal FFS program and awaiting surgery or immediately post-operative,
-
Has another not listed above, such as cardiomyopathy or amyotrophic lateral sclerosis that is already under treatment,
-
Is enrolled in a Medi-Cal waiver program that allows the individual to receive sub-acute, acute, intermediate or skilled nursing care at home rather than in a sub-acute care facility, an acute care hospital, an intermediate care facility or a skilled nursing facility, or
-
Is participating in a pilot project organized and operated pursuant to §§14087.3, 14094.3, or 14490 of the Welfare and Institutions Code
Exemptions granted by the Medi-Cal Managed Care Office of the Ombudsman
According to the web site for the Medi-Cal Managed Care Office of the Ombudsman a beneficiary may be exempted out of enrollment in a managed care plan if they “receive health services from an Indian Health Provider”, “receive health services through an approved Medi-Cal waiver program”, or “are being treated for a medical condition.”3
Relocation to new county
Beneficiaries may dis-enroll from managed care plans as result of relocating to a new county, beyond the plan’s area of operation.
Changed aid codes
Beneficiaries may dis-enroll from managed care plans as result of switching from a mandatory to voluntary or excluded aid code.
The reasons a mandatory beneficiary may not be enrolled, or may have dis-enrolled from a health plan include the following:
-
Failure to enroll within the time limit
-
Inability to make contact / homeless residential status
-
Enrollee has other health care coverage
-
Medical Exemption granted through Medi-Call’s Enrollment Contractor HCO for: pregnancy, organ failure pending transplantation, chronic renal dialysis treatment, HIV positive status, cancer undergoing chemotherapy or radiation treatment, pending or recent major surgical procedures, and complex and/or progressive disorder not listed above, such as cardiomyopathy or amyotrophic lateral sclerosis under treatment, enrollment in a Medi-Cal waiver program for sub-acute, acute, intermediate or skilled nursing care at home, or participation in certain pilot projects.
-
Exemptions granted by the Medi-Cal Managed Care Office of the Ombudsman, as when receiving health services through an Indian Health Provider” or an approved Medi-Cal waiver program.
-
Relocation to new county.
-
Switching from a mandatory to a voluntary or excluded aid code.