
| Author | Affiliation |
|---|---|
| Erik B. Kulstad, MD, MS | Advocate Christ Medical Center, Oak Lawn, IL |
| K. Michael Hart, MD | University of Illinois, William Beaumont Hospital, Peoria, IL |
| Simon Waghchoure, MBBS | Bronx-Lebanon Hospital Center, Bronx, NY |
ABSTRACT
Introduction:
Two crowding metrics are often used to measure emergency department (ED) crowding: the occupancy rate and the emergency department work index (EDWIN) score. To evaluate these metrics for applicability in our community ED, we sought to measure their correlation with the number of patients who left without being seen (LWBS) and determine if either, or both, correlated with our daily LWBS rate. We hypothesized a statistically significant positive correlation between the number of patients who LWBS and both crowding metrics.
Methods:
We performed a retrospective observational study by reviewing data on all patients who LWBS from December 1, 2007, to February 29, 2008. Occupancy rates and EDWIN scores were obtained through our electronic patient tracking board. We identified LWBS status by searching the final disposition entered into our electronic medical record. We measured the correlation between each crowding metric averaged over each 24-hour day and the number of patients who LWBS per 24-hour day using Spearman’s rank correlation, and created receiver operator characteristic (ROC) curves to quantify the discriminatory power of occupancy rate and EDWIN score for predicting more than two patients per day who LWBS.
Results:
We identified 1,193 patients who LWBS during the study period, including patients who registered but then left the waiting room (733), as well as those who left before: registration (71), triage (75), seeing a physician (260), or final disposition (54). The number of patients who LWBS per day ranged from one to 30, with a mean of 13 and median of 11 (IQR 6 to 19). The daily number of patients who LWBS showed a positive correlation with the average daily occupancy rate (Spearman’s rho = 0.771, p = 0.01) and with average daily EDWIN score (Spearman’s rho = 0.67, p< .001). Area under the ROC curve for occupancy rate was .97 (95% CI .93 to 1.0) and for EDWIN score was .94 (95% CI .89 to 1.0).
Conclusion:
Average daily occupancy rates and EDWIN scores both correlate positively with, and have excellent discriminatory power for, the number of patients who LWBS in our ED; however, the scale of our EDWIN scores differs from that obtained at other institutions. For studies of crowding, occupancy rate may be the more useful metric due to its ease of calculation.
INTRODUCTION
The problem of emergency department (ED) crowding continues to plague healthcare systems around the world. ED crowding has been associated with increased risks of death or disability, treatment delays, ambulance diversion, and patients leaving without being seen, among other problems.1–8 Patients who leave without being seen (LWBS) risk not receiving appropriate or timely medical care and represent a particular failure of the medical system.9–13
Earlier studies have shown that the number of these patients who leave before being seen by a physician is affected by multiple factors, with one common factor being the level of ED crowding; nevertheless, studies of the effect of crowding on LWBS patients have primarily examined university-based academic medical centers or public county hospitals.9–12, 14–16 As the problem of hospital and ED crowding continues to grow, more methods to quantify levels of crowding are being developed, with the emergency department work index (EDWIN) score favored by some groups, and occupancy rate favored by others.16–27
To evaluate further the characteristics of two crowding metrics in our community hospital ED, we sought to measure the correlation between the degree of crowding, measured by the occupancy rate and by a modified EDWIN score available on our electronic tracking board, and the number of patients who LWBS. We hypothesized a statistically significant positive correlation between the number of patients who LWBS and both crowding metrics.
METHODS
Study design
We performed a retrospective analysis of all patients who registered in our ED between December 1, 2007 and February 29, 2008. The study was approved by our Institutional Review Board with a waiver of informed consent.
Setting and selection of participants
This study was conducted in a community teaching hospital with a 50-bed ED that is designated a Level 1 trauma center with an annual ED census of 85,000 visits per year and almost 700 inpatient beds. The hospital has an emergency medicine residency program in a PGY 1-3 format. All patients who arrived to the ED and gave sufficient information to be listed on our electronic tracking board were considered eligible for counting. We obtained daily counts of all patients who LWBS via our electronic medical record (EMR) system.
Methods of measurement
The occupancy rate is defined by the total number of patients in the ED divided by the number of licensed ED beds. The EDWIN score is defined as Σniti/Na(BT–BA), where ni = number of patients in the ED in triage category i, ti = triage category, Na = number of attending physicians on duty, BT = number of treatment bays, and BA = number of admitted patients in the ED. Triage category is defined by the Emergency Severity Index (ESI)28, which is in widespread use in North America; for the EDWIN score, to assign higher numerical values to higher severity patients, the ESI is reversed from the standard ordinal ranking of triage categories so that ESI level 1 patients, who have the highest acuity, are assigned a value of 5, ESI level 2 patients are given a value of 4, continuing down to ESI level 5 patients (lowest acuity) being assigned a value of 1. The EDWIN score from our tracking board varies from the original in that admitted patients are not removed from the numerator in the calculation of our score (whereas in the original description admitted patients were removed from the numerator) and the total number of bays counted (BT) includes all available spaces, including hallway beds, rather than only licensed treatment bays. This last modification is necessary to avoid possible “divide by zero” computational errors, and results in a lowering of the numerical value of our score when compared to the original description.
Data collection and processing
We obtained occupancy rates and EDWIN scores at 20-minute intervals, 24 hours per day, via automatic sampling of our electronic patient tracking board through a remote server. To collect these data, we used a VBScript (Microsoft, Redmond, Washington) running on a remote server that automated the acquisition of data from our electronic tracking board.
We identified patients as having LWBS if they were given one of four disposition designations in our EMR: (1) left before registration, (2) left before triage, (3) left before being seen by a physician, or (4) left before final disposition.
Primary data analysis
We measured the correlation between each crowding metric averaged over each 24-hour day and the number of patients who LWBS per 24-hour day using Spearman’s rank correlation. We created receiver operator characteristic (ROC) curves to quantify the discriminatory power of occupancy rate and EDWIN score for predicting more than two patients per day who LWBS, based on prior recommendations that LWBS rates of 1% or less should be the target rate for EDs.9 We performed our analyses with SPSS version 15.0 (SPSS Inc., Chicago, IL).
RESULTS
Site Characteristics
We identified 1,193 patients who LWBS during the study period. The majority of these patients (733) registered at the ED greeting station, then left the waiting room prior to being called to triage or back into an ED exam room or hallway spot. The remainder of these patients left before various stages of their visit, including 71 who left before full registration, 75 who left before triage, 260 who left before seeing a physician, and 54 who left before final disposition. The number of patients who LWBS per day ranged from one to 30, with a mean of 13, and a median of 11 (IQR 6 to 19). The average daily occupancy rate ranged from 65% to 170%, with a mean of 126%, and median of 127% (IQR 112% to 144%). The average daily EDWIN score ranged from 0.18 to 0.48, with a mean of 0.31, and a median of 0.31 (IQR 0.27 to 0.34). The average number of patients presenting to the ED in each month of our study was as follows: 7,316 in December 2007, 7,482 in January 2008, and 7,217 in February 2008. The average time to triage in each month was 18 minutes, 20 minutes, and 21 minutes, respectively. The average time to arrival in the ED from the waiting room by month was 72 minutes, 94 minutes, and 95 minutes, respectively. Finally, the average time to disposition was 233 minutes, 259 minutes, and 256 minutes, respectively.
Correlations
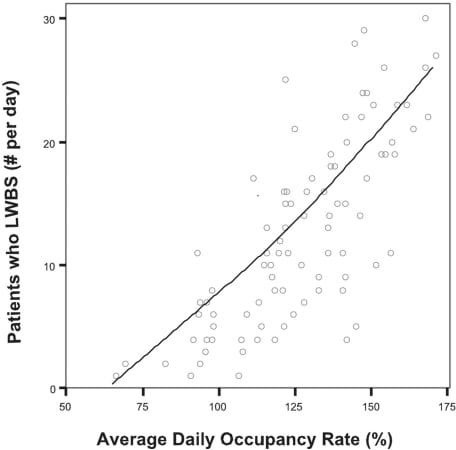
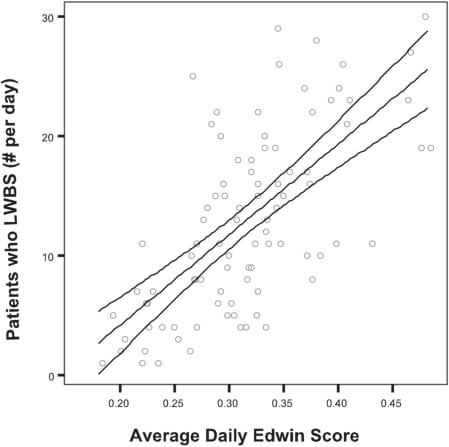
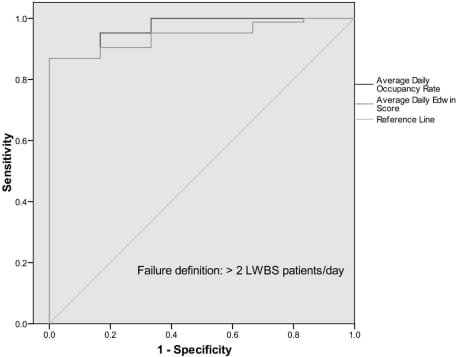
The daily number of patients who LWBS showed a positive correlation with both the average daily occupancy rate (Spearman’s rho = 0.771, p = .01), Figure 1, and the average daily EDWIN score (Spearman’s rho = 0.67, p< .001), Figure 2. The correlation between EDWIN score and occupancy rate was strong (Spearman’s rho = 0.85, p < .001). By defining an adverse outcome as the presence of greater than two patients in one day who LWBS, the area under the ROC curve for occupancy rate was 0.97 (95% CI 0.93 to 1.0) and for EDWIN score was 0.94 (95% CI 0.89 to 1.0), Figure 3. Using data points from our ROC curves, an occupancy rate of greater than 95% provides a sensitivity of 93% and a specificity of 83% for the likelihood of more than 2 patients in one day who LWBS. Likewise, an EDWIN score of 0.22 provides a sensitivity of 93% but a specificity of only 67% for the likelihood of more than two patients in one day who LWBS.
DISCUSSION
We found a strong correlation between the two crowding metrics investigated and the number of patients who LWBS in our community ED, further supporting the associations seen in university-based academic medical centers. Because there are many important operational differences between community hospitals and university-based medical centers, the persistence of this association in our hospital setting, although likely, was not certain. For example, many of our patients have their own private physicians and, when they present to the ED, may anticipate admission under their own physician, which may induce them to wait longer than they would otherwise before leaving the waiting room. Conversely, because the majority of patients admitted do not have inpatient resident physician coverage, additional time spent waiting for their primary care physician to perform further inpatient workup may pose delays in hospital throughput not seen in university-based settings.
Prior studies in university-affiliated EDs have found markedly increased numbers of patients who LWBS when ED volume increased beyond a certain threshold, in contrast to the more linear relationship apparent in our ED. This difference suggests that additional operational or external factors may influence patient decisions.12 For example, a recent study found that many patients in a level II trauma center and community teaching hospital who LWBS had a primary care physician and were able to obtain care elsewhere.29 Another study found that implementation of a rapid triage and treatment protocol, which allowed initiation of patient treatment at triage, reduced the number of patients who LWBS.30 A retrospective analysis suggests that more frequent communication to patients of expected wait times and the provision of more rapid temporary treatment of symptoms might reduce the LWBS rate.31 Nevertheless, it seems likely that our findings might potentially provide individual EDs with a starting point from which to address their LWBS rate. For example, at a certain occupancy rate threshold (which may vary between individual EDs), additional contingency plans might be activated that call in additional staff to use areas outside of the ED (such as post-anesthesia care units not being used after-hours) to help reduce the total ED occupancy rate.
We chose a cutoff value of two patients per day who LWBS as a level above which would be considered a “failure” for an ROC analysis. This figure is based on prior recommendations that LWBS rates of 1% or less should be the target rate for EDs.9 Given the risks associated with leaving the ED prior to treatment, this rate appears reasonable; however, an even lower rate should perhaps be considered as a future goal. Our findings, which we believe are likely to be seen in other community hospital EDs, further add to the growing list of adverse associations with ED crowding. Although we used both occupancy rate and EDWIN score as our crowding metrics, the easy calculation of the occupancy rate, combined with a likely broader generalizability of this metric, suggests that it may be the more useful metric, as suggested by others.16
LIMITATIONS
Our data are consistent with previous reports from university-based EDs, but because they were obtained from a single hospital ED they may not generalize to other community hospitals. Our correlations are based on EDWIN scores and occupancy rates averaged over a 24-hour period, limiting the ability to observe more detailed relationships that might surface if we used a more restricted time frame. Although we assumed a linear relation between crowding and the number of patients who LWBS, this relationship may instead be more accurately modeled using a non-linear approach. We were unable to confirm that patients did not LWBS only to return the same, or on a later, day, and therefore patients leaving from and returning to the ED within a 24-hour period would have been counted as separate patients. Finally, although the LWBS rate is considered an important measure by hospitals for a number of reasons, the association of this rate with patient outcomes remains uncertain.32
CONCLUSION
Average daily occupancy rates and EDWIN scores both correlate positively with, and have excellent discriminatory power for, the number of patients who LWBS in our ED; however, the scale of our EDWIN scores differs from that obtained at other institutions. For studies of crowding, occupancy rate may be the more useful metric due to its ease of calculation.
Footnotes
We thank the Emergency Medicine Foundation for support in a related study from which some of our data were obtained.
Supervising Section Editor: Michael Epter, DO
Submission history: Submitted May 13, 2009; Revision Received December 4, 2009; Accepted December 27, 2009
Full text available through open access at http://escholarship.org/uc/uciem_westjem
Address for Correspondence: Erik B. Kulstad, MD, MS, Advocate Christ Medical Center, Department of Emergency Medicine, 4440 W. 95th St., Oak Lawn, IL 60453
Email: ekulstad@gmail.com
Conflicts of Interest: By the WestJEM article submission agreement, all authors are required to disclose all affiliations, funding sources, and financial or management relationships that could be perceived as potential sources of bias. The authors disclosed none.
REFERENCES
1. Schull MJ, Vermeulen M, Slaughter G, et al. Emergency department crowding and thrombolysis delays in acute myocardial infarction. Ann Emerg Med. 2004;44:577–85. [PubMed]
2. Pines JM, Hollander JE, Localio AR, et al. The association between emergency department crowding and hospital performance on antibiotic timing for pneumonia and percutaneous intervention for myocardial infarction. Acad Emerg Med. 2006;13:873–8. [PubMed]
3. Kulstad EB, Kelley KM. Overcrowding is associated with delays in percutaneous coronary intervention for acute myocardial infarction. Int J Emerg Med. 2009 in press.
4. Hoot NR, Aronsky D. Systematic review of emergency department crowding: causes, effects, and solutions. Ann Emerg Med. 2008;52:126–36. [PubMed]
5. Sprivulis PC, Da Silva JA, Jacobs IG, et al. The association between hospital overcrowding and mortality among patients admitted via Western Australian emergency departments. Med J Aust.2006;184:208–12. [PubMed]
6. Richardson DB. Increase in patient mortality at 10 days associated with emergency department overcrowding. Med J Aust. 2006;184:213–16. [PubMed]
7. Derlet RW, Richards JR. Emergency department overcrowding in Florida, New York, and Texas.South Med J. 2002;95:846–9. [PubMed]
8. Miro O, Antonio MT, Jimenez S, De Dios A, Sanchez M, Borras A, Milla J. Decreased health care quality associated with emergency department overcrowding. Eur J Emerg Med. 1999;6:105–7.[PubMed]
9. Hobbs D, Kunzman SC, Tandberg D, et al. Hospital factors associated with emergency center patients leaving without being seen. Am J Emerg Med. 2000;18:767–72. [PubMed]
10. Polevoi SK, Quinn JV, Kramer NR. Factors associated with patients who leave without being seen.Acad Emerg Med. 2005;12:232–6. [PubMed]
11. Rowe BH, Channan P, Bullard M, et al. Characteristics of patients who leave emergency departments without being seen. Acad Emerg Med. 2006;13:848–52. [PubMed]
12. McMullan JT, Veser FH. Emergency department volume and acuity as factors in patients leaving without treatment. South Med J. 2004;97:729–33. [PubMed]
13. Ding R, McCarthy ML, Li G, et al. Patients who leave without being seen: their characteristics and history of emergency department use. Ann Emerg Med. 2006;48:686–93. [PubMed]
14. Baker DW, Stevens CD, Brook RH. Patients who leave a public hospital emergency department without being seen by a physician. Causes and consequences. JAMA. 1991;266:1085–90. [PubMed]
15. Weiss SJ, Ernst AA, Derlet R, et al. Relationship between the National ED Overcrowding Scale and the number of patients who leave without being seen in an academic ED. Am J Emerg Med.2005;23:288–94. [PubMed]
16. McCarthy ML, Aronsky D, Jones ID, et al. The emergency department occupancy rate: a simple measure of emergency department crowding. Ann Emerg Med. 2008;51:15–24. 24 e 11–12.[PubMed]
17. Asplin BR, Flottemesch TJ, Gordon BD. Developing models for patient flow and daily surge capacity research. Acad Emerg Med. 2006;13:1109–13. [PubMed]
18. Asplin BR. Measuring crowding: time for a paradigm shift. Acad Emerg Med. 2006;13:459–61.[PubMed]
19. Asplin BR, Magid DJ, Rhodes KV, et al. A conceptual model of emergency department crowding.Ann Emerg Med. 2003;42:173–80. [PubMed]
20. Asplin BR, Rhodes KV, Flottemesch TJ, et al. Is this emergency department crowded? A multicenter derivation and evaluation of an emergency department crowding scale (EDCS) Acad Emerg Med. 2004;11:484.
21. Bernstein SL, Verghese V, Leung W, Lunney AT, Perez I. Development and validation of a new index to measure emergency department crowding. Acad Emerg Med. 2003;10:938–42. [PubMed]
22. Hoot NR, Zhou C, Jones I, Aronsky D. Measuring and forecasting emergency department crowding in real time. Ann Emerg Med. 2007;49:747–55. [PubMed]
23. Jones SS, Allen TL, Flottemesch TJ, et al. An independent evaluation of four quantitative emergency department crowding scales. Acad Emerg Med. 2006;13:1204–11. [PubMed]
24. Raj K, Baker K, Brierley S, et al. National Emergency Department Overcrowding Study tool is not useful in an Australian emergency department. Emerg Med Australas. 2006;18:282–8. [PubMed]
25. Weiss SJ, Ernst AA, Nick TG. Comparison of the National Emergency Department Overcrowding Scale and the Emergency Department Work Index for quantifying emergency department crowding.Acad Emerg Med. 2006;13:513–18. [PubMed]
26. Epstein SK, Tian L. Development of an emergency department work score to predict ambulance diversion. Acad Emerg Med. 2006;13:421–6. [PubMed]
27. Weiss SJ, Ernst AA, Sills MR, et al. Development of a novel measure of overcrowding in a pediatric emergency department. Pediatric emergency care. 2007;23:641–5. [PubMed]
28. Wuerz RC, Milne LW, Eitel DR, et al. Reliability and validity of a new five-level triage instrument.Acad Emerg Med. 2000;7:236–42. [PubMed]
29. Johnson M, Myers S, Wineholt J, et al. Patients who leave the emergency department without being seen. J Emerg Nurs. 2009;35:105–8. [PubMed]
30. Chan TC, Killeen JP, Kelly D, et al. Impact of rapid entry and accelerated care at triage on reducing emergency department patient wait times, lengths of stay, and rate of left without being seen. Ann Emerg Med. 2005;46:491–7. [PubMed]
31. Arendt KW, Sadosty AT, Weaver AL, et al. The left-without-being-seen patients: what would keep them from leaving? Ann Emerg Med. 2003;42:317–23. [PubMed]
32. Pines JM. The left-without-being-seen rate: an imperfect measure of emergency department crowding. Acad Emerg Med. 2006;13:807. author reply 807–8. [PubMed]