
| Author | Affiliation |
|---|---|
| Erden E. Ünlüer, MD | Izmir Katip Çelebi University Atatürk Research and Training Hospital, Turkey |
| Arif Karagöz, MD | Izmir Katip Çelebi University Atatürk Research and Training Hospital, Turkey |
| Haldun Akoğlu, MD | Kartal Lütfi Kırdar Research and Training Hospital, Turkey |
| Serdar Bayata, MD | Izmir Katip Çelebi University Atatürk Research and Training Hospital, Turkey |
Introduction
Materials and methods
Statistical analyses
Results
Discussion
Limitations
Conclusion
ABSTRACT
Introduction
The objective of this study was to determine whether bedside visual estimates of left ventricular systolic function (LVSF) by emergency physicians (EP) would agree with quantitative measurement of LVSF by the modified Simpson’s method (MSM), as recommended by the American Society of Echocardiography.
Methods
After limited focused training, 2 trained EPs performed bedside echocardiography (BECH) procedures s between January and June 2012 to prospectively evaluate patients presenting to the emergency department (ED) with dyspnea. EPs categorized their visually estimated ejection fractions (VEF) as either low or normal. Formal echocardiography were ordered and performed by an experienced cardiologist using the MSM and accepted as the criterion standard. We compared BECH results for each EP using chi-squared testing and performed correlation analysis by Pearson correlation coefficient.
Results
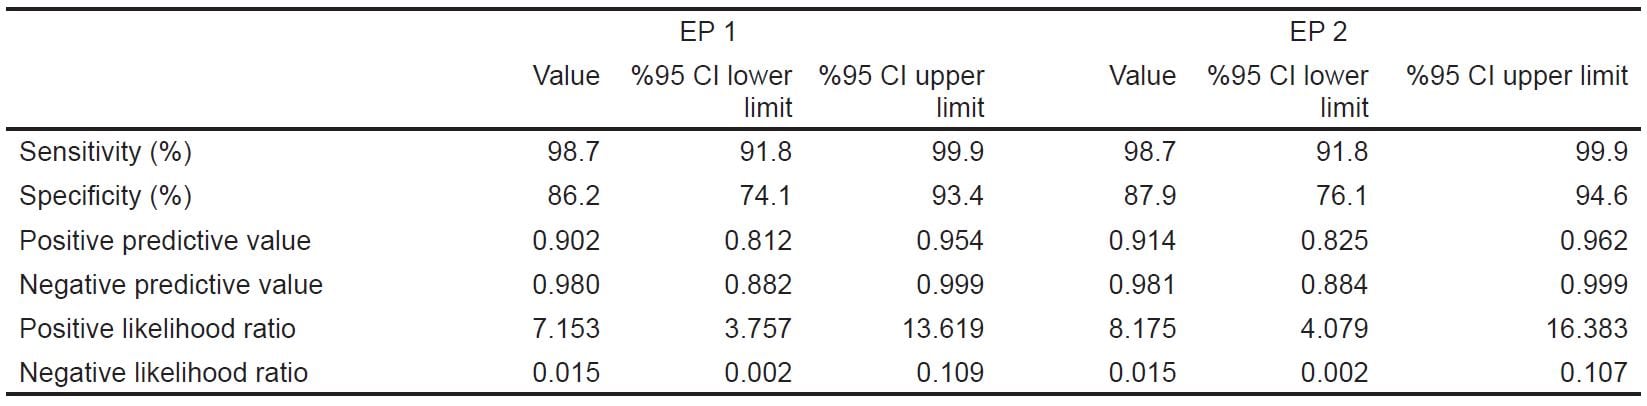
Of the 146 enrolled patients with dyspnea, 13 were excluded and 133 were included in the study. Comparison of EPs vs. cardiologist’s estimate of ejection fraction yielded a Pearson’s correlation coefficient of 0.77 (R, p<0.0001) and 0.78 (R, p<0.0001). Calculated biserial correlations using point-biserial correlation and z-scores were 1 (rb, p<0.0001) for both EPs. The agreement between EPs and the cardiologist was 0.861 and 0.876, respectively. The sensitivity, specificity, positive predictive value, negative predictive value, and the positive and negative likelihood ratios for each physician were 98.7–98.7%, 86.2–87.9%, 0.902–0.914, 0.980–0.981, 7.153–8.175, 0.015–0.015, respectively.
Conclusion
EPs with a focused training in limited BECH can assess LVSF accurately in the ED by visual estimation.
INTRODUCTION
Emergency physicians (EPs) are routinely called on to manage critically ill patients who may present with an indeterminate or changing hemodynamic status. Early in the patient’s course, it may be difficult to firmly identify the underlying etiology. At this stage, successful management hinges less on an accurate diagnosis than on a timely determination of the prevailing hemodynamic process.1 For this issue, the physical examination has been shown to be remarkably unreliable, whereas more invasive assessments of hemodynamics are effort-intensive, costly, and associated with significant morbidity and mortality. 2 Bedside echocardiography (BECH) offers a noninvasive evaluation method of cardiac function. Real-time assessment of the left ventricular ejection fraction (LVEF) offers a window into the causative or compensatory role that the left ventricle (LV) may play in the patient’s disease process.3 This information can direct initial resuscitation efforts, gauge the response to therapy, focus early diagnostic testing, and provide important prognostic data.4
To date, evaluation of goal-directed emergency department (ED) BECH has focused on the diagnosis of pericardial effusions, diastolic heart failure, and determination of central venous pressure.5–7 A study by Moore et al.8 found 84% agreement between ED sonographers and cardiologists in determining LVEF in hypotensive patients. To date, most of the studies in the EDs are based on quantitative measurements of LVEF, such as single- or biplane Simpson ejection fraction, fractional shortening of left ventricular walls, or Mitral E point septal separation.9 These formal measurements have some disadvantages, mainly because of time constraints in the EDs. Compared to formal echocardiographic methods for the evaluation of LVEF, visual estimation (eyeballing) can be done faster and is often easier to perform, even in studies with poor visual quality. Therefore, we aimed to compare visual ejection fraction (VEF) estimation on parasternal long axis view performed in ED with the modified Simpson’s method (MSM, biplane method of discs) as recommended by the American Society of Echocardiography (ASE) performed by an experienced cardiologist.10
MATERIALS AND METHODS
This was a prospective, cross-sectional cohort study conducted from January to June 2012. The local Ethics Committee approved the study protocol. Written informed consent was obtained from each volunteer prior to his/her sonographic examination. All patients who were registered to ED with the complaint of dyspnea were screened for this study by 2 trained EPs at presentation before other diagnostic tests including echocardiography were performed. Treating physicians were not informed of the results of the BECH to prevent any potential morbidity from the use of a misinterpreted examination. Patients were ineligible if they were intubated, aged <18 years, had elevated cardiac biomarkers, were pregnant, had atrial fibrillation, had a known valvular pathology or surgery, or if ultrasonographic measurements could not be performed because of technical limitations. For sample size estimation, we selected primary outcome of “correlation between EPs and cardiologist.”. We estimated to reach at least a correlation of 0.70 with a power of 0.99 and a Type I error of 0.05. Calculated sample size was 11 for a two-tailed correlation. We aimed to enroll at least 10 times this sample size and recruited 133 patients by the end of the study. Therefore, post-hoc power achieved at the end of the study was 1. Each EP had1 year of experience in their speciality and certified on focused abdominal sonography for trauma by Emergency Radiology Association in Turkey. Before the study, these investigators received additional ultrasound training in the area of limited echocardiography. This expanded training consisted of 3 hours of didactic session; a series revwew of normal and abnormal echocardiograms on unrolled 60 ED patients, performed in the presence of an experienced echocardiographer. Specific emphasis was placed on the technique for subjective estimation of LVEF.11 The EPs categorized ejection fractions (EFs) as normal or low according to movement of the mitral valve during diastole and also kinetics of interventricular septum, apex, and posterior wall of the left ventricle during systole on parasternal long axis view. EF was diagnosed as low if anterior leaflet of mitral valve (ALMV) opening did not occur beyond the midcavitary plane, together with a global hypokinetic nature of the left ventricle (Figure 1). If ALMV movement occurred beyond the midlevel of the left ventricular cavity towards the interventricular septum together with good global kinetics of the left ventricle, the patient was diagnosed as having normal EF (Figure 2). We have used both the kinetics of the left ventricle and ALMV movement together to detect patients with segmental wall motion abnormalities. Of those granting consent, the EPs performed BECH in left lateral decubitus position using an M7R® model ultrasound machine with a 3.6-MHz microconvex transducer (Mindray Bio-medical Electronics Co., Shenzhen, China) and ultrasonographic views were recorded blindly by the EPs. This procedure took less than 2 minutes. An evaluation form was completed by each EP. EF is estimated qualitatively (Low/Normal) by EPs and quantitatively (%) by cardiologist. Formal echocardiography performed with M7R® model ultrasound machine was reported by experienced echocardiographers by MSM, which was ordered after the patient was stabilized within a maximum of 2 hours after the backperform of 2 EPs. Echocardiography results were reported blinded to our study.
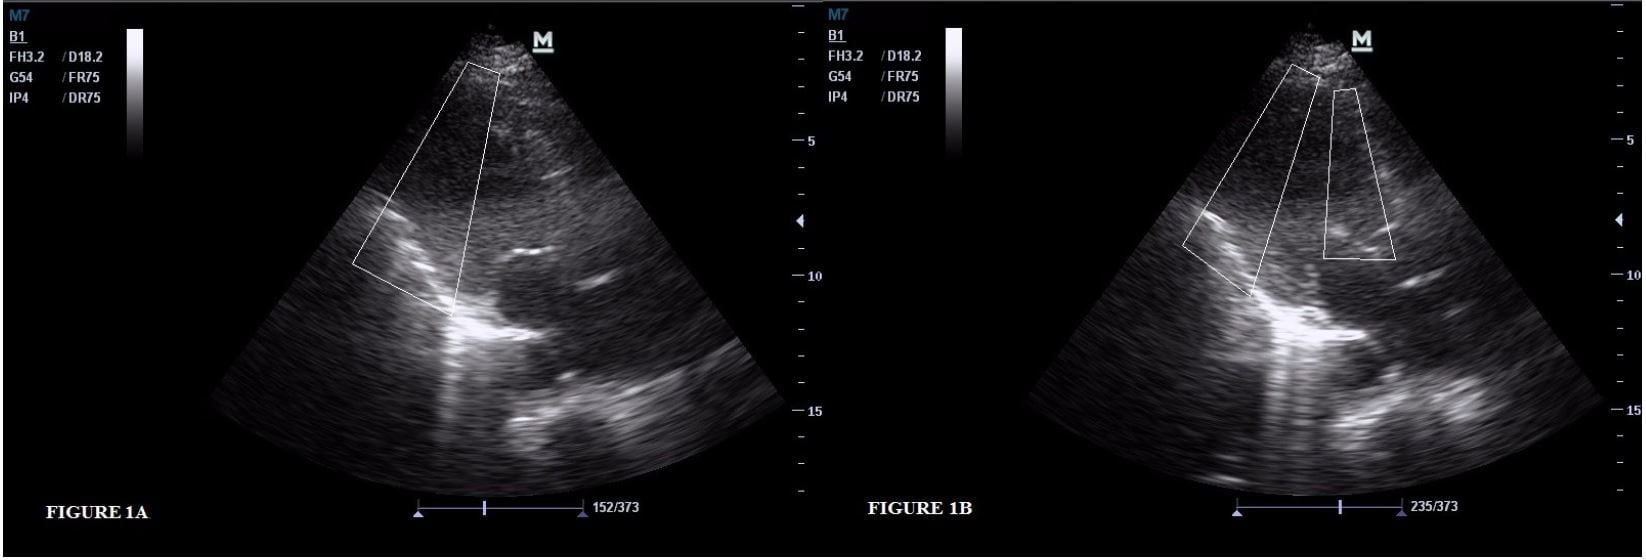
Figure 1. (A) Rectangular shape shows inadequate movement of interventricular septum and posterior wall of left ventricle towards each other during systole. (B) Small rectangular shape shows large distance between anterior leaflet of mitral valve and interventricular septum during diastole. Large rectangular shape shows interventricular septum and posterior wall of left ventricle distended from each other.
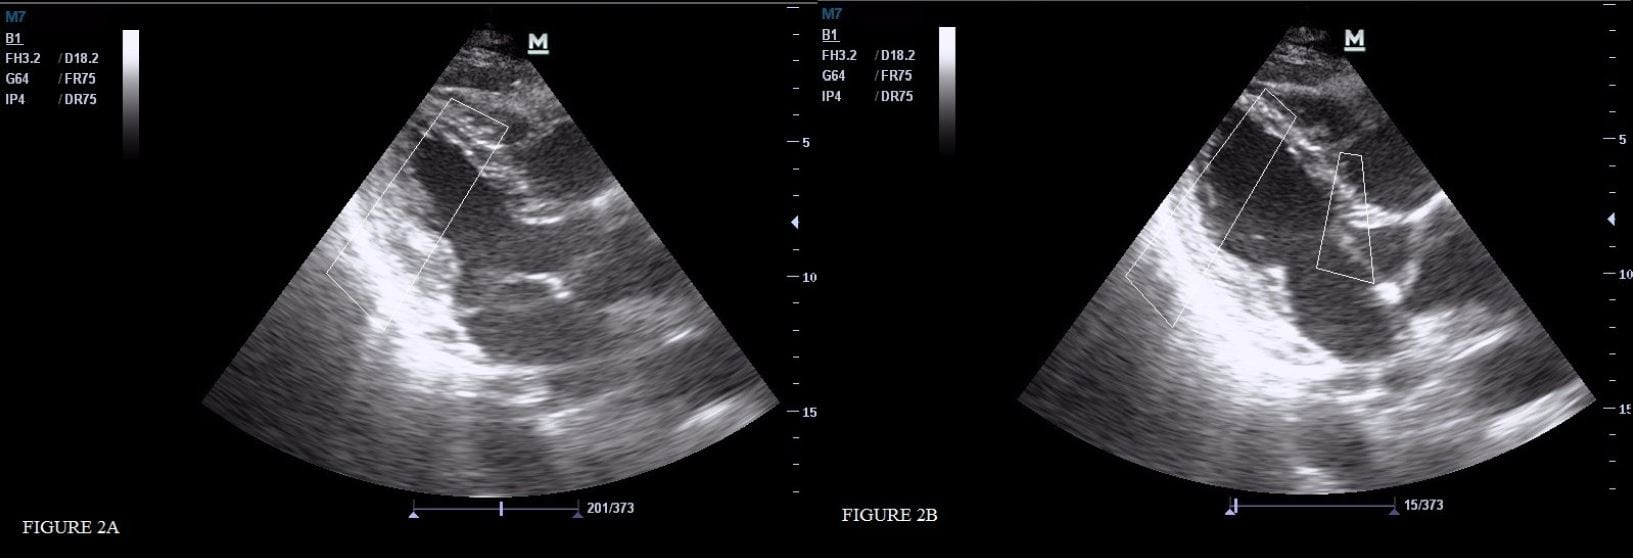
Figure 2. (A) Rectangular shape shows adequate movement of interventricular septum and posterior wall of left ventricle towards each other during systole. (B) Small rectangular shape shows close distance between anterior leaflet of mitral valve and interventricular septum during diastole. Large rectangular shape shows interventricular septum and posterior wall of left ventricle distended from each other.
STATISTICAL ANALYSES
Categorical data are reported as frequency percent and, when appropriate, range. Sensitivity, specificity, positive and negative predictive values, and positive and negative likelihood ratios were calculated for EPs using cardiologist reports as the criterion standard. These are reported with 95% confidence intervals (CI). We used Spearman’s correlation coefficients with 95% CIs to express correlations between each EP’s dichotomous estimate and dichotomized measured EF% (MFM) values by the cardiologist.
RESULTS
Patient enrollment occurred between January and June 2012. The 146 subjects enrolled in the study gave informed consent. We excluded 13 patients from the final statistical analysis, 6 because of poor image quality, 1 patient because of pregnancy, 2 because of previous thoracic surgery and 4 patients because of atrial fibrillation (Figure 3). Mean age of the study population was 69.76 years (SD: 11.74; 95% CI 67.75, 71.07); 59 (44.4%) were women and 74 (55.6%) were men. Past and present medical history features of the study population are shown in Table 1. All patients were examined by 2 EPs and by a cardiologist blinded to each other. VEF was reported as low or normal by EPs and EF was measured as a percentage by cardiologists. We dichotomized measured EF% (MFM) values as low and normal using a threshold of 55%, and compared this with the VEF of EPs with Spearman’s correlation, which resulted with coefficients of 0.87 (95% CI, 0.82–0.90) and 0.88 (95%, 0.84–0.91). All values presented a significant relationship between the visual estimate of EF by EPs and MFM by the cardiologist. Both EPs estimated one patient out of 133 (0.8%) as having a normal EF, but in fact they had low EF according to the cardiologist. On the other hand, 8 (6%) and 7 (5.3%) patients with a normal EF were falsely estimated as having a low EF by each EP, respectively. Intra-class correlation coefficient of the 2 EPs was 0.952 (95% CI: 0.934, 0.966). There were 3 patients in whom the estimates of EPs were different, and in all of these patients measured EFs were above 45%. Comparison of VEF by EPs and measured EF by cardiologists using MSM is shown in Table 2.
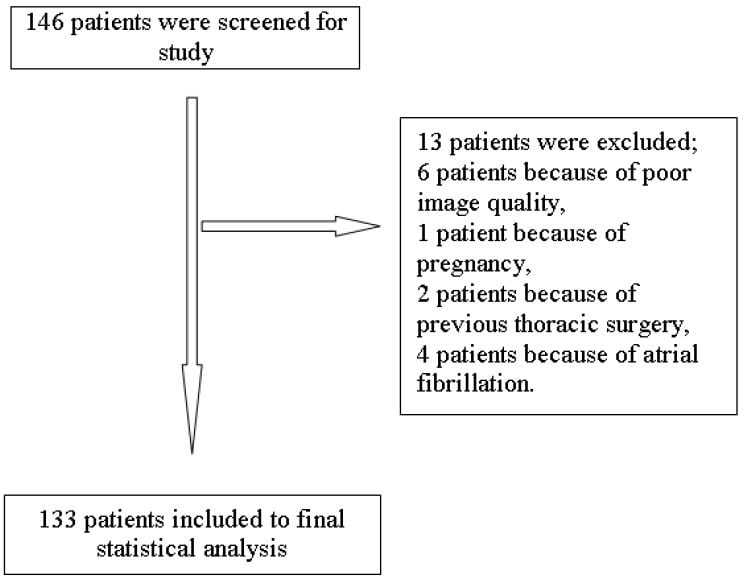
Figure 3. Study flow diagram.
Table 1. Past medical history features of the study population.
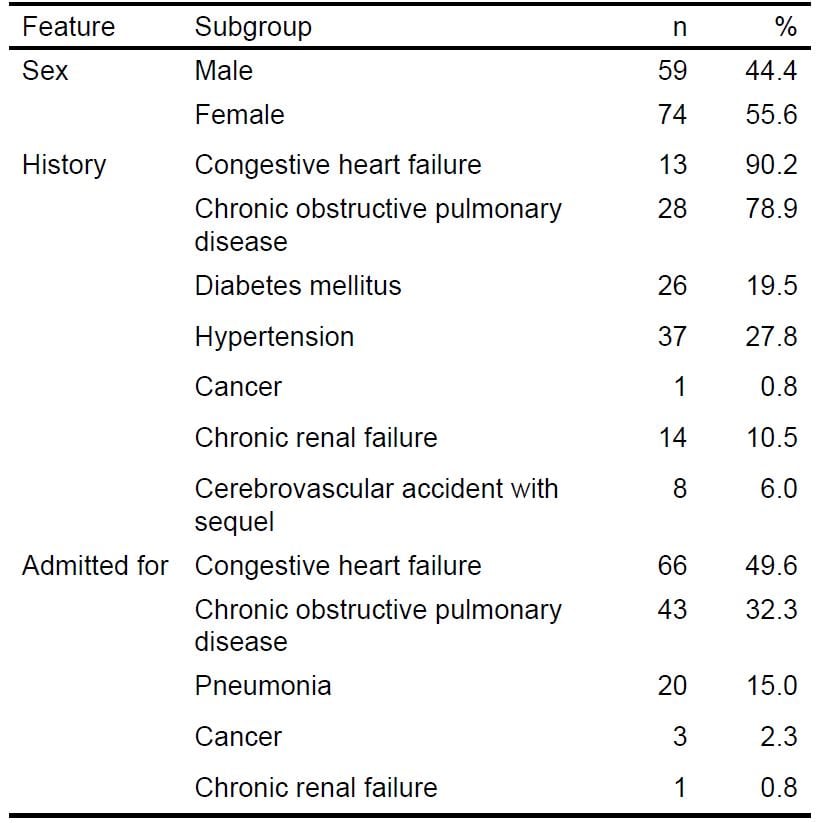
Table 2. Comparison of visual ejection fraction (VEF) by both blinded emergency physicians and modified Simpson’s method (MSM) by blinded cardiologist.
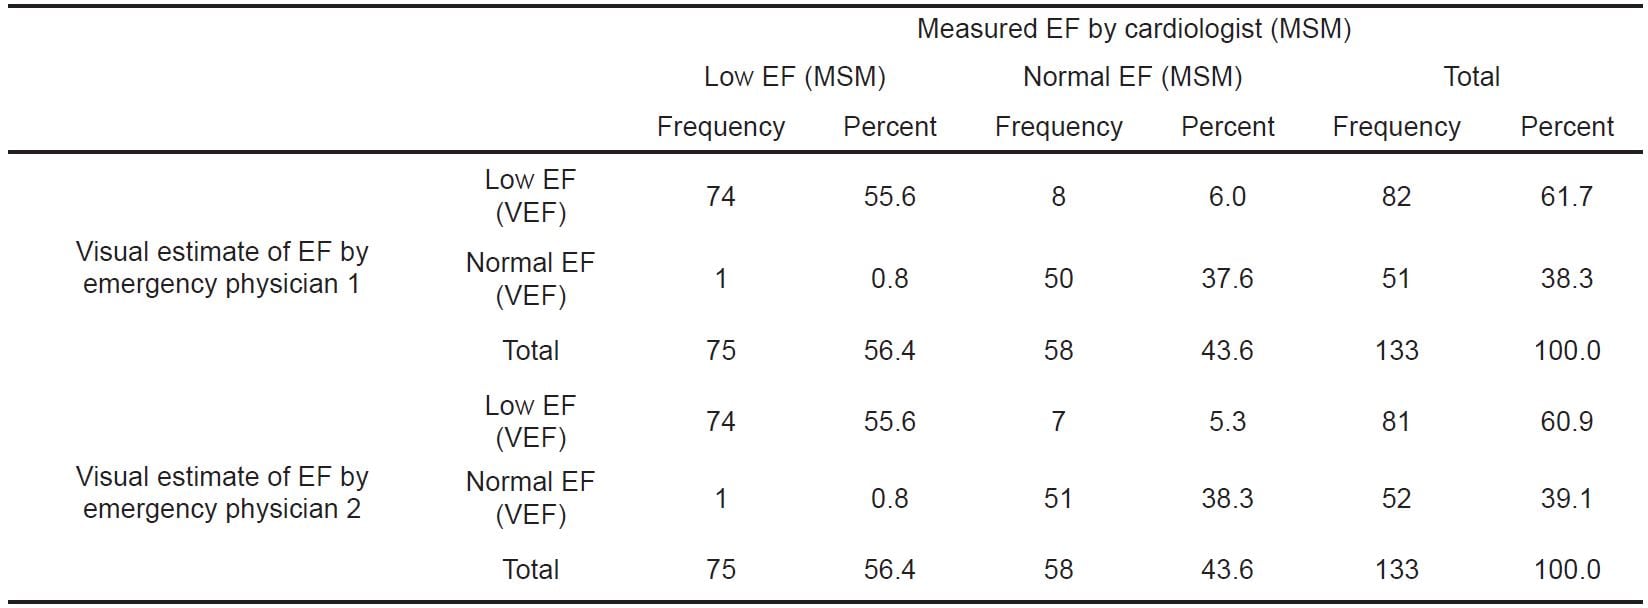
EF, ejection fraction; MSM, modified Simpson’s method
EPs’ visual estimate of EF was 98% sensitive and 86% specific for detecting a low EF in clinical settings. Clinical utility values for detecting a low EF by EPs compared to the cardiologist are shown in Table 3.
Table 3. Clinical utility values for detecting a low ejection fraction by both emergency physicians (EP) compared to a cardiologist.
 DISCUSSION
This study suggests that ED sonographers, with additional focused echocardiography training, can perform limited echocardiography successfully for the purposes of obtaining left ventricular systolic function information. For this study, the highest agreement was found in the low EF group, and there were 8 patients with normal EF who were diagnosed as low EF by EPs. From a clinical perspective, our results indicate that the low EF diagnosed on ED ultrasound would seem to offer the greatest value in patients with dyspnea. If dyspnea is present, the physician may entertain possible diagnoses related to the heart. However, a normal LVEF in dyspnoeic patients may direct the physician towards a number of broader differential diagnoses and management strategies in clinical practice. Randazzo et al.12 have shown that there was highest agreement between the EPs and formal echocardiography within the normal EF category, in contrast to our results. This discrepancy between results may be due to the patient selection of our study. In Randazzo’s study, they included hypotensive patients with shock, and only 5.7% of 115 patients had dyspnea, but we excluded the patients with acute coronary syndromes and included the dyspneic patients in our study. Therefore, we have increased the number of patients with dyspnea. Also, in a study conducted by Weekes et al.,13 it was shown that visual estimation of LVEF compared to fractional shortening of LV yielded a correlation of 0.84, which is similar to our results. Besides these studies, multiple studies published in the cardiology literature agree that visual estimates of ejection fraction are, in some cases, superior to other more elaborate quantitative measures of LVEF.14,15 Research has shown that a trained EP’s estimate of LVEF and central venous pressure using bedside ultrasonography in stable and hypotensive ED patients agrees with those of the cardiologist, comprehensive echocardiograms, and invasive monitors.12,16 Also, it has been previously shown by Gudmundsson et al. that eyeballing ejection fraction correlated closely with all formal methods, such as Simpson’s ejection fraction or fractional shortening.11 This study was different from ours in that they have screened the patients within a week after an acute myocardial infarction or patients with stable angina and also a single cardiologist performed all examinations and conducted all procedures. We excluded the patients with acute coronary syndrome because the local wall motion abnormalities might have affected the results of visual estimation. Also the MSM and visual estimations for the EFs of the screened patients were done by different physicians to decrease the selection bias of our study group. Our study results are also in concordance with those shown by other cardiology study groups, indicating that visual estimation of LVEF can be used with a high level of accuracy.15,17,18 Although these studies in cardiology literature showed that visual estimation of LVEF has reasonable agreement with the radionuclide EF in their study group, different EF measurement methods were performed by the same physicians. Because theserepetitive measurements might have been done to enhance their performance on the following measurements we thought that our method for this study reveals more accurate measuerement of visual estimation of LVEF. It was shown in a study by Akinboboye et al. that visual EF is an easy method to learn.19 Furthermore, a systematic review has shown that the limits of agreement were similar for Simpson ejection fraction, wall motion scoring index, and visual estimation of EF.20
Our study was an attempt to correlate visual estimates of LVEF with echocardiographic methods accepted by AHA guidelines. We believe that this is the first study to report serial visual estimations of LVEF in ED patients with dyspnea. Our findings are useful because most EPs do not perform quantitative measurements of left heart systolic function due to time constraints in the ED. High positive and low negative likelihood ratios show that a low EF can be reliably ruled in or out using an EP’s visual estimate. The serial visual assessments are quick and easily reproducible.
LIMITATIONS
Potential sources of error in our study included the possibility of patient sampling (convenience sampling). Our study had to be done with consecutive patient selection to decrease bias. Also, two EP investigators enrolled all the patients. To generalize our results, a study would need to be conducted with more than 2 investigators and increased patient enrollment.
CONCLUSION
Visual estimation of ejection fraction correlated significantly with cardiologist reports for the evaluation of left ventricular systolic function. Since it is readily and quickly performed, visual estimation could be used for ED management of patients, instead of the formal quantitative methods, which are more time consuming.
Footnotes
Address for Correspondence: Erden E Ünlüer, Department of Emergency Medicine, Izmir Katip Çelebi University Atatürk Research and Training Hospital. Email: erolerdenun@yahoo.com. 3 / 2014; 15:221 – 226
Submission history: Revision received February 18, 2013; Submitted August 23, 2013; Accepted September 10, 2013
Conflicts of Interest : By the WestJEM article submission agreement, all authors are required to disclose all affiliations, funding sources and financial or management relationships that could be perceived as potential sources of bias. The authors disclosed none.
REFERENCES
1. Boldt J, Menges T, Wollbrück M, et al. Is continuous cardiac output measurement using thermodilution reliable in critically ill patients?. Crit Care Med. 1994;22:1913-8.
2. Baron BJ, Scalae TM Acute blood loss. Emerg Med Clin North Am. 1996;14:35-55.
3. Nishimura RA, Tajik AJ, Shub C, et al. Role of two-dimensional echocardiography in the prediction of in-hospital complications after acute myocardial infarction. J Am Coll Cardiol. 1984;4:1080-7.
4. Kimura BJ, Bocchicchio M, Willis CL, et al. Screening cardiac ultrasonographic examination in patients with suspected cardiac disease in the emergency department. Am Heart J. 2001;142:324-30.
5. Rubin M Cardiac ultrasonography. Emerg Med Clin North Am. 1997;15:745-62.
6. Unlüer EE, Bayata S, Postaci N, et al. Limited bedside echocardiography by emergency physicians for diagnosis of diastolic heart failure. Emerg Med J. 2012;29:280-3.
7. Unlüer EE, Yavaşi O, Akoğlu H, et al. Bedside assessment of central venous pressure by sonographic measurement of right ventricular outflow-tract fractional shortening. Eur J Emerg Med. 2011.
8. Moore CL, Rose GA, Tayal VS, et al. Determination of left ventricular function by emergency physician echocardiography of hypotensive patients. Acad Emerg Med. 2002;9:186-93.
9. Secko MA, Lazar JM, Salciccioli LA, et al. Can junior emergency physicians use E-point septal separation to accurately estimate left ventricular function in acutely dyspneic patients?. Acad Emerg Med. 2011;18:1223-6.
10. Lang RM, Bierig M, Devereux RB, et al. Recommendations for chamber quantification. J Am Soc Echocardiogr. 2005;18:1440-63.
11. Gudmundsson P, Rydberg E, Winter R, et al. Visually estimated left ventricular ejection fraction by echocardiography is closely correlated with formal quantitative methods. Int J Cardiol. 2005;101:209-12.
12. Randazzo MR, Snoey ER, Levitt MA, et al. Accuracy of emergency physician assessment of left ventricular ejection fraction and central venous pressure using echocardiography. Acad Emerg Med. 2003;10:973-77.
13. Weekes AJ, Tassone HM, Babcock A, et al. Comparison of serial qualitative and quantitative assessments of caval indeks and left ventricular systolic function during early fluid resuscitation of hypotansive emergency department patients. Acad Emerg Med. 2011;18:912-21.
14. van Royen N, Jaffe CC, Krumholz HM, et al. Comparison and reproducibility of visual echocardiographic and quantitative radionuclide left ventricular ejection fractions. Am J Cardiol. 1996;77:843-50.
15. Amico AF, Lichtenberg GS, Reisner SA, et al. Superiority of visual versus computerized echocardiographic estimation of radionuclide left ventricular ejection fraction. Am Heart J. 1989;118:1259-65.
16. Moore CL, Rose GA, Tayal VS, et al. Determination of left ventricular function by emergency physician echocardiography of hypotansive patients. Acad Emerg Med. 2002;9:186-93.
17. Jensen-Urstad K, Bouvier F, Höjer J, et al. Comparison of different echocardiographic methods with radionuclide imaging for measuring left ventricular ejection fraction during acute myocardial infarction treated by thrombolitic therapy. Am J Cardiol. 1998;81:538-44.
18. van ‘t Hof AW, Schipper CW, Gerritse JG, et al. Comparison of radionuclide angiography with three echocardiographic parameters of left ventricular function in patients after myocardial infarction. Int J Card Imaging. 1998;14:413-8.
19. Akinbobeye O, Sumner J, Gopal A, et al. Visual estimation of ejection fraction by two-dimensional echocardiography: the learning curve. Clin Cardiol. 1995;18:726-9.
20. McGowan JH, Cleland JG. Reliability of reporting left ventricular systolic function by echocardiography: a systematic review of 3 methods. Am Heart J. 2003;146:380-2.