
| Author | Affiliation |
|---|---|
| Christine Riguzzi, MD | Highland Hospital, Alameda Health System, Oakland, California |
| H. Gene Hern, MD, MS | Highland Hospital, Alameda Health System, Oakland, California |
| Farnaz Vahidnia, MPH, PhD, MD | Highland Hospital, Alameda Health System, Oakland, California |
| Andrew Herring, MD | Highland Hospital, Alameda Health System, Oakland, California |
| Harrison Alter, MD, MS | Highland Hospital, Alameda Health System, Oakland, California |
Introduction
Methods
Results
Limitations
Discussion
Conclusions
ABSTRACT
Introduction
There has been concern of increased emergency department (ED) length of stay (LOS) during the months when new residents are orienting to their roles. This so-called “July Effect” has long been thought to increase LOS, and potentially contribute to hospital overcrowding and increased waiting time for patients. The objective of this study is to determine if the average ED LOS at the beginning of the hospital academic year differs for teaching hospitals with residents in the ED, when compared to other months of the year, and as compared to non-teaching hospitals without residents.
Methods
We performed a retrospective analysis of a nationally representative sample of 283,621 ED visits from the National Hospital Ambulatory Medical Care Survey (NHAMCS), from 2001 to 2008. We stratified the sample by proportion of visits seen by a resident, and compared July to the rest of the year, July to June, and July and August to the remainder of the year. We compared LOS for teaching hospitals to non-teaching hospitals. We used bivariate statistics, and multivariable regression modeling to adjust for covariates.
Results
Our findings show that at teaching hospitals with residents, there is no significant difference in mean LOS for the month of July (275 minutes) versus the rest of the year (259 min), July and August versus the rest of the year, or July versus June. Non-teaching hospital control samples yielded similar results with no significant difference in LOS for the same time periods. There was a significant difference found in mean LOS at teaching hospitals (260 minutes) as compared to non-teaching hospitals (185 minutes) throughout the year (p<0.0001).
Conclusion
Teaching hospitals with residents in the ED have slower throughput of patients, no matter what time of year. Thus, the “July Effect” does not appear to a factor in ED LOS. This has implications as overcrowding and patient boarding become more of a concern in our increasingly busy EDs. These results question the need for additional staffing early in the academic year. Teaching hospitals may already institute more robust staffing during this time, preventing any significant increase in LOS. Multiple factors contribute to long stays in the ED. While patients seen by residents stay longer in the ED, there is little variability throughout the academic year.
INTRODUCTION
“July Effect” or “July Phenomenon” is a well-known entity among the medical community. Many hold the belief that one would never want to have a family member in the hospital during July, when trainee doctors are beginning their new roles.
As medical students become interns and junior residents become senior in July, the amount of collective experience among trainees in the hospital is significantly less than the month prior. This effect is postulated to be responsible for increased errors resulting in poor outcomes. Previous studies have evaluated morbidity and mortality, surgical outcomes, hospital length of stay, and hospital charges early in the academic year as compared with non-academic hospitals or other times of the year.1–16 To date, these studies have yielded mixed results.
Little information exists on this effect within the emergency department (ED). While there are studies of length of stay (LOS) in the hospital during the month of July, it is unknown if the ED LOS varies throughout the academic year. ED LOS data is becoming increasingly important as ED usage rates increase, contributing to increasing ED crowding and boarding of patients. The objective of our study was to assess if length of stay varies throughout the year at teaching and non-teaching EDs.
METHODS
We used publicly available micro-data files of the 1996–2009 National Hospital Ambulatory Medical Care Survey (NHAMCS). NHAMCS is a national probability sample survey of visits to hospital outpatient and emergency departments, conducted by the National Center for Health Statistics (NCHS) of Centers for Disease Control and Prevention (CDC). Data is gathered for approximately 25,000 visits a year from approximately 600 EDs and outpatient centers.17 As this data is public and no patient identifiers are used, we were granted an exemption from our institutional review board review.
We performed a cross-sectional analysis of NHAMCS data. Pursuant to NHAMCS specifications, we weighted data by patient visit weight (patwt) and used the “cstratm” variable to reflect the multi-stage sampling design of the survey for variance estimation.
The “Length of visit” variable is calculated in the NHAMCS ED micro-data file from 2001 through 2009 and was used to define ED LOS in this analysis (n=295,870). We examined distribution of LOS using descriptive statistics, histograms, and Shapiro-Wilk W test for normal data. Both means and medians were calculated for this study population. Medians may be a more accurate way to represent ED LOS; a skewed distribution can affect the mean, favoring the direction of more lengthy ED stays, given the high frequency of patients boarding in the ED.19 Because of skewness in LOS data (for example, for January at non-teaching hospitals, mean=193.7 minutes with 95% confidence interval (CI) from 184.5 to 202.9; median=139, IQR=80–230), for the purpose of regression analysis, we transformed LOS to natural logarithm of LOS.
We defined “teaching hospital” by proportion of ED visits seen by residents and interns as specified by “resint” variable in NHAMCS. Per precedent, using methodology from a previous large NHAMCS study,18 a hospital was defined as a “teaching hospital” if the provider was recorded as ED resident/intern in more than 25% of ED visits in that hospital per year.
We compared LOS in “teaching” and “non-teaching” hospitals by month and year using descriptive statistics. We then compared LOS in the month of July vs. LOS in all other months, July versus June, July and August versus May and June, and July and August vs. all other months in teaching and non-teaching hospitals. We performed bivariate and multivariate analysis of log-transformed LOS in teaching vs. non-teaching hospitals including the following variables: year of visit, admission to the hospital, metropolitan/non-metropolitan status area, and safety-net status of the hospital, according the definition promulgated by the Centers for Disease Control and Prevention. All analyses were performed using STATA 11.0 (STATA Corp., College Station, Texas, USA) and a p-value equal to or greater than 0.05 was considered to be non-significant.
RESULTS
Using NHAMCS data, 295,870 ED visits from 2001 to 2009 were examined. These visits provide a purposeful and representative sample of ED visits within the United States (U.S.) during that timeframe. The majority (252,360) of these visits occurred at non-teaching hospitals. The remainder of these visits (43,510) occurred at teaching hospitals.
At teaching hospitals, the July and August median LOS was 169 min (IQR 95–288 min). During May and June, the median LOS was also 165 min (IQR=94–273). In the month of June, the median LOS was again 165 min (IQR 95–276 min).
When comparing teaching to non-teaching hospitals (Table 1), we did find a significant difference in LOS. LOS is significantly shorter at non-teaching hospitals throughout the year (median LOS=140 min, IQR 81–232 min at non-teaching hospitals, median LOS 165, IQR 94–276 min at teaching hospitals.
Table 1. Length of stay (LOS) in minutes in teaching* and non-teaching hospitals by month, emergency department NHAMCS (N= 262,382), 2001-2009.
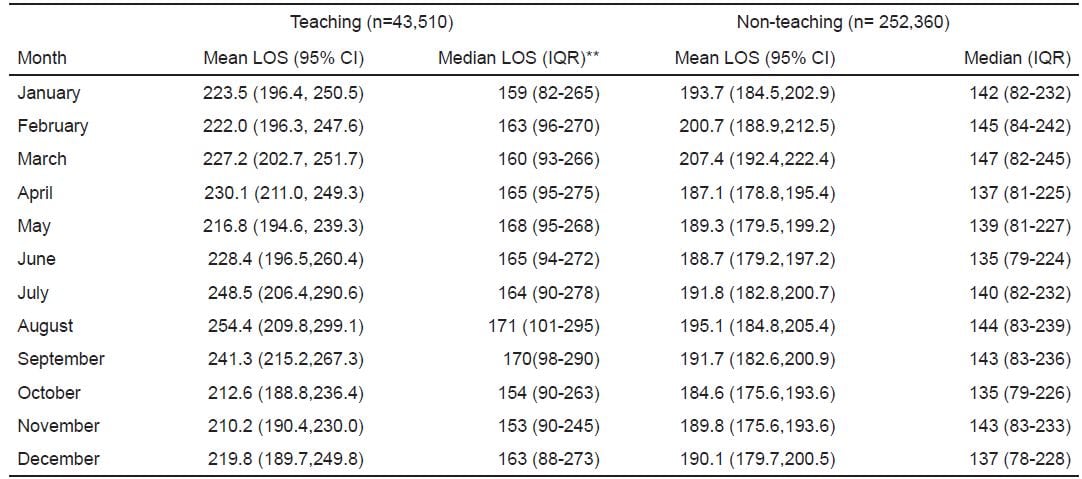
IQR, interquartile range
*A teaching hospital is a hospital where >25% of visits are performed by resident/intern as reported in NHAMCS survey
Adjusting for all covariates (Table 2), we found that teaching hospitals have 15% longer ED LOS throughout the year compared to non-teaching hospitals (95% CI=11–20%). We noted no difference in July and August LOS as compared to the rest of the year controlling for all covariates (adjusted LOS ratio=1.01, 95% CI=0.98–1.04).
Table 2. Factors associated with length of stay (LOS)*, 2001-2009.
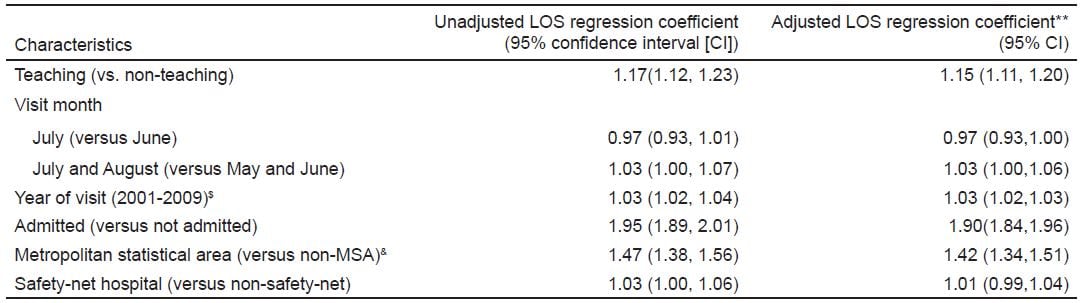
*LOS was transformed to natural logarithm of LOS in linear regression models. Coefficients were exponentiated to calculate ratio of LOS associated with 1 unit change in each covariate.
**Models included teaching status, visit month (one comparison at a time), visit year, hospital admission, MSA and safety-net.
$LOS ratio is associated with each year change from 2001- 2009;
&Based on actual location in conjunction with the definition of the Bureau of the Census and the United States Office of Management and Budget.
Examining both means and medians by month, we found little variation in LOS throughout the academic year among teaching hospitals. Given that previous studies of the July Effect used several different timeframes to compare the earlier to later academic year, we computed linear regression coefficients for July versus June, July versus the rest of the year, and July and August versus May and June, all with and without adjustment for covariates. We failed to find any significant differences using any of these calculations.
 for teaching and non-teaching hospitals throughout the year.")
Figure. Comparing emergency department length of stay medians (in minutes) for teaching and non-teaching hospitals throughout the year.
Linear regression coefficients were estimated controlling for a variety of factors that could influence LOS. Admitted and non-admitted patient visits, urban and rural hospitals (defined by Metropolitan Statistical Area), and safety-net and non safety-net hospitals (as defined in NHAMCS) were all examined. Of note, adjusting for all other covariates, the LOS of admitted patients was 91% longer than non-admitted patients (95% CI=81%–98%). Also, the LOS of patient visits at urban hospitals were 42% longer than at rural hospitals, controlling for all other covariates (95% CI=34%–51%).
LIMITATIONS
Several limitations exist within our study. As with other retrospective studies, we were not able to control for a variety of factors which may have influenced the outcomes measured.
Teaching EDs also may increase staffing in July, using physician assistants and nurse practitioners to provide coverage as new residents acclimate to their roles. Also, hospitals may increase the number of attending physicians and senior providers working in the ED in July to provide closer supervision to new residents and interns and facilitate greater efficiency.
It is important to note that not all academic years begin in July. While the preponderance start in July, some teaching programs begin the academic year in mid-June or August, or rarely, have variable start dates, incorporating one resident at a time into the program throughout the year.
Our definition of teaching hospital was one in which more than 25% of patient visits were seen by residents/interns. This does not encompass all teaching hospitals by any means. We were not able to separate those hospitals with an emergency medicine (EM) residency program or those who had non-EM residents working in the ED. Also, NHAMCS does not record year of training of the resident for the patient visit, thus did not allow us to assess length of stay based on level of training, which may have played a role in our findings.
Another limitation within our study is inability to control for the multitude of factors influencing LOS, beyond academic year cycles. Length of stay has been associated with elective surgical admission, number of ED admissions, and hospital occupancy.20 Seasonal trends in ED usage may exist, such as in flu season or in warm weather when more trauma patients are seen in EDs, which could contribute to LOS. By comparing teaching to non-teaching hospitals directly, we hope to control for some of these factors.
Crowding within the ED has been demonstrated to correlate with increased LOS in several studies. A recent study showed that in patients with asthma who were ultimately discharged, length of stay increased as the ED became more crowded.21 Crowding also influences LOS in higher acuity patients who require admission.22 Within our study, crowding and patient boarding could be responsible for increases in LOS throughout the year within both types of EDs. It is unclear if crowding varies between academic and non-academic EDs based on the current body of literature.
DISCUSSION
According to NHAMCS data, the number of ED visits in 1992 in the U.S. was approximately 90 million.23 Data from 2008 demonstrated 124 million visits,24 a 38% increase over that 16 year interval. compared with a 19% increase in U.S. population over the same period.25 EDs have become the safety net for the medically underserved, such as patients with Medicaid.26 These growing patient volumes give new urgency to patient wait times, crowding, and the need to board patients in the ED; all issues that may have been seen as less important in an earlier era.
Given the increased patient volumes, it is not surprising that ED LOS has steadily increased within the U.S. over the last several years.27 With patients staying longer in the ED, sick patients in the waiting room may wait longer to been seen, and patients may leave the ED without being seen.
Whether the “July Effect” actually exists or is simply a belief based on anecdote is hard to definitively establish. Previous studies have yielded mixed results. While it seems intuitive that there must be a measurable outcome of performance that is affected by the beginning of the academic year, previous research has yielded conflicting results. There are no studies to our knowledge examining the “July Effect” in the emergency department.
A recent study examined preventable complications and deaths in the first two months of the academic year as compared to the last two months of the year at an academic level I trauma center.10 This study showed increased rates of preventable complications early in the year, however these complications had no impact on mortality.
Similar results have been found in studies of surgical outcomes. For example, a retrospective review compared outcomes for patients undergoing appendectomy at two public teaching hospitals early in the academic year and found no difference in wound infection or length of hospitalization.16 Other studies of similar outcomes in surgical patients also demonstrate no change in morbidity and mortality early in the year.5
While there appear to be some variables that do change early in the year based on these studies, such as longer operative times, ultimately, patient-centered outcomes were not affected.5,16 This argues against the July Effect as a clinically significant entity. However, these results are in conflict with other studies of surgical outcomes which have found small differences early in the year for hip fracture mortality and pediatric shunt placement outcomes.1,11
The “July Effect” has been examined as an entity outside of the realm of surgical outcomes as well. Within the obstetrical literature, a single study using a national database showed no difference in rates of cesarean section, bladder injury, perineal lacerations or shoulder dystocia early in the academic year.6
This finding disagrees with a retrospective cohort study which examined undesired events among new anesthesia trainees at a single institution. In this study, an increased rate ratio of undesired effects such as nerve injuries, patient de-saturation, and endotracheal tube mis-placement.8
Medication errors have also been studied for the month of July. U.S. death certificates were used to evaluate observed number of deaths and compared to expected number of deaths for the month of July. Using counties with and without teaching hospitals throughout the U.S. to measure effect, percentage of fatal medication errors was significantly higher in counties with teaching hospitals than those without in the month of July.12
Among several studies on length of hospital stay as a marker for the July Effect, authors have reached different conclusions. In one study, hospital mortality and LOS in the intensive care unity was examined retrospectively at multiple hospitals in one region of the U.S. Adjusting for illness severity, no differences in mortality were found early in the academic year. Intensive care unit LOS was unchanged throughout the year.3 A study at a single center yielded similar results. Analyzing hospital LOS and ancillary charges, no differences were found.4 In comparison, a study in a single institution over many years demonstrated a steady decline in LOS over the academic year.13
Our study adds to the argument that the July Effect is more colorful lore than observable phenomenon. We found that patients spent the same amount of time in the ED no matter what time of year. While a short LOS does not necessarily mean better care, it is an important factor when considering ED quality. A functional and efficient ED leads to shorter stays, which do not vary much throughout the year in our study.
Given little EM literature exists in this area, further research could include rate of test ordering, experience level of providers, length of patient sign outs at change of shift, or unexpected return visits to the ED.
CONCLUSIONS
A variety of factors contribute to ED LOS, but the July Effect does not appear to be among them. In teaching hospitals, which we define as hospitals in which 25% or more of patient visits in the ED involve a resident, the length of stay does not vary throughout the year. Our study did show a significantly shorter LOS in non-academic as compared to teaching hospitals. Thus, when a higher proportion of residents are responsible for patient care (more than 25% versus less than 25%), length of stay is increased. Our study, using a large sample size, adds to the current body of literature that argues the “July Effect” is not a clinically significant entity.
Footnotes
Address for Correspondence: Christine Riguzzi, MD. Alameda County Medical Center. Email: christineriguzzi@gmail.com. 2 / 2014; 15:88 – 93
Submission history: Revision received May 8, 2013; Submitted October 2, 2013; Accepted October 4, 2013
Conflicts of Interest: By the WestJEM article submission agreement, all authors are required to disclose all affiliations, funding sources and financial or management relationships that could be perceived as potential sources of bias. The authors disclosed none.
REFERENCES
1. Anderson KL, Koval KJ, Spratt KF. Hip fracture outcome: is there a “July effect”? Am J Orthop. 2009;38:606–611. [PubMed]
2. Bakaeen FG, Huh J, LeMaire SA, et al. The July effect: impact of the beginning of the academic cycle on cardiac surgical outcomes in a cohort of 70,616 patients. Ann Thorac Surg. 2009;88:70–75.[PubMed]
3. Barry WA, Rosenthal GE. Is there a July phenomenon?: the effect of July admission on intensive care mortality and length of stay in teaching hospitals. J Gen Intern Med. 2003;18:639–645.[PMC free article] [PubMed]
4. Buchwald D, Komaroff AL, Cook EF, et al. Indirect costs for medical education: is there a July phenomenon? Arch Intern Med. 1989;149:765–768. [PubMed]
5. Dhaliwal AS, Chu D, Deswal A, et al. The July effect and cardiac surgery: the effect of the beginning of the academic cycle on outcomes. Am J Surgery. 2008;196:720–725. [PubMed]
6. Ford AA, Bateman BT, Simpson LL, et al. Nationwide data confirms absence of ‘July phenomenon’ in obstetrics: it’s safe to deliver in July. J Perinatology. 2007;27:73–76. [PubMed]
7. Garcia S, Canoniero M, Young L. The effect of July admission in the process of care of patients with acute cardiovascular conditions. South Med J. 2009;102:602–607. [PubMed]
8. Haller G, Myles PS, Taffe P, et al. Rate of undesirable events at beginning of academic year: retrospective cohort study. BMJ. 2009;339:b3974. [PMC free article] [PubMed]
9. Highstead RG, Johnson LC, Street JH, et al. July- as good a time as any to be injured. J Trauma.2009;67:1087–1090. [PubMed]
10. Inaba K, Recinos G, Teixeira PG, et al. Complications and death at the start of the new academic year: is there a July Phenomenon? J Trauma. 2010;68:19–22. [PubMed]
11. Kestle JR, Cochrane DD, Drake JM. Shunt insertion in the summer: is it safe? J Neurosurg. 2006;105:165–168. [PubMed]
12. Phillips DP, Barker GE. A July spike in fatal medication errors: a possible effect of new medical residents. J Gen Intern Med. 2010;25:774–779. [PMC free article] [PubMed]
13. Rich EC, Gifford G, Luxenberg M, et al. The relationship of house staff experience to the cost and quality of inpatient care. JAMA. 1990;263:953–957. [PubMed]
14. Rich EC, Hillson SD, Dowd B, et al. Specialty differences in the ‘July phenomenon’ for Twin cities teaching hospitals. Medical Care. 1993;31:73–83. [PubMed]
15. Shulkin D. The July phenomenon revisited: are hospital complications associated with new house staff? Am J Med Qual. 1995;10:14–17. [PubMed]
16. Yaghoubian A, de Virgilio C, Chiu V, et al. “July effect” and appendicitis. J Surg Ed. 2010;67:157–160. [PubMed]
17. Centers for Disease Control and Prevention. NHAMCS description. US Centers for Disease Control and Prevention Web site. [Accessed April 29, 2011].http://www.cdc.gov/nchs/about/major/ahcd/sampham.htm.
18. Blackwell CD, Gorelick M, Holmes JF, et al. Pediatric head trauma: changes in use of computed tomography in emergency departments in the United States over time. Ann Emerg Med. 2007;49:320–324. [PubMed]
19. Qualls M, Pallin DJ, Schuur JD. Parametric versus nonparametric statistical tests: the length of stay example. Acad Emerg Med. 2010;17:1113–1121. [PubMed]
20. Rathlev NK, Chessare J, Olshaer J, et al. Time series analysis of variables associated with daily mean emergency department length of stay. Ann Emerg Med. 2007;49:265–271. [PubMed]
21. Pines JM, Prabhu A, Hilton JA, et al. The effect of emergency department crowding on length of stay and medication treatment times in discharged patients with acute asthma. Acad Emerg Med.2010;17:834–839. [PubMed]
22. McCarthy ML, Zeger SL, Ding R, et al. Crowding delays treatment and lengthens emergency department length of stay, even among high-acuity patients. Ann Emerg Med. 2009;54:492–503.[PubMed]
23. McCaig LF. National Hospital Ambulatory Medical Care Survey: 1992 emergency department summary. Advance data from vital and health statistics. National Center for Health Statistics. 1994;(245) [PubMed]
24. Table 2. Emergency department visits, by patient age, sex, and residence: United States, 2008. National Hospital Ambulatory Medical Care Survey; [Accessed April 29, 2011].http://www.cdc.gov/nchs/data/ahcd/nhamcs_emergency/nhamcsed2008.pdf.
25. Kish JN. U.S. Population 1776 to Present. [Accessed October 2, 2013].https://www.google.com/fusiontables/DataSource?docid=1F1LWhYAo54sCTRkcnSJ1aZ8D9WUcEcxWlf26Ug.
26. Tang N, Stein J, Hsia RY, et al. Trends and characteristics of US emergency department visits, 1997–2007. JAMA. 2010;304:664–670. [PMC free article] [PubMed]
27. Herring A, Wilper A, Himmelstein DU, et al. Increasing length of stay among adult visits to U.S emergency departments, 2001–2005. Acad Emerg Med. 2009;16:609–616. [PubMed]