
| Author | Affiliations |
| Thomas Seibert, MD, MS | University of Colorado, School of Medicine, Aurora, Colorado |
| Kathryn Veazey, MD, BA | University of Colorado, School of Medicine, Aurora, Colorado |
| Paul Leccese, BS | University of Colorado, School of Medicine, Aurora, Colorado |
| Jeffrey Druck, MD | University of Colorado, School of Medicine, Department of Emergency Medicine, Aurora, Colorado |
Introduction
Methods
Results
Discussion
Limitations
Conclusion
ABSTRACT
Introduction
This study examines the emergency department (ED) waiting room (WR) population’s knowledge about the ED process and hospital function and explores the types of educational materials that might appeal to patients and their companions in an ED waiting room. Our goal was to identify potential high-impact opportunities for patient education.
Methods
A 32-question survey about demographics, usage of primary care physicians (PCP), understanding of the ED and triage process, desire to know about delays, health education and understanding of teaching hospitals was offered to all qualified individuals.
Results
Five hundred and forty-four surveys were returned. Fifty-five percent reported having a PCP, of which 53% (29% of all WR patients) called a PCP prior to coming to the ED. It was found that 51.2% can define triage; 51% as an acuity assessment and 17% as a vital signs check. Sixty-nine percent knew why patients were seen according to triage priority. Seventy-two percent wanted to know about delays, yet only 25% wanted to know others’ wait times. People wanted updates every 41 minutes and only three percent wanted a physician to do this. Forty-one percent wanted information on how the ED functions, 60% via handouts and 43% via video. Information on updates and common medical emergencies is significantly more important than material on common illnesses, finding a PCP, or ED function (p<0.05). Median estimated time for medical workup ranged from 35 minutes for radiographs, to one hour for lab results, computed tomography, specialist consult, and admission. Sixty-nine percent knew the definition of a teaching hospital and of those, 87% knew they were at a teaching hospital. Subgroup analysis between racial groups showed significantly reduced knowledge of the definitions of triage and teaching hospitals and significantly increased desire for information on ED function in minority groups (p<0.05).
Conclusion
The major findings in this study were that many visitors would like handouts about ED function and medical emergencies over other topics. Additionally, the knowledge of functions such as triage and teaching hospitals were 70% and 69%, respectively. This was reduced in non-Caucasian ethnicities, while there was an increased desire for information on ED function relative to Caucasians. This research suggests increasing updates and educational materials in the waiting room could impact the waiting room and overall hospital experience. [West J Emerg Med. 2014;15(7):-0.]
INTRODUCTION
There were 129.8 million emergency department (ED) visits annually in the United States in 2010.1 Nationally, ED visits have been increasing every year, with the mean occupancy rate increasing at an even more rapid rate.2 As a result, a substantial amount of time is spent in ED waiting rooms. A 2006 study estimated that the average ED wait time was 45 minutes with a range of 27 to 83 minutes.3 Time spent in the waiting room may bring frustration to patients and their family members as wait times extend, other patients receive care, and no updates are given. Educating patients while they wait to be seen could be a valuable tool that has been minimally studied. Studies on health education in the ED waiting room have shown that patients are interested in wellness topics and desire education in the form of brochures and books.4 A study evaluating the effectiveness of showing patients a video explaining what to expect during an ED visit demonstrated increased patient satisfaction with the visit.5 However, no study to date has specifically assessed patients’ knowledge of the ED visit process including the length of or cause for delays, what information they would like to know while they wait, and their understanding of the triage process. The lack of information and understanding of patient’s desires and knowledge of the ED process makes it very difficult for hospital administrators, physicians, and staff to address patients’ needs. It also creates challenges when trying to deliver the desired information to the waiting room (WR) population in order to create a better ED experience with increased patient satisfaction.
The objective of this study was to determine baseline knowledge of ED and hospital processes, and to establish types of information WR patients want, including expected wait times, causes of delays, and the triage process. Furthermore, we sought to determine how they would like this information delivered. In addition, we asked patients and family members what were expected estimated times for labs, imaging studies, and admission. Secondarily we sought to determine if different desires correlate with racial groups, and to assess if patients wanted educational health materials.
METHODS
Study Design, Setting, Population, and Protocol
Study design and methods were approved by the local institutional review board. The study was conducted at an urban university teaching hospital in the WR of the ED. The 32-bed ED had 72,000 annual visits at the time of the study and is an American College of Surgeons Level II trauma center. A written survey was distributed to eligible participants during convenience-selected blocks of time between December 2011 and February 2013. These survey blocks ranged in length from two to eight hours and were chosen to include various times of day and days of the week. Inclusion criteria included patients registering for medical care and their accompanying family members, friends, or coworkers, age greater than 18, the ability to understand written English or Spanish, arrival by personal transportation to the ED, and not needing immediate medical attention. Any person meeting inclusion criteria was offered a survey by the research assistant (RA) after the registration process was completed. Only one member of each group of a patient plus his or her companions was offered a survey. Participants were asked to fill out the survey and place it in a collection box when finished, thereby maintaining confidentiality; they were informed that the survey was optional both verbally and by reading the first paragraph of the survey. The RA was available to answer questions and monitored the WR while participants filled out the survey.
The survey was developed through a consensus panel of emergency physicians (EP) that was subsequently evaluated through mock participants. The English survey was translated into Spanish by a native speaking, certified translator. Surveys were deployed in paper format. Final survey design resulted in 32 mixed response questions with a Flesch-Kincaid reading grade level of 6.5 (see appendix A). Answers to “free-text” questions were deemed correct or incorrect as compared a standard set by a consensus of EPs and researchers. For questions 7-9, asking why some patients are seen before others despite order of arrival, responses were judged to be correct if some mention was made of patients being seen in order of acuity. For question 11, asking the definition of triage, responses were sorted into three categories: Those making a mention of triage as an acuity check, those defining triage as a vital signs check, and all others (which were judged to be incorrect).
Measurements and Data Analysis
We did data analysis with R version 3.1.0 (Vienna, Austria) and Microsoft Excel 2010 (Redmond, Washington), with the assistance from the university’s Research Consulting Laboratory. Responses for each question on the survey were first compared between the English and Spanish surveys. We analyzed differences between language groups as categorical variables using a Chi-squared test. When the assumptions of the Chi-squared test were not met, a Fisher’s exact test was used. For this analysis, questions 1 and 20-24 were analyzed as continuous variables and compared between language groups using a two-sample t-test. Because 47 comparisons were made, we used a significance threshold of p<0.0001 for all comparisons.
No significant differences were noted between English and Spanish language survey responses except for race/ethnicity (See Results). As a result, in subsequent analysis, responses from English and Spanish surveys were combined and analyzed as a single group. We compared the responses to questions 20-24 using analysis of variance with the question as a categorical predictor and the response as a continuous outcome. Questions 14 and 28 were compared on the log-scale using two-sample t-tests and then the results were converted back to a normal scale due to highly skewed results. The results for these items are presented as the geometric mean and a 95% confidence interval. We omitted responses with a value of 0 from this portion of the analysis.
Finally, we made comparisons between racial/ethnic groups for questions 5, 10, 16, and 25. Native American and Asian respondents were combined with “Other” respondents in statistical analysis, while Caucasians, African-Americans, and Hispanics were analyzed as their own groups. We made comparisons between groups using logistic regression. Differences between individual ethnic groups were compared when the overall test ratio reached significance. We used the Tukey honest significant difference method to adjust p-values for multiple pairwise corrections for multiple hypotheses testing. Adjusted p-values less than 0.05 were considered significant.
On two separate surveys, participants responded “No” to question 10 (“Do you know what triage means?”) and then also attempted to define triage, which they were not instructed to do unless answering “Yes” to question 10. These two results were included in the subsequent analysis despite this discrepancy.
RESULTS
A total of 544 surveys were returned to the collection box (93.7% of those that were distributed to consenting participants), supporting acceptable research protocol. Of these surveys, 7.1% were in Spanish. Only ethnicity/race was significantly different between English and Spanish surveys (p<0.0001). For all subsequent analyses, results from English and Spanish surveys were therefore combined and analyzed as a group. On average, 25 out of the 32 of the questions were completed. Demographic data regarding respondents is displayed in Table 1.
Table 1. Demographics of respondents surveyed.
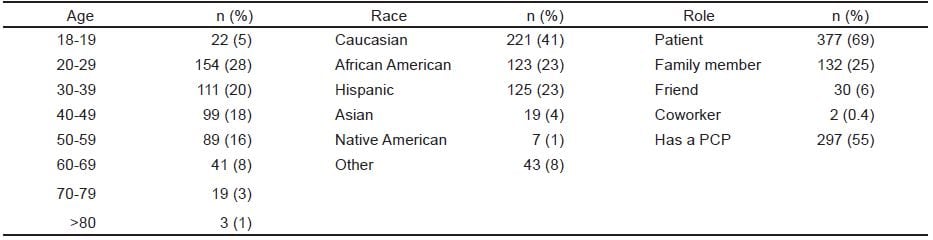
PCP, primary care physician
Of respondents, 54.9% reported having an established relationship with a primary care physician (PCP). Of those respondents with a PCP, 53.0% called their PCP. The PCP informed 45.1% of those who called they were ill enough to require a visit to the ED, 33.4% were told there were no appointments available, 14.4% were told they needed further testing, and 6.9% were told they were no longer the PCP’s patient.
Of all respondents, 68.8% claimed to know why some patients were seen sooner than others despite arriving later. Of that group, 87.0% were able to give a valid reason, determined by a consensus of professional opinion of EPs and the research group (see Methods), for this practice while 13.0% were not. Of all respondents 31.2% reported they did not know why some patients were seen sooner than others despite arriving later. We observed a statistically significant difference in the percentage of respondents reporting it is fair to see some patients before others between the group who did not claim to know why this happens and the group who both claimed they did know why this happens and provided a valid explanation as to why (Table 2).
Table 2. Proportion of respondents reporting it is fair to see some patients before others despite later arrival, stratified by self-reported knowledge of why this occurs and ability to provide a valid reason why it does.
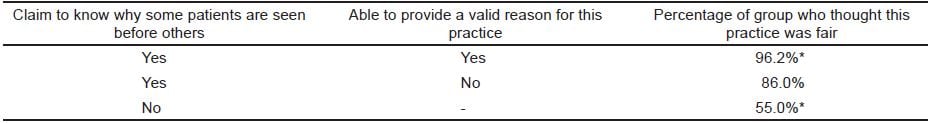
* Indicates statistically significant difference between groups (p<0.0001).
Of respondents, 48.7% claimed to know what triage meant. Of respondents who attempted to define triage, 51.9% defined it as an evaluation of the patient’s acuity, 17.5% defined in as a vital signs check, and 30.6% of respondents gave an incorrect answer as judged by the authors using a consensus definition of triage (See Methods).
When asked what information they would like to be provided with, 72.2% of respondents indicated they would like to know about foreseeable delays, while only 24.6% of respondents wanted to know about other patients’ wait times. Respondents wanted to receive updates every 41 minutes on average (SD ± 32 minutes). Seventy-four percent of respondents had no preference who gave these updates, while 13.7% of respondents felt a clerk should provide the updates, 9.0% of respondents preferred a nurse, and 3.3% of respondents preferred the updates coming directly from physicians.
Forty-one percent of respondents would like to be provided with more information on how the ED functions. When asked in which medium they would like this information, 59.9% of respondents indicated they would like handouts, 42.9% indicated they would like videos, and 9.5% indicated they would like updates through a computer in the waiting room (note: percentages do not add to 100% because respondents were able to choose multiple answers). When asked what information they found important on a scale of 1 (not important) to 4 (very important), information on updates (mean 2.93; 95% CI 2.85-3.02) and serious medical conditions such as cerebral vascular accidents and myocardial infarctions (mean 2.90; 95% CI 2.81-2.99) were significantly more important to respondents (p<0.05) than information regarding common illnesses (mean 2.68; 95% CI 2.59-2.77), finding a PCP (mean 2.71; 95% CI 2.62-2.80), and ED function (mean 2.66; 95% CI 2.57-2.75) (Figure 1).
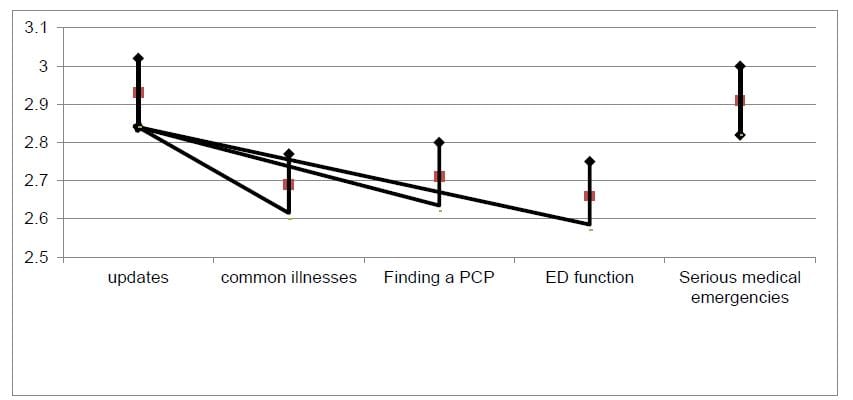 Figure 1. Rated level of importance of information available in the emergency department waiting room on a scale from 1 (not important) to 4 (very important); mean value with 95% CI displayed.
PCP, primary care physician; ED, emergency department
In regards to knowledge about teaching hospitals, 69.2% of respondents claimed to know what a teaching hospital was, and 87.4% of this group knew they were currently in a teaching hospital. When asked to identify aspects that differentiate a teaching hospital from other hospitals, respondents selected attributes shown in Figure 2.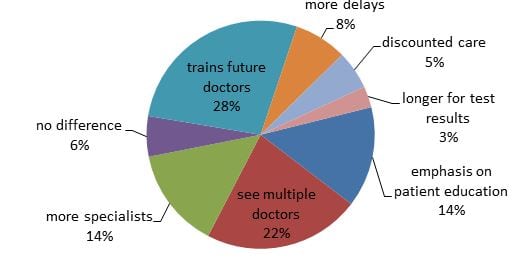 Figure 2. Aspects of teaching hospitals compared to other hospitals by waiting room respondents.
Respondents were asked to estimate the time it would take to complete lab work, x-rays, computed tomography (CT), specialist consultations, and hospital admission. The ranges of responses were large with the mean considerably skewed from outliers so interquartile ranges (IQR) were reported along with medians instead of means and standard deviations. Lab work had an IQR of 0.5 to 1 h with a median of 1 h. X-rays also had an IQR of 0.5 to 1 h and a median of 0.58 h. CTs had an IQR of 0.5 to 1.34 h with a median of 1 h. Consultations with specialists had an IQR of 0.5 to 1.5 h and a median of 1 h, and admissions had an IQR of 0.62 to 2 h with a median of 1 h. None of these were found to be significantly different from another.
Compared to Caucasians, there was reduced likelihood of answering “yes” when asked what triage meant among African-Americans (OR 0.46, 95% CI 0.29-0.72, p=0.003), Hispanics (OR 0.23, 95% CI 0.14-0.37, p<0.001), and “Others” (OR 0.36, 95% CI 0.20-0.63, p=0.002). Conversely, compared to Caucasians there was an increased likelihood of answering “yes” when asked about a desire for information on ED function by African-Americans (OR 3.01, 95% CI 1.89-4.84, p<0.001), Hispanics (OR 1.99, 95% CI 1.24-3.20, p=0.016), and “Others” (OR 3.12, 95% CI 1.76-5.58, p<0.001). Furthermore, compared to Caucasians, there was a decreased likelihood of answering “yes” when asked whether the university hospital was a teaching hospital among African-Americans (OR 0.40, 95% CI 0.24-0.68, p=0.002), Hispanics (OR 0.17, 95% CI 0.10-0.28, p<0.001), and “Others” (OR 0.40, 95% CI 0.21-0.75, p=0.015).
DISCUSSION
Multiple factors, such as increased length of stay, lack of hospital beds leading to ED boarding and an aging population, have led to increased ED WR times.6 While many strategies have been attempted to expedite and improve the WR experience, hospitals continue to struggle with how to manage their ED waiting rooms to improve patient satisfaction of the visit. Extended length of stay in the WR is a serious concern, and it is the number one reason patients with possible critical medical issues leave without being seen by a provider.7 Many strategies have been used to reduce the time or improve the experience of the WR, including physician/physician assistant triage, wait-time timers, and remodeling waiting rooms.4,8
Patients who left without being seen also cited lack of communication as a major reason for leaving.9 To reduce the communication barrier between patients and medical providers and to interact effectively with the WR population, the medical community must understand what patients wish to know as they wait and how to best describe ED workflow to patients.
This study allows us to approach ED communication improvement projects with a better understanding of what needs to be conveyed to improve the experience in the WR. Defining how the ED functions appears to be an area of improvement as only 70% of respondents were able to give a valid definition of triage – a mainstay of ED function. Explaining how the ED functions via handouts or video, combined with information on serious medical conditions, may be helpful in a number of ways. Past studies have shown that patients are interested in wellness topics and desire education in the form of brochures and books in the ED, and providing health and wellness information in that context could have public health impact. Videos explaining what to expect during an ED visit have been shown to increase patient satisfaction with the visit,4 and keeping patients in the waiting room occupied with educational material could theoretically reduce perceived wait time and alleviate some of the stress of the wait.10 Though participants in another survey thought a time tracker would improve their experience, our study shows that only around one-quarter of people actually want to know the wait times of others.11 Our study showed what seemed more important to the WR population as a whole was frequent updates about foreseeable delays coming from any person on the ED team; it did not need to be a physician giving updates.
Only 69% of our survey respondents knew the functions of a teaching hospital. This means that facts about the hospital being visited and about the meaning of a teaching hospital could be communicated to those in the ED waiting room to great effect. Providing this information could help remove some of the stress-inducing confusion patients may experience when they do not understand certain aspects of their visit, such as why they are seen by trainees at various levels of education. Information about average times for procedures, radiology, laboratory tests, consults, and admission seem to be greatly needed; respondents’ estimates of these times had massive standard deviations, indicating limited knowledge of ED time courses. This would increase transparency as patients gain understanding of what is happening during their visit and how much time they can reasonably expect it to take. In theory, this could also reduce the stress and frustration of waiting.10
Non-Caucasian ethnicities seem especially primed for increased education and communication as compared to Caucasians; their understanding of ED function and teaching hospitals was significantly lower while their requests for information on ED function was significantly higher. These differences do not appear to be related to language, since the proportions of respondents who correctly answered these questions were not significantly different between the Spanish and English surveys. Among other things, these findings could represent variations in cultural beliefs regarding the value and objective of a healthcare visit or disparities in healthcare literacy between different ethnic groups.
LIMITATIONS
There are limitations to this study. First, the survey was only distributed in one ED with its given demographics. This limits the ability to generalize our findings to other EDs. In particular, suburban or rural ED demographics might differ substantially from ours and thus might limit generalizability of our findings to those settings.
Second, there were respondents who did not, or were not able to, return our survey after agreeing to participate. Among other reasons, this occurred because patients were called into the ED to be seen, patients left without being seen, and patients reconsidered their decision to participate in the survey before completing it. Our decision to concentrate primarily on the WR as a focus for patient education guided our methodology of administering a survey in the WR before a patient visit in the ED proper. This limited our ability to assess patient satisfaction with the visit itself or patient understanding of discharge instructions. We are thus not able to draw any conclusions about patients’ comprehension of those aspects of their visit.
We did not explore whether a higher proportion of respondents would have reported a preference for receiving updates from higher-level providers (e.g., physicians or nurses) if they knew those updates would not influence their wait time. While our survey text did not suggest any link between receiving updates from physicians or nurses and increased wait times, we cannot rule out the possibility that many respondents held this belief. This presents an additional opportunity to educate patients about the workflow within the ED.
Finally, our survey was only in two languages. This restricted responses from a minority of people approached because of fluency in only an additional language. Financial, time, and availability constraints limited the availability of interpreters for use in this study. Future avenues of research could include repeating this study in additional locations; adding more languages; expanding the survey to examine patient understanding of actual visits with a physician and subsequent discharge instructions; and implementing and evaluating the findings of this research, such as by providing more information on ED function and major medical emergencies.
CONCLUSION
The ED waiting room is the first stop for the majority of patients to be seen at the hospital. Here, we have identified multiple areas where limited knowledge, 70% knowledge of triage and 69% knowledge of teaching hospitals, and a desire for more information overlap in the ED waiting room population. The significant differences in knowledge and desire for education material in non-Caucasian ethnicities are an important finding and should direct future projects to take each ED’s ethnicities into account. These findings suggest possible high-impact targets for intervention in patient education and ED throughput with the goal of improving patient satisfaction. These could include providing educational materials about hospital and ED function and severe health conditions (both reported as highly desired), as well as giving regular updates regarding foreseeable delays. Further study, potentially including targeted trials of the above interventions, would be needed to address whether these changes would have any measurable impact on patient satisfaction or would improve the patient experience in the ED.
ACKNOWLEDGEMENTS
The authors would like to acknowledge Pamela Simon and Rachel Blumhagen for their assistance with statistical analysis.
Footnotes
Supervising Section Editor: Douglas Ander, MD
Full text available through open access at http://escholarship.org/uc/uciem_westjem
Address for Correspondence: Thomas Seibert, MD MS, 1542 Tulane Avenue Room 452 Box T4M2, New Orleans, LA 70112. Email: Thomas.Seibert@ucdenver.edu.
Submission history: Submitted December 10, 2013; Revision received August 14, 2014; Accepted September 23, 2014
Conflicts of Interest: By the WestJEM article submission agreement, all authors are required to disclose all affiliations, funding sources and financial or management relationships that could be perceived as potential sources of bias. The authors disclosed none.
REFERENCES
- CDC faststats. Available at: http://www.cdc.gov/nchs/fastats/emergency-department.htm. Accessed Sept 30, 2014.
- Pitts SR, Pines JM, Handrigan MT, et al. National trends in emergency department occupancy, 2001 to 2008: effect of inpatient admissions versus emergency department practice intensity. Ann Emerg Med. 2012;60(6):679-686.e3.
- Horwitz LI, Green J, Bradley EH. US emergency department performance on wait time and length of visit. Ann Emerg Med. 2010;55:133-41.
- Delgado MK, Ginde AA, Pallin DJ, et al. Multicenter study of preferences for health education in the emergency department population. Acad Emerg Med. 2010,(17)6:652-58.
- Papa L, Seaberg DC, Rees E, et al. Does waiting room video about what to expect during an emergency department visit improve patient satisfaction? CJEM. 2008;10(4).
- McCarthy ML, Zeger SL, Ding R, et al. Crowding delays treatment and lengthens emergency department length of stay, even among high-acuity patients. Ann Emerg Med. 2009;54(4):492-503.
- Ibanez G, Guerin L, Simon N. Which improvements could prevent the departure of the left-without-being-seen patients? Emerg Med J. 2011;28(11):945-7.
- Nestler DM, Fratzke AR, Church CJ, et al. Effect of a physician assistant as triage liaison provider on patient throughput in an academic emergency department. Acad Emerg Med. 2012;19(11):1235-41
- Ibanez G, Guerin L, Simon N. Which improvements could prevent the departure of the left-without-being-seen patients? Emerg Med J. 2011;28(11):945-7.
- Fottler MD, Ford, RC. Managing patient waits in hospital emergency departments. Health Care Manag (Frederick). 2002;21(1):46-61.
- Shaikh SB, Witting MD, Winters ME, et al. Support for a waiting room time tracker: a survey of patients waiting in an urban ED. J Emerg Med. 2013;44(1):225-9.