
| Author | Affiliation |
|---|---|
| Brendan T. Parker, MS | University of Toledo Medical Center, Toledo, Ohio |
| Catherine Marco, MD | University of Toledo Medical Center, Toledo, Ohio |
Introduction
Methods
Results
Discussion
Limitations
Conclusion
ABSTRACT
Introduction
Managing a patient’s expectations in the emergency department (ED) environment is challenging. Previous studies have identified several factors associated with ED patient satisfaction. Lengthy wait times have shown to be associated with dissatisfaction with ED care. Understanding that patients are inaccurate at their estimation of wait time, which could lead to lower satisfaction, provides administrators possible points of intervention to help improve accuracy of estimation and possibly satisfaction with the ED. This study was undertaken to examine the accuracy of patient estimates of time periods in an ED and identify factors associated with accuracy.
Method
In this prospective convenience sample survey at UTMC ED, we collected data between March and July 2012. Outcome measures included duration of each phase of ED care and patient estimates of these time periods.
Results
Among 309 participants, the majority underestimated the total length of stay (LOS) in the ED (median difference −7 minutes (IQR −29-12)). There was significant variability in ED LOS (median 155 minutes (IQR 75–240)). No significant associations were identified between accuracy of time estimates and gender, age, race, or insurance status. Participants with longer ED LOS demonstrated lower patient satisfaction scores (p<0.001).
Conclusion
Patients demonstrated inaccurate time estimates of ED treatment times, including total LOS. Patients with longer ED LOS had lower patient satisfaction scores.
INTRODUCTION
Patient satisfaction with medical care is crucial to ensuring a healthy and productive physician-patient relationship and patient compliance with recommended therapies. Managing a patient’s expectations in the emergency department (ED) environment is challenging.1 With the ED tending to be the gateway to access care in the hospital, the perception of the hospital may be solely based on the care received in the ED. Higher satisfaction is believed to improve health outcomes, decrease litigation against the hospital, may influence the selection of ED for the next visit and the possibility of reimbursement.2–5
Wait times can have a huge influence, both positive and negative, on patient satisfaction.6–9 Lengthy wait times have shown to be associated with dissatisfaction with ED care.10,11 Wait times can be viewed two dimensionally: actual wait time (AWT) and the patient’s perception of wait time (PWT). Understanding the relationship between these 2 dimensions is important because if they are inaccurate, it may be a source of unwarranted dissatisfaction. Understanding that patients are inaccurate at their estimation of wait time, which could lead to lower satisfaction, provides administrators possible points of intervention to help improve accuracy of estimation and possibly satisfaction with the ED.
This study was undertaken to establish the accuracy of the patients wait time in a university hospital ED and examine possible associations of accuracy with demographic factors. A second objective was to examine potential associations between length of stay (LOS) and satisfaction with medical care.
METHODS
Study Design
We undertook this prospective convenience sample survey to measure ED treatment and wait times, and patient estimates of these wait times. A trained research assistant verbally administered a patient survey, who then recorded the responses of each patient. The survey collected patient estimates of wait times for the following time points: arrival to triage, triage to treatment room, treatment room to nurse, treatment room to physician, lab sample collection to discharge, and total time. We defined lab tests as any test that included urine or blood, excluding radiology tests. Demographic information collected included age, gender, ethnicity, insurance status, education level, presence of a time piece, and satisfaction with the medical care they received that day based on a 5-point Likert-type scale. After the patient survey was completed, the research assistant collected data from the ED electronic medical records and recorded actual time points for each patient. This study received approval from the institutional review board.
Setting and Population
The study was undertaken at the University of Toledo Medical Center (UTMC) ED from March 2012 to July 2012. The hospital is a 320-bed Level 1 trauma center, urban, university hospital. The ED has an annual patient volume of 34,000 with a 24% admission rate. Convenience sample of all adult ED patients, age 18 and over, who were ED patients in the UTMC ED were eligible for the study. Patients who were in distress, unable to communicate or who chose not to participate were excluded from enrollment.
Data Analysis and Sample Size
The primary outcome of the study is the within-person difference between a patient’s estimate of their wait time(s) and their actual wait time(s). This within-person difference was calculated as patient wait time (PWT) minus actual wait time (AWT). The raw difference between the patient’s estimate of time and the actual time was then used to describe the patient’s accuracy. Positive differences indicated overestimation and negative differences indicated underestimation. We summarized the differences with mean and interquartile ranges (25th percentile and 75th percentile), and the mean difference was tested for significance from zero using a 2-tailed paired t-test. With the study examining 4 time intervals, we used a 2-tailed p-value <0.01 to indicate statistical significance. Patient characteristics and satisfaction are described with frequency and percentage.
RESULTS
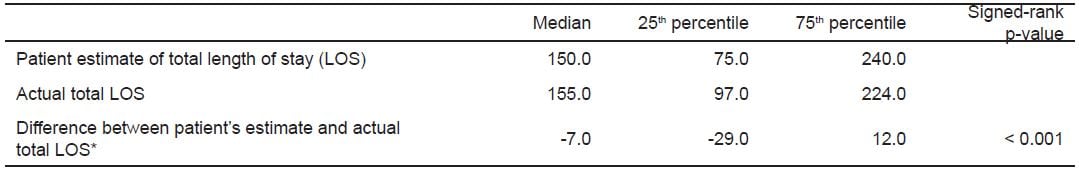
Of the 314 total respondents, data were collected on 309 patients. The 5 patients who elected not to be included in the study were for a variety of reasons not related to patient satisfaction, including the desire to leave because of their transportation and the patient determination of inability to accurately answer the questions due to the medications they had received during treatment. As described in Table 1, we gathered data across a spectrum of patients who visited the UTMC ED. Overall total LOS in the ED was defined as time of arrival to time of discharge as documented in the electronic medical records (EMR) and are reported in Table 2. In general, patients underestimated patient’s total time in the ED. The median difference between patient’s estimate and actual total LOS of −7 minutes (interquartile range [IQR] −29, 12) was statistically significant (p<0.001).
Table 1. Demographics and other characteristics of the emergency department visit, n=309.
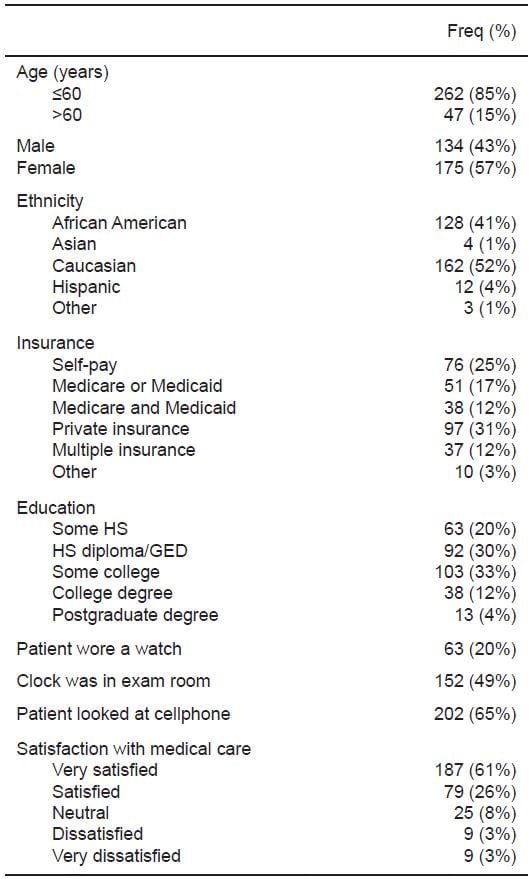
HS, high school; GED, general educational development
Table 2. Overall total length of stay, n=307.
Results for the different time points are reported in Table 3. The number of patients analyzed for this varied depending on if they passed that checkpoint and if it was recorded properly, among other things. Looking at the different time points, patients underestimated by 1 minute (IQR −4, 3) the time from arrival until triage nurse and significantly underestimated by 8 minutes (IQR −14, 1) triage assessment until transfer to the treatment room. Once in the treatment room, patients significantly overestimated by 1 minute (IQR 0, 5) the time until a nurse came to see the patient and significantly underestimated by 6 minutes (IQR −17, 4) the time until the patient saw the physician. If lab samples were drawn, patients underestimated by 9 minutes (IQR −40, 22) the time from when the samples were drawn until discharge. In general, we found that patients poorly estimated their wait times at 4 different time points during their visit to the UTMC ED.
Table 3. Time points.
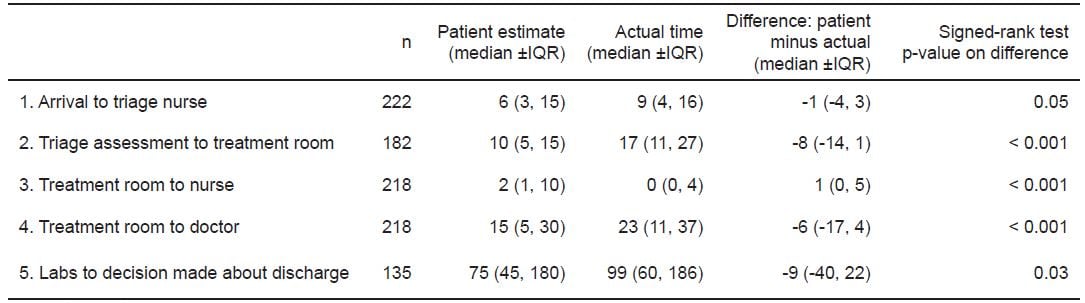
IQR, interquartile range
Table 4 represents our data for different subgroups of our population. For gender, there was no statistically significant difference detected between male (−7 minutes (IQR −26, 14)) and female (−8 minutes (IQR −31, 12)) estimations of their LOS compared to their actual total LOS. For age, there was no statistically significant difference detected between patients under age 60 (−8 minutes (IQR −29, 12)) and those older than 60 (−5 minutes (IQR −16, 8)). There was also no statistically significant difference detected between different ethnicity’s estimation and their actual total LOS. Those patients designating African American underestimated by 10 minutes (IQR −28, 15), Caucasians underestimated by 7 minutes (IQR −30, 10) and all other ethnicities collectively having a median difference of zero (IQR = −25, 8). For insurance status no statistically significant difference was detected between self pay (−4 minutes (IQR −27, 8)), Medicare/Medicaid (−11 minutes (IQR −32, 16)), private insurance (−7 minutes (IQR −29, 6)), and those categorized as “Other” (−3 minutes (IQR −29, 12)). Patients who carried more than one health insurance, military insurance or others were put into one category of “Other.” For education, while we found a decrease in the difference between PWT and AWT with more education, there was no statistically significant difference found between patients with some high school (−10 minutes (IQR −30, 16)), high school diploma (−9 minutes (IQR −26, 15)), some college (−6 minutes (IQR −32, 8)) and college/postgraduate degree (−5 minutes (IQR −22, 12)). Although we found a large difference between having a timepiece (−6 minutes (IQR −27, 12)) versus not having one (−21 minutes (IQR −32, 2)) during the visit, our data found no statistically significant difference. We defined having a time piece as whether the patient had a watch, the presence of a clock in the room or whether the patient looked at their cell phone for any reason during their visit. In our study, we saw no statistically significant difference between accuracy of estimations and gender, age, ethnicity, insurance status, education or presence of a time piece with the patient.
Table 4. Subgroups.
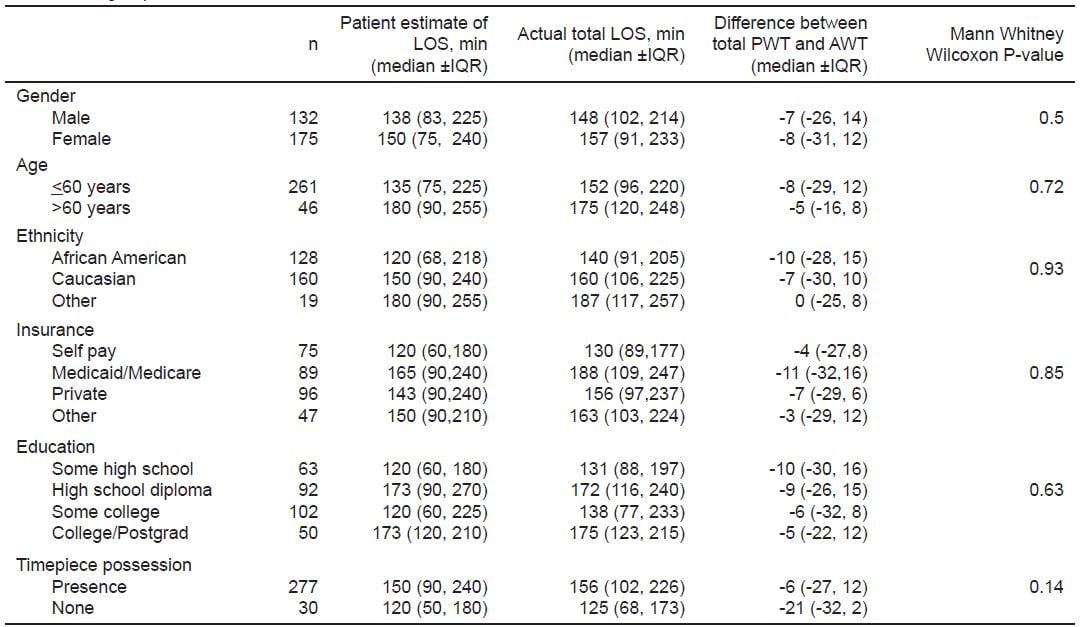
LOS, length of stay; PWT, patient wait time; AWT, actual wait time; IQR, interquartile range
Our study, as reported in Table 5, found correlations between LOS and patient satisfaction. In regards to total estimated LOS, we found a statistically significant difference between patients who described their experience as “very satisfied” (120 minutes (IQR 60, 120)), “satisfied” (150 minutes (IQR 90, 240)), and “not satisfied” (195 minutes (IQR 150, 270)). People who described their experience as “neutral,” “dissatisfied,” or “very dissatisfied” were grouped under “not satisfied.” In regards to total actual LOS, we also found a significant difference with our 3 satisfaction categories. Although we found differences in estimation and actual total length of stay, the difference between estimated and actual total LOS had no statistical difference between the 3 categories. In the figure, we broke down percentage of patients in each patient satisfaction category and compared that to total length of time by hour. For any patients with actual total LOS over 7 hours, they were grouped into the 7-hour category. Trend lines were provided in the figure to show the general change for each satisfaction category. The top trend line shows a decrease in the percentage of “very satisfied” patients while the middle and bottom trend lines show an increase in the percentage of “satisfied” and “not satisfied” patients respectively. In general, our study showed that with an increase in time spent in the ED, there is a decrease in patient satisfaction. While we found no correlation between inaccuracy and satisfaction level, we did find longer ED LOS was associated with lower satisfaction.
.")
Figure. Patient satisfaction with actual total length of stay (LOS).
Table 5. Patient satisfaction.
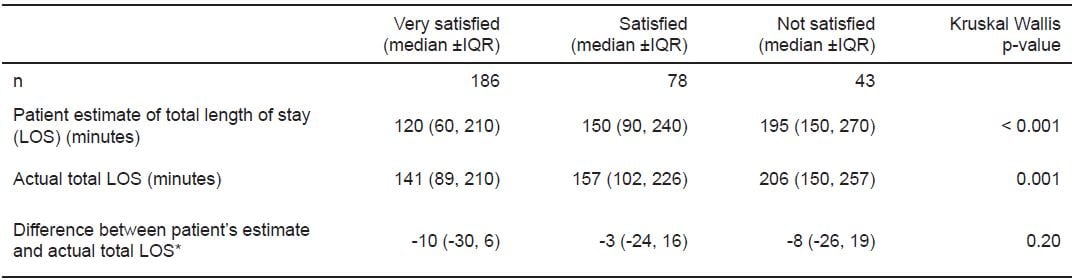
IQR, interquartile range
DISCUSSION
Previous studies have demonstrated that ED patients are inaccurate in estimating their wait times in the ED.10–12 Many factors, such as perceived severity of their case and activity in the ED at the time of visit, can influence how a patient perceives time. The data we collected, which was surprising and different than the literature,10,12 showed that patients collectively underestimated their total LOS. Our data also suggest a small interquartile range for the difference between the patient’s estimation and actual total LOS. This suggests that while patients are significantly inaccurate at their estimation (p<0.001), they are remarkably closer than first hypothesized. With multiple time points having a significant difference between the perception and actual time, our study suggests that during the entire process of an ED visit, patients are relatively inaccurate at estimating the treatment time.
Understanding that ED patients have a variety of backgrounds in the ED, our study also examined subgroups that included gender, age, ethnicity, insurance status, education and presence of a time piece. Our initial intention was to look for any points of intervention that administration could use to help those whose perception was inaccurate improve, therefore possibly improving their satisfaction. Our study suggests that there are no differences in estimations and actual wait times based on these 6 subgroups. Further studies into patient’s perception of urgency or pain may bring insight into reasons for inaccuracy.
Another aspect of our study that provided insight into wait times was the correlation between LOS and patient satisfaction. Patients who were very satisfied had shorter wait times, while those that were not satisfied had longer wait times. Decline in satisfaction is a major concern for the ED as it may lead to less patient compliance with recommended treatments, poor health outcomes, and increased litigation. In this study, patients who had decreased satisfaction commented on the lack of communication between the staff and patient. While each patient’s expected stay varies depending on their complaint, future research could look at how to improve communication with staff to help improve patient satisfaction.
LIMITATIONS
This study was conducted at a single institution and results may not be generalizable to other locations. As a prospective convenience sample, the study may not be completely reflective of the population. The study relied on patient self reports and the accuracy depends on patient effort and veracity. As the study was verbally administered, some questions and statements could have varied between patients therefore our patients’ responses and data could be altered. With verbal administration from a trained research assistant, patient satisfaction may have been slightly altered with the perception that the institution was giving the patient preferential treatment. Other factors related to patient satisfaction were not included in this study, such as patient expectations of treatment, crowding of the ED or politeness of staff. Satisfaction may have also been altered as the survey was sometimes administered right after painful medical injections or with the staff in the room performing different tasks.
CONCLUSION
Patients demonstrated inaccuracy in estimation of ED treatment times, including total LOS. We found no significant associations between accuracy of estimations of treatment times and age, gender, ethnicity, insurance status, education or presence of a time piece. Patients with longer ED LOS had lower patient satisfaction scores.
Footnotes
Address for Correspondence: Brendan T. Parker, MS. Department of Emergency Medicine, The University of Toledo Medical Center, 3000 Arlilngton Ave. MS 1088, Dowling Hall 2455, Toledo, OH 43614. Email: brendan.parker@rockets.utoledo.edu. 3 / 2014; 15:170 – 175
Submission history: Revision received January 5, 2013; Submitted June 25, 2013; Accepted September 16, 2013
Conflicts of Interest: By the WestJEM article submission agreement, all authors are required to disclose all affiliations, funding sources and financial or management relationships that could be perceived as potential sources of bias. The authors disclosed none.
REFERENCES
1. Lateef F. Patient expectations and the paradigm care shift of care in emergency medicine. J Emerg Trauma Shock. 2011;4:163-167.
2. Waitzkin H. Doctor-patient communication. Clinical implications of social scientific research. JAMA. 1984;252:2441-2446.
3. Linn LS, Brook RH, Clark VA, et al. Physician and patient satisfaction as factors related to the organization of internal medicine group practices. Med Care. 1985;23:1171-1178.
4. Mack JL, File KM, Horwitz JE, et al. The effect of urgency on patient satisfaction and future emergency department choice. Health Care Manage Rev. 1995; 20:7-15.
5. Freudenheim M. In a Shift, an H.M.O. Rewards Doctors for Quality Care. The New York Times. July 11, 2001.
6. Cordell W, Olinger M, Kozak, et al. Does Anybody Know What Time It Is? Does Anybody Really Care?. Ann Emerg Med. 1994;23:1032-1036.
7. Mowen JC, Licata J, McPhail J. Waiting in the Emergency Room: How to Improve Patient Satisfaction. J Health Care Marketing. 1993;13:26-33.
8. Thompson D, Yarnold P. Relating Patient Satisfaction to Waiting Time Perceptions and Expectations: The Disconfirmation Paradigm. Acad Emerg Med. 1995;2:1057-1062.
9. Tran P, Schutte W, Muelleman R, et al. Provision of Clinically Based Information Improves Patient’s Perceived Length of Stay and Satisfaction with EP. Am J Emerg Med. 2002; 20:506-509.
10. Waseem M, Ravi L, Radeos M, et al. Parental Perception of Wait Time and Its Influence on Parental Satisfaction in an Urban Pediatric Emergency Department: Are Patients Accurate in Determining Wait Time?. South Med J. 2003;96:880-883.
11. Little N. Image of the Emergency Physician. Emergency Medicine Risk Management: A Comprehensive Review. 1991;11-16.
12. Thompson D, Yarnold P, Adams S, et al. How Accurate are Waiting Time Perceptions of Patients in the Emergency Department. Ann Emerg Med. 1996;28:652-656.
13. Tran T, Schutte W, Muelleman R, et al. Provision of Clinically Based Information Improves Patients’ Perceived Length of Stay and Satisfaction with EP. Am J Emerg Med. 2002; 20:506-509.